USDJPY Double Harmonic Set Up USDJPY has a very interesting daily chart where if it makes a clear move in either direction, we complete a harmonic pattern. Whether the market rallies to retest the highs or continues to sell off, we have completions with confluence with previous important S/R levels. We will watch and see what way it goes and publish an update on it if it looks likely to give us an opportunity.
Forex-usdjpy

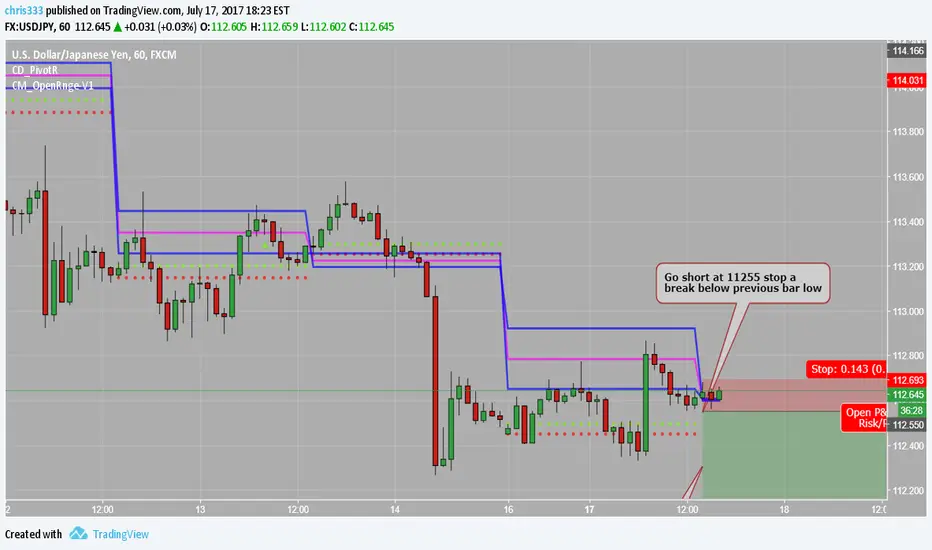
Below Pivot Go Short a Break BelowAction to Take: Go Short, enter sell at 11255 stop
Take Profit Level: TP1 11231, TP2 111736 Stop Loss Level: 112693
Additional Factors:
Timeframe: ~ 24 hours
Total Risk of Account Equity: 2% or less
Strong Buy. Trend Is FriendMonthly Summary is Strong Buy
Pivot point 111.400
Keep close eye on price action
Market open 114.10
Last week we seen a strong bullish impulse
Should see consolidation period
Im still long until the strong resistance handle of 115.500
pay close attention to your confirmation and confluence signals.

USDJPY SHORTShort term a good short as rejected resistance now forming a down trend to support line.

USDJPY DAILY SHORT HARMONICSHere is a harmonic pattern that has been recognised in the candlesticks below.
If there are any questions please private message me,
Enjoy!

Usd\Jpy Weekly viewUsd\Jpy is in an interesting place, a combination of the weekly 50 fib level, and a double bottom is setting in the daily chart, will definitely monitor this one for possible long opportunities

USD/JPY OutlookPrice is currently sitting on a major support in the 110.230 area. If it breaks through and closes below, expect s continued downside trend. It may also bounce back off of the 110.230 support and climb its way back up to the 112.000 resistance area

USDJPY - Consolidation before Short?If stars align, risk aversion should continue supporting a potential short in the equity markets along with a weaker USDJPY, and stronger USD across the other majors. While I'm not taking a short just yet, this is just a setup that I will be monitoring over the next few weeks. Fundamentally, there aren't many reasons for equity bulls to keep pressing higher highs, and any negative news could quickly spiral the into a selling frenzy.


EU buy on any breakout of its channel...EU buy on any breakout of its channel and target 1.06 levels Good Luck!

USDJPY remains under pressureUSD/JPY remains under pressure. Momentum readings and the Tension Indicator (not shown) continue to weaken, highlighting fresh downside risks in the coming weeks.
A close below the 111.59 low of 7 February will confirm continuation of the December 2016 bear trend, with focus then turning to the 110.27 low of 22 November. Just lower is the 109.93 Fibonacci retracement, but any further slippage beneath here should stabilise towards the 107.85 retracement, as mixed background studies keep investors cautious.
A close above the 115.00 break level is needed to stabilise price action. However, any immediate bounce is expected to remain capped beneath here, as short-term studies also follow weekly readings lower.


2 charts. Is USD/JPY due for a bounce?Above is what I am currently watching on this pair.
The outcome will largely depend on what the NFP report is relative to expectations.
I would not trade until after the report at 7:30 a.m. CST.
Have a good night:)

Dollar Yen breaking lower and testing 21-day EMAA break below and we could be looking at 112.50 to pick up the 55-day EMA and a 38.2% retracement

DOWNSIDE EXPECTED FOR EURJPYBearish market structure is beginning to emerge for eurjpy. All technicals are indicating a correction/move to test the bottom of the channel

2 POTENTIAL TRADE SETUPS ON USDJPYI wanted to share 2 potential trade setups here on USDJPY. The first being IF - price rallies from here up to the 113.20 (without breaking the 111.358 levle) we would have a bear gartley completion. The second being IF - the A point of the potential bear gartley is broken & price pushes lower to the 110.82's we would have a harmonic move, 127 fib ext, Along with a 786 fib retracement & the 111.000 handle a little higher. I would then wait for say a double bottom or a 2618 trade setup to get long. Just a thought.

USDJPYWaiting break this resistance and buy on retest.
It's A possibility to make profits.
Attention please. It is not a forecast, I`am just wondering if is possible.

USD/JPY short-term shortWe are at a historical high and low. There should be strong resistance here, as we've seen over the past few days. A small pullback is in order before we can go higher. Target 110 as it is the 9 day EMA bounce point.


Usd/Jpy : Looking for a break of the trendlineThe BoJ event finished a double three corrective pattern in usdjpy and price is now ready to go higher. Look for a break of the trendline for confirmation of the uptrend which should eventually go above 104.30.

Narrowing price range, upcoming trend breakout and opportunitiesBuy or sell according to trendlines but it wil go under 100.500 a few days later and go UP for a long time.

Possibly a long consolidation period | Weekly chartHi guys;
As human nature like simplicity, a long consolidation period due to being the price around 100 is highly possible. It will move up or down but, after a while

Swinging both ways (not that there's anything wrong with that)We have two pretty good options on USDJPY, a break above 102.50 could take this up for a quick move into 103.20 and even 103.50. However if this holds below 102.50 I'll be looking for the larger trend line break around 102.00 and a move into 100.00 and even 99.00.
I'll take this either direction, if either break puts up a fight I'll exit quickly with small losses.
www.daytradersfx.com
