GBP_USD RISING SUPPORT AHEAD|LONG|
✅GBP_USD is going down now
But a strong rising support level is ahead
Thus I am expecting a rebound
And a move up towards the target of 1.3600
LONG🚀
✅Like and subscribe to never miss a new idea!✅
Disclosure: I am part of Trade Nation's Influencer program and receive a monthly fee for using their TradingView charts in my analysis.
Forex

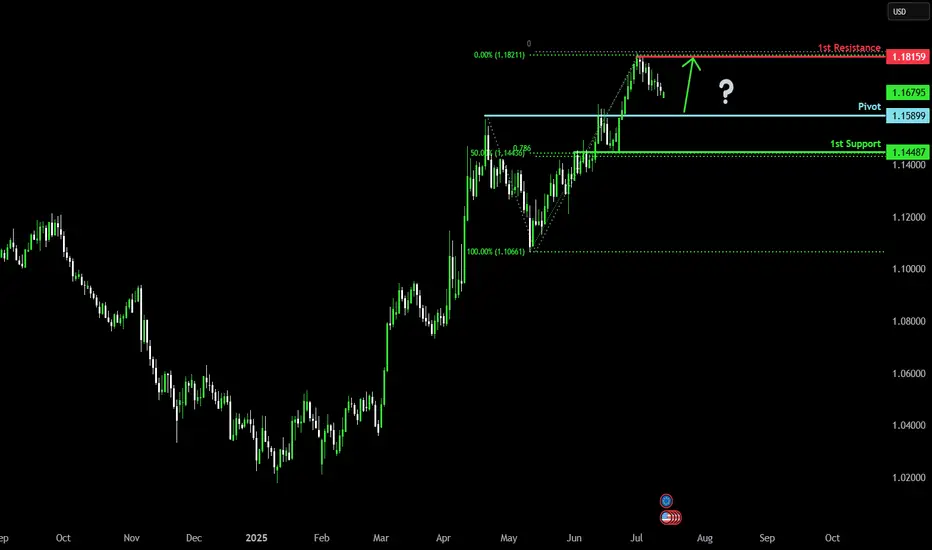
Bullish continuation?The Fiber (EUR/USD) is falling towards the pivot, which has been identified as a pullback support and could bounce to the 1st resistance.
Pivot: 1.1589
1st Support: 1.1448
1st Resistance: 1.1815
Risk Warning:
Trading Forex and CFDs carries a high level of risk to your capital and you should only trade with money you can afford to lose. Trading Forex and CFDs may not be suitable for all investors, so please ensure that you fully understand the risks involved and seek independent advice if necessary.
Disclaimer:
The above opinions given constitute general market commentary, and do not constitute the opinion or advice of IC Markets or any form of personal or investment advice.
Any opinions, news, research, analyses, prices, other information, or links to third-party sites contained on this website are provided on an "as-is" basis, are intended only to be informative, is not an advice nor a recommendation, nor research, or a record of our trading prices, or an offer of, or solicitation for a transaction in any financial instrument and thus should not be treated as such. The information provided does not involve any specific investment objectives, financial situation and needs of any specific person who may receive it. Please be aware, that past performance is not a reliable indicator of future performance and/or results. Past Performance or Forward-looking scenarios based upon the reasonable beliefs of the third-party provider are not a guarantee of future performance. Actual results may differ materially from those anticipated in forward-looking or past performance statements. IC Markets makes no representation or warranty and assumes no liability as to the accuracy or completeness of the information provided, nor any loss arising from any investment based on a recommendation, forecast or any information supplied by any third-party.
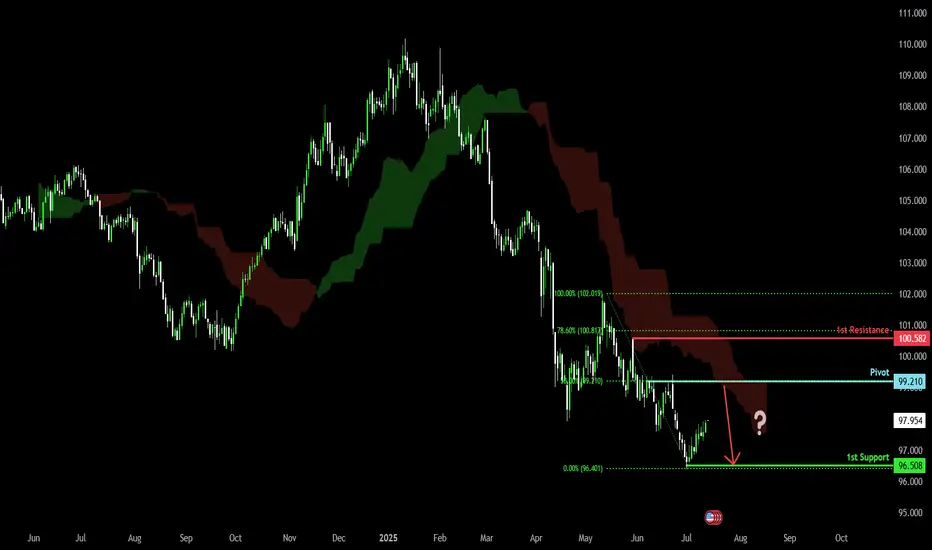
Bearish continuation?US Dollar Index (DXY) is risng towards the pivot which is a pullback resistance and could drop to the 1st support.
Pivot: 99.21
1st Support: 96.50
1st Resistance: 100.58
Risk Warning:
Trading Forex and CFDs carries a high level of risk to your capital and you should only trade with money you can afford to lose. Trading Forex and CFDs may not be suitable for all investors, so please ensure that you fully understand the risks involved and seek independent advice if necessary.
Disclaimer:
The above opinions given constitute general market commentary, and do not constitute the opinion or advice of IC Markets or any form of personal or investment advice.
Any opinions, news, research, analyses, prices, other information, or links to third-party sites contained on this website are provided on an "as-is" basis, are intended only to be informative, is not an advice nor a recommendation, nor research, or a record of our trading prices, or an offer of, or solicitation for a transaction in any financial instrument and thus should not be treated as such. The information provided does not involve any specific investment objectives, financial situation and needs of any specific person who may receive it. Please be aware, that past performance is not a reliable indicator of future performance and/or results. Past Performance or Forward-looking scenarios based upon the reasonable beliefs of the third-party provider are not a guarantee of future performance. Actual results may differ materially from those anticipated in forward-looking or past performance statements. IC Markets makes no representation or warranty and assumes no liability as to the accuracy or completeness of the information provided, nor any loss arising from any investment based on a recommendation, forecast or any information supplied by any third-party.
EUR-CHF Local Long! Buy!
Hello,Traders!
EUR-CHF is about to retest
The strong horizontal support
Of 0.9298 and as the pair
Is locally oversold we will be
Expecting a local bullish
Rebound and a move up
Buy!
Comment and subscribe to help us grow!
Check out other forecasts below too!
Disclosure: I am part of Trade Nation's Influencer program and receive a monthly fee for using their TradingView charts in my analysis.

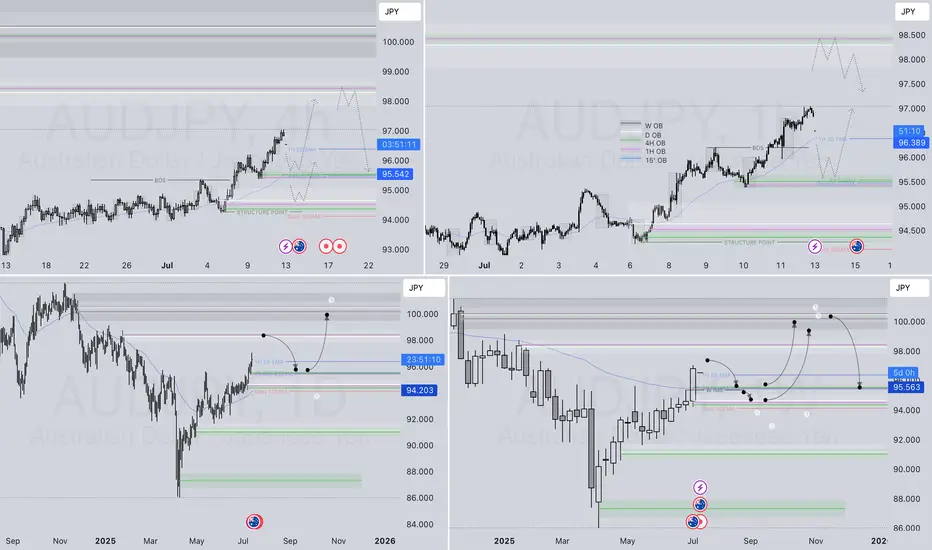
AUDJPY LONG & SHORT – WEEKLY FORECAST Q3 | W29 | Y25💼 AUDJPY LONG & SHORT – WEEKLY FORECAST
Q3 | W29 | Y25
📊 MARKET STRUCTURE SNAPSHOT
AUD JPY is currently reaching for a key higher time frame supply zone, looking for price action to show weakness at premium levels. Structure and momentum are now aligning for a short opportunity backed by multi-timeframe confluence.
🔍 Confluences to Watch 📝
✅ Daily Order Block (OB)
Looking for Strong reaction and early signs of distribution.
✅ 4H Order Block
Break of internal structure (iBoS) confirms a short-term bearish transition.
✅ 1H Order Block
📈 Risk Management Protocols
🔑 Core principles:
Max 1% risk per trade
Only execute at pre-identified levels
Use alerts, not emotion
Stick to your RR plan — minimum 1:2
🧠 You’re not paid for how many trades you take, you’re paid for how well you manage risk.
🧠 Weekly FRGNT Insight
"Trade what the market gives, not what your ego wants."
Stay mechanical. Stay focused. Let the probabilities work.
🏁 Final Thoughts from FRGNT
📌 The structure is clear.
The confluences are stacked.
Let execution follow discipline, not emotion.
XAUUSD 4Hour TF - July 13th, 2025XAUUSD 7/13/2025
XAUUSD 4 hour Long Idea
Monthly - Bullish
Weekly - Bullish
Daily - Bullish
4hour - Bullish
Gold is looking pretty bullish this week as we saw a significant push above our 3,320.000 resistance zone. Looking to ride that same trend through this next week.
Bullish continuation - After a nice rally last week gold looks primed for another long setup. Ideally, price action goes for the retest of 3,320.000 and forms a higher low. This would confirm bullish structure and we can begin targeting higher toward major levels of resistance.
Bearish Reversal - For us to consider bearish setups we would first need to see a break back below 3,320.000 followed by a confirmed lower high. If this happens we can consider short positions and look to target lower toward major levels of support.

AUDCAD | Weekly Outlook | July 14, 2025🟦 AUDCAD | Weekly Outlook | ICT-Based Analysis
📅 Week Starting: July 14, 2025
🧠 "Don't chase — let the trade come to you."
🧭 Market Context (1H + HTF Alignment)
This chart outlines a clear Smart Money framework for AUDCAD using ICT principles. The market recently completed a manipulation phase below a major accumulation zone, forming a clear SMT divergence and respecting a CISD (Clean Internal Sell-side Displacement).
After manipulation and SMT confirmation, price respected the CISD and showed willingness to displace bullishly, suggesting a potential re-accumulation phase on the lower timeframes.
🔍 Key Observations
Accumulation + SMT:
We had a prolonged accumulation phase that led to a smart money manipulation (fakeout), marked by SMT divergence. This was followed by a bullish shift in structure, confirming intent.
CISD + CE Reaction:
Price respected the CISD zone and formed a bullish W reversal + OB/BI setup. This is a common ICT pattern before major expansions.
Re-Accumulation Area:
The current consolidation near ERL levels shows signs of controlled accumulation, with price respecting previous liquidity levels.
This area may act as a springboard for expansion towards HTF objectives.
📈 HTF Targeting: Reversal Area + EQH
The chart marks a High Time Frame Reversal Area (HTF) above the current price, potentially acting as a premium inefficiency or sell-side liquidity target.
EOH (Expansion Objective High) is drawn in that same region, providing a long-term magnet for price.
This aligns with the broader Monthly Cycle expectation.
🔄 Monthly Cycle Analysis
“Monthly Cycle is Created — Open, Low... Now We Wait for the High and Close.”
This suggests:
Monthly Open and Low are already formed.
A bullish monthly cycle is anticipated — meaning we're waiting for the High to form next.
Once the high is set, a retracement towards the Close level is expected by the end of the month.
This macro view gives us context for aiming long positions on pullbacks — buying dips within the re-accumulation range.
⚠️ Trader's Insight
Don’t Chase — Let the Trade Come to You.
The setup is not about chasing price. Instead, the idea is to:
Wait for price to return to favorable zones (e.g., CE of OB inside CISD)
Confirm intent with LTF SMT, FVGs, or M15 structural shifts
Target HTF inefficiencies and liquidity zones (EOH & Reversal Area)
🎯 Bias for the Week
Bullish, based on:
Monthly cycle direction (expecting HIGH)
Price behavior post-CISD respect
Clear smart money accumulation and displacement
Re-accumulation on LTFs suggesting continuation

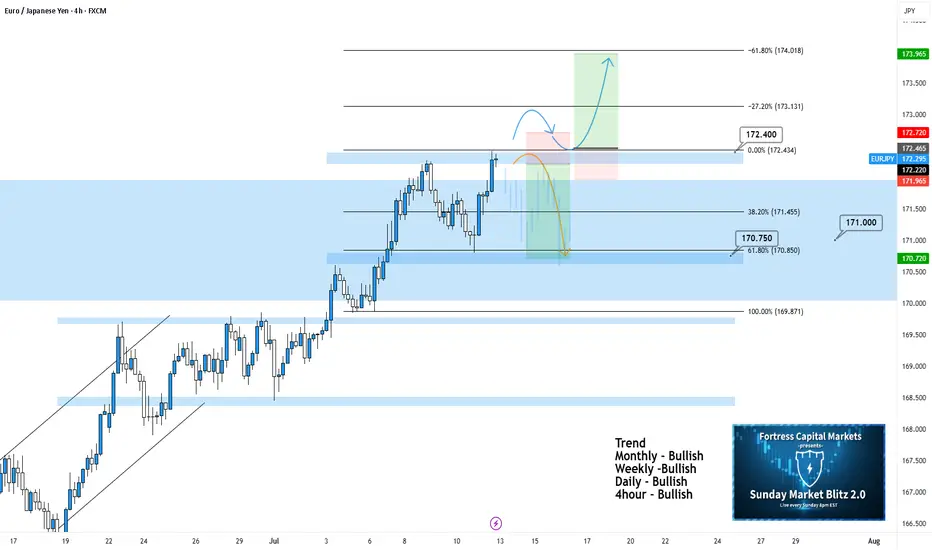
EURJPY 4hour TF - July 13th, 2025EURJPY 7/13/2025
EURJPY 4hour Bullish Idea
Monthly - Bullish
Weekly - Bullish
Daily - Bullish
4hour - Bullish
EJ has been paying out for the last couple weeks and the analysis has been spot on for these setups. Going into this week though we’re starting to get a bit uncertain. The fact that we’ve been in a rally since late June leaves me wondering how much more EJ has in it before a correction. So I think this week warrants some caution on EJ especially as we remain around this monthly 171.000 zone.
Let’s keep a look out for two potential scenarios going into this week:
Bullish Continuation - This is the most likely scenario and this idea lines up with all the major trends as well. For us to comfortably consider long setups I’d like to see a clear break above 172.400 zone / our 0% fib level followed by a retest for confirmation. This is what we would like to see but keep in mind price action has been moving aggressively and may not provide a retest.
Bearish Reversal into Range - This is a possibility but could also be a sign of consolidation around 171.000. There may be a decent short opportunity if we see the right kind of rejection/reversal from 172.400. In this scenario, it looks like this would be a potential range trade and I wouldn’t try to repeat this setup more than once.
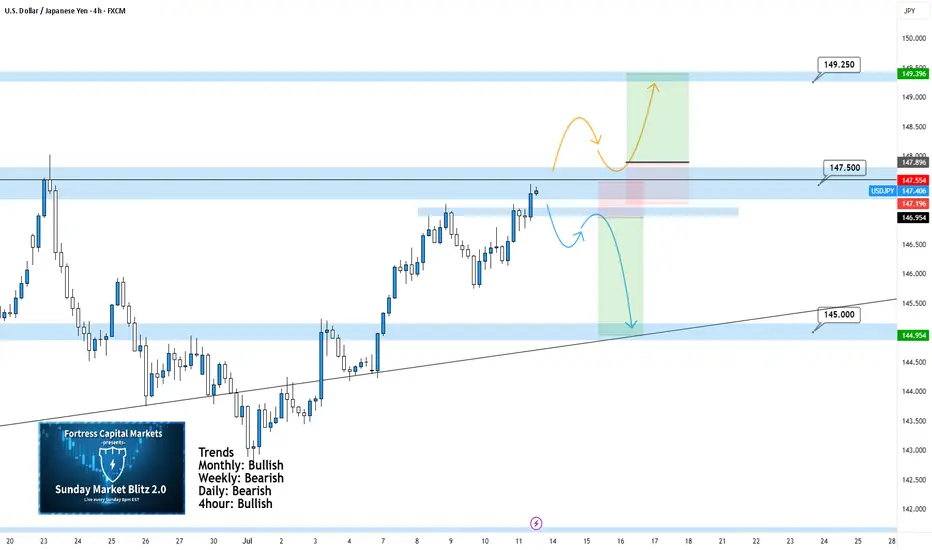
USDJPY 4Hour TF - July 13th, 2025USDJPY 7/13/2025
USDJPY 4Hour Neutral Idea
Monthly - Bullish
Weekly - Bearish
Daily - Bearish
4Hour - Bullish
Finally UJ is looking more clear. We’re now able to drop to the 4Hour instead of the Daily TF due to price action reaching a major zone of anticipated reactions.
As always we’re looking at two trade scenarios going into the week ahead:
Bullish Continuation - UJ is currently sitting at 147.500 resistance and closed there last week. Going into this week we could see the bullish trend continue but we would need to see a clear break of 147.500 resistance to gain confidence. Look for a higher low confirmed above 147.500 followed by strong bullish setups to enter long on. Look to target higher toward major resistance levels like 149.250 area.
Bearish Reversal: Despite the strong bullish momentum we saw from last week, a reversal is still possible as price action is near our 147.250 zone. In order to consider bearish setups we would need to see strong rejection from the current level of resistance. Look to target lower toward 145.000 support.
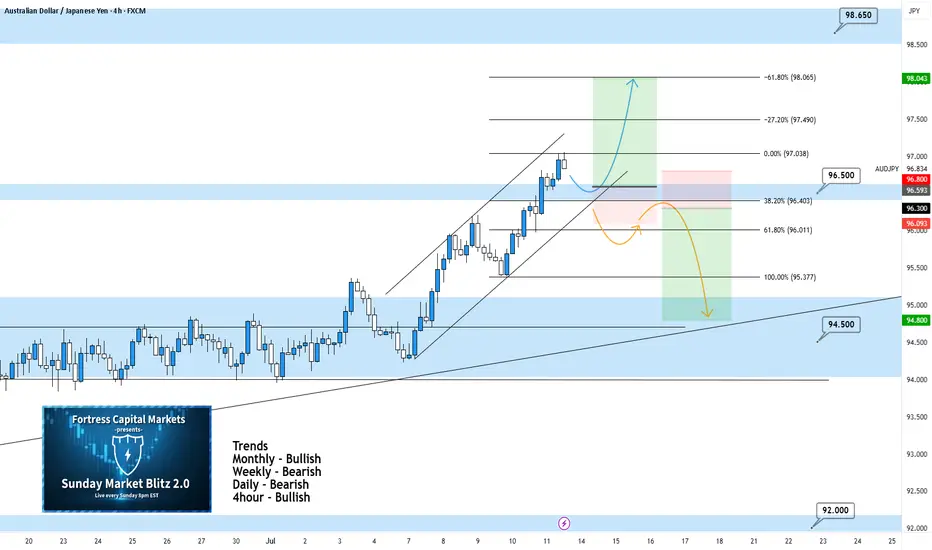
AUDJPY 4Hour TF - July 13th, 2025AUDJPY 7/13/2025
AUDJPY 4hour Bullish Idea
Monthly - Bullish
Weekly - Bearish
Dailly - Bearish
4hour - Bullish
Looking good on AJ! Last week’s analysis played out perfectly and we can see going into this week we have a similar scenario.
Here are the two potential trade paths for the week ahead:
Bullish Continuation - This is the most likely scenario going into this week as we just broke our 96.500 resistance and are now testing it as support. If we can confirm a higher low with strong bullish conviction we can look to enter long and target higher toward major resistance levels.
Bearish Reversal - For us to consider AJ bearish we would first need to see a break back below 96.500. If we can spot a clear trend change and some lower highs below 96.500 we can begin looking short. Target lower toward major support levels if this happens.
Bullish bounce off overlap support?AUD/USD is falling towards the support level which is an overlap support that is slightly above the 50% Fibonacci retracement and could bounce from this level too ur take profit.
Entry: 0.6546
Why we like it:
There is an overlap support that is slightly above the 50% Fibonacci retracement.
Stop loss: 0.6529
Why we like it:
There is a pullback support that aligns with the 61.8% Fibonacci retracement.
Take profit: 0.6590
Why we like it:
There is a pullback support.
Enjoying your TradingView experience? Review us!
Please be advised that the information presented on TradingView is provided to Vantage (‘Vantage Global Limited’, ‘we’) by a third-party provider (‘Everest Fortune Group’). Please be reminded that you are solely responsible for the trading decisions on your account. There is a very high degree of risk involved in trading. Any information and/or content is intended entirely for research, educational and informational purposes only and does not constitute investment or consultation advice or investment strategy. The information is not tailored to the investment needs of any specific person and therefore does not involve a consideration of any of the investment objectives, financial situation or needs of any viewer that may receive it. Kindly also note that past performance is not a reliable indicator of future results. Actual results may differ materially from those anticipated in forward-looking or past performance statements. We assume no liability as to the accuracy or completeness of any of the information and/or content provided herein and the Company cannot be held responsible for any omission, mistake nor for any loss or damage including without limitation to any loss of profit which may arise from reliance on any information supplied by Everest Fortune Group.

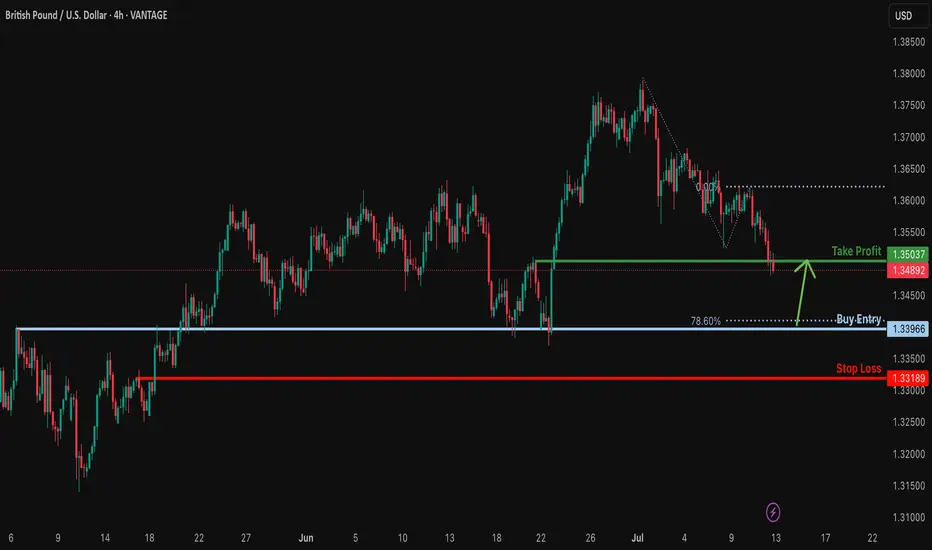
Falling towards major support?The Cable (GBP/USD) is falling towards the support which is an overlap support that lines up with the 78.6% Fibonacci projection and could bounce from this level to our take profit.
Entry: 1.3396
Why we like it:
There is an overlap support that lines up with the 78.6% Fibonacci projection.
Stop loss: 1.3318
Why we like it:
There is a pullback support.
Take profit: 1.3503
Why we like it:
There is a pullback support.
Enjoying your TradingView experience? Review us!
Please be advised that the information presented on TradingView is provided to Vantage (‘Vantage Global Limited’, ‘we’) by a third-party provider (‘Everest Fortune Group’). Please be reminded that you are solely responsible for the trading decisions on your account. There is a very high degree of risk involved in trading. Any information and/or content is intended entirely for research, educational and informational purposes only and does not constitute investment or consultation advice or investment strategy. The information is not tailored to the investment needs of any specific person and therefore does not involve a consideration of any of the investment objectives, financial situation or needs of any viewer that may receive it. Kindly also note that past performance is not a reliable indicator of future results. Actual results may differ materially from those anticipated in forward-looking or past performance statements. We assume no liability as to the accuracy or completeness of any of the information and/or content provided herein and the Company cannot be held responsible for any omission, mistake nor for any loss or damage including without limitation to any loss of profit which may arise from reliance on any information supplied by Everest Fortune Group.
Bullish bounce off 50% Fibonacci support?EUR/USD is falling towards the support level which is a pullback support that lines up with the 50% Fibonacci support and could bounce from this level to our take profit.
Entry: 1.1632
Why we like it:
There is a pullback support that lines up with the 50% Fibonacci retracement.
Stop loss: 1.1582
Why we like it:
There is an overlap support that is slightly below the 61.8% Fibonacci retracement.
Take profit: 1.1738
Why we like it:
There is an overlap resistance.
Enjoying your TradingView experience? Review us!
Please be advised that the information presented on TradingView is provided to Vantage (‘Vantage Global Limited’, ‘we’) by a third-party provider (‘Everest Fortune Group’). Please be reminded that you are solely responsible for the trading decisions on your account. There is a very high degree of risk involved in trading. Any information and/or content is intended entirely for research, educational and informational purposes only and does not constitute investment or consultation advice or investment strategy. The information is not tailored to the investment needs of any specific person and therefore does not involve a consideration of any of the investment objectives, financial situation or needs of any viewer that may receive it. Kindly also note that past performance is not a reliable indicator of future results. Actual results may differ materially from those anticipated in forward-looking or past performance statements. We assume no liability as to the accuracy or completeness of any of the information and/or content provided herein and the Company cannot be held responsible for any omission, mistake nor for any loss or damage including without limitation to any loss of profit which may arise from reliance on any information supplied by Everest Fortune Group.

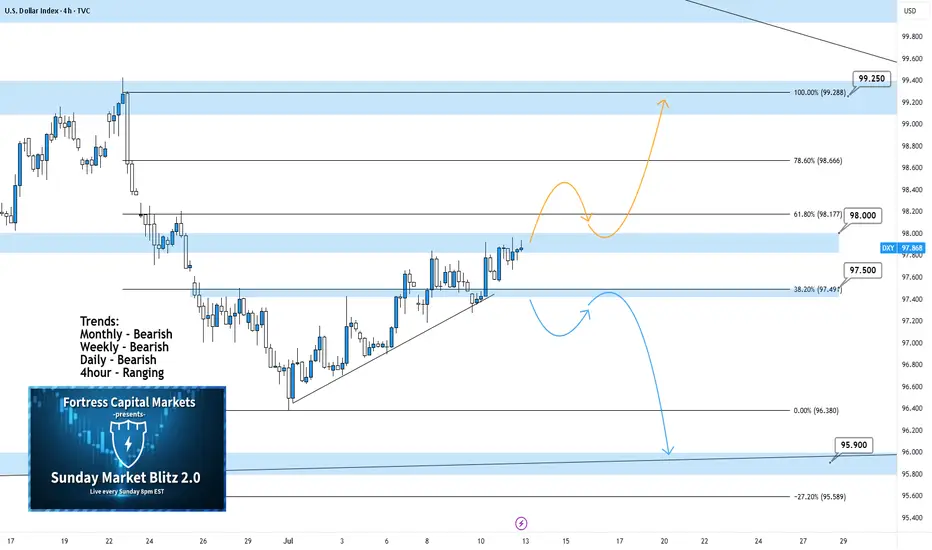
DXY 4Hour TF - July 13th, 2025DXY 7/13/2025
DXY 4hour Neutral Idea
Monthly - Bearish
Weekly - Bearish
Dailly - Bearish
4hour - Ranging
Keep in mind, we analyze and follow DXY more so as an indicator. The USD makes up for a large portion of trade so it makes sense to analyze it.
Going into this week we can see DXY made an attempt to push higher. Where it closed on Friday is a major zone around 98.000. We’re still majorly bearish on higher time frames so we will keep that in mind throughout this week.
As always, we will mark up two potential paths for this week, they are as follows:
Bullish Breakout - The two main zones we want to bring out attention to are 98.000 resistance and 97.500 support. We will have to wait until price action leaves this area to spot a high quality setup. Look for a convincing push above 98.000 resistance followed by a retest of 98.000 but as support. Look for a higher low to form with bullish confirmation to long on.
Bearish Continuation- Going bearish is still very possible we just need to clear 97.500 support first. Look for a break below 97.500 with a confirmed lower high and convincing bearish setups to short on.
#AN020: US Tariffs, Euro Weakness, USD Strength, Forex at Risk?
1. New US Tariff Threats Against the EU and Canada
Over the weekend, President Trump announced the sending of formal letters introducing new tariffs: 35% on Canadian goods and potential tariffs for the EU as well (15-20%).
Context: The return of protectionism fuels uncertainty.
Market Impact: Shift to safe-haven currencies — the US dollar gains ground, while EUR/USD and USD/CAD remain under pressure.
2. EUR/USD Below 1.1700
The EUR/USD pair closed the week below 1.1700, failing to recover.
3. GBP/USD Loses Ground
The GBP/USD pair fell below 1.3500, hitting a three-week low.
Factors: Disappointing UK GDP data + stronger USD.
Impact: Pressure on the pound, possible continuation of the downtrend to 1.3420 unless better data emerges.
4. USD/JPY near 147.50
The dollar reached new two-week highs against the yen, hitting 147.50.
Causes: Risk flight and reduced expectations for BoJ intervention.
Outlook: If global sentiment remains adverse, USD/JPY could head towards 148.00.
5. Gold and safe-haven assets recover
Trade uncertainty is supporting gold, which has risen to near $3,360/ounce.
Outlook: Volatility and preference for the USD and JPY are increasing; gold will act as a sentinel of fear in the markets.
🔍 Summary of Impacts on Forex Markets
EUR/USD Weaker: Push toward 1.1600 due to trade concerns and USD strength
GBP/USD Down: UK data pressured + risk aversion
USD/JPY Rising: USD refuge and possible break above 148
USD/CAD Volatile: Canadian tariffs penalize CAD, but oil prices and BoC reactions to monitor
Gold & XM Gold strengthens, signaling risk, USD support; JPY and USD benefit

Week of 7/13/25: EURUSD AnalysisLast week's candle was a bearish engulfing meaning that most likely price will continue lower this week as a daily trend retracement. Waiting for LTF bearish price action before entering.
Major News:
Tuesday - CPI
Wednesday - PPI
Thursday - Unemployment

Week of 7/13/25: AUDUSD AnalysisLast week pushed bullish and demand is still in control on all time frames, so we are going to follow bullish order flow.
Looking for bottom liquidity to be taken in the local range before getting in on a long.
Major News:
Tuesday - CPI
Wednesday - PPI
Thursday - Unemployment

GBP-AUD Risky Long! Buy!
Hello,Traders!
GBP-AUD keeps falling and
The pair is locally oversold
So as the pair is retesting
The horizontal support
Of 2.0480 we will be expecting
A local bullish correction
On Monday
Buy!
Comment and subscribe to help us grow!
Check out other forecasts below too!
Disclosure: I am part of Trade Nation's Influencer program and receive a monthly fee for using their TradingView charts in my analysis.

EUR-USD Will Keep Growing! Buy!
Hello,Traders!
EUR-USD keep trading in
An uptrend along the rising support
So as the pair is approaching
A the support we will be
Expecting a bullish rebound
And a move up on Monday
Buy!
Comment and subscribe to help us grow!
Check out other forecasts below too!
Disclosure: I am part of Trade Nation's Influencer program and receive a monthly fee for using their TradingView charts in my analysis.

USD/CAD Institutional Buy Zone – Thief Trading Alert!🔥 USD/CAD "LOONIE BANK HEIST" 🔥 – THIEF TRADING STYLE (BULLISH SNIPER PLAN)
💸 ATTENTION: Market Robbers & Profit Pirates!
"Steal Like a Pro – Escape Before the Cops Arrive!"
🎯 MASTER TRADE PLAN (Based on Thief Trading Tactics):
Entry Zone (Pullback Heist):
📌 Pullback-1: Market Maker Trap Zone (1.35400+) – Wait for retest!
📌 Pullback-2: Institutional Buy Zone (1.33500+) – Confirm bullish momentum!
"Patience = Perfect Heist Timing. Don’t rush—ambush the trend!"
🎯 Profit Target: 1.38100 (or escape earlier if momentum fades).
🛑 Stop Loss (Escape Route): Nearest 4H Swing Low (wick/close) – Adjust based on risk & lot size!
🚨 SCALPERS’ WARNING:
"Only snipe LONG! Big pockets? Strike now. Small stack? Join swing robbers & trail your SL!"
📉 WHY THIS HEIST? (Bullish Triggers):
Technical + Fundamental alignment (COT, Macro, Sentiment).
Overbought but institutional demand holding strong.
"Bears are trapped—time to rob their stops!"
⚠️ CRITICAL ALERT:
News = Volatility = Police Ambush!
Avoid new trades during high-impact news.
Trailing SL = Your Getaway Car! Lock profits before reversals.
💥 BOOST THIS HEIST!
"Hit 👍, 🔔 Follow, and 🚀 Boost to fuel our next robbery! Let’s drain the banks together!"
🔮 NEXT HEIST COMING SOON… Stay tuned, partner! 🎭💰

EUR_AUD WILL GO UP|LONG|
✅EUR_AUD is trading in an uptrend
And the bullish bias is confirmed
By the rebound we are seeing
After the pair retested the support
So I think the growth will continue
LONG🚀
✅Like and subscribe to never miss a new idea!✅
Disclosure: I am part of Trade Nation's Influencer program and receive a monthly fee for using their TradingView charts in my analysis.

GOLD UPDATE Hello friends🙌
📉Regarding the decline we had, which we also analyzed for you and said that the price is falling...
✔Now, with the support hunt identified, you can see that the price has returned strongly and broken the identified resistance and managed to reach higher ceilings, which also created a QM pattern, which increases the likelihood of the upward trend continuing.
Now with capital and risk management you can move towards your specified goals.
🔥Follow us for more signals🔥
*Trade safely with us*

GBP/NZD: The Great Liquidity Grab? (Long Trade Plan)"🏦💰 GBP/NZD BANK VAULT RAID: Bullish Heist in Progress! (Long Setup) 💰🏦
🚨 Overbought Trap? Or Trend Continuation? Here’s How to Loot Pips Safely! 🚨
🦸♂️ GREETINGS, MARKET MARAUDERS!
To all the Profit Pirates & Risk-Takers! 🌍💸
Using our 🔥Thief Trading Tactics🔥 (a ruthless combo of price action + liquidity grabs + macro triggers), we’re executing a bullish heist on GBP/NZD ("Sterling vs Kiwi")—this is not advice, just a strategic raid blueprint for those who trade like outlaws.
📈 THE HEIST PLAN (LONG ENTRY FOCUS)
🎯 Profit Zone: 2.28700 (or escape earlier if momentum stalls)
💥 High-Stakes Play: Overbought but squeezing higher—trap for bears.
🕵️♂️ Trap Spot: Where sellers get liquidated.
🔑 ENTRY RULES:
"The Vault’s Open!" – Swipe bullish loot on pullbacks (15-30min TF).
Buy Limit Orders near swing lows for better risk/reward.
Aggressive? Enter at market—but tighter stops.
📌 SET ALERTS! Don’t miss the breakout retest.
🛑 STOP LOSS (Escape Route):
Thief SL at recent swing low (2H timeframe).
⚠️ Warning: "Ignore this SL? Enjoy donating to the market."
🎯 TARGETS:
Main Take-Profit: 2.28700 (or trail partials).
Scalpers: Ride long waves only. Trailing SL = VIP exit pass.
📡 FUNDAMENTAL BACKUP (Why This Heist Works)
Before raiding, check:
✅ COT Data (Are funds long GBP/short NZD?)
✅ Rate Spreads (GBP vs NZD yield shifts)
✅ Commodity Correlations (Dairy prices? Risk mood?)
✅ Sentiment Extreme (Retail over-shorting?)
🚨 NEWS RISK ALERT
Avoid new trades during RBNZ/BOE speeches (unless you like volatility casinos).
Trailing stops = your bulletproof vest.
💣 BOOST THIS HEIST!
👍 Smash Like to fuel our next raid!
🔁 Share to recruit more trading bandits!
🤑 See you at the target, rebels!
⚖️ DISCLAIMER: Hypothetical scenario. Trade at your own risk.
#Forex #GBPNZD #TradingView #LiquidityGrab #TrendContinuation #ThiefTrading
💬 COMMENT: "Long already—or waiting for a deeper pullback?" 👇🔥
