EUR-JPY Local Long! Buy!
Hello,Traders!
EUR-JPY is trading in an
Uptrend and the pair made
A breakout, a retest and
A bullish rebound from the
Horizontal support of 173.200
So we are bullish biased and
We will be expecting a
Further bullish move up
On Monday!
Buy!
Comment and subscribe to help us grow!
Check out other forecasts below too!
Disclosure: I am part of Trade Nation's Influencer program and receive a monthly fee for using their TradingView charts in my analysis.
Forex

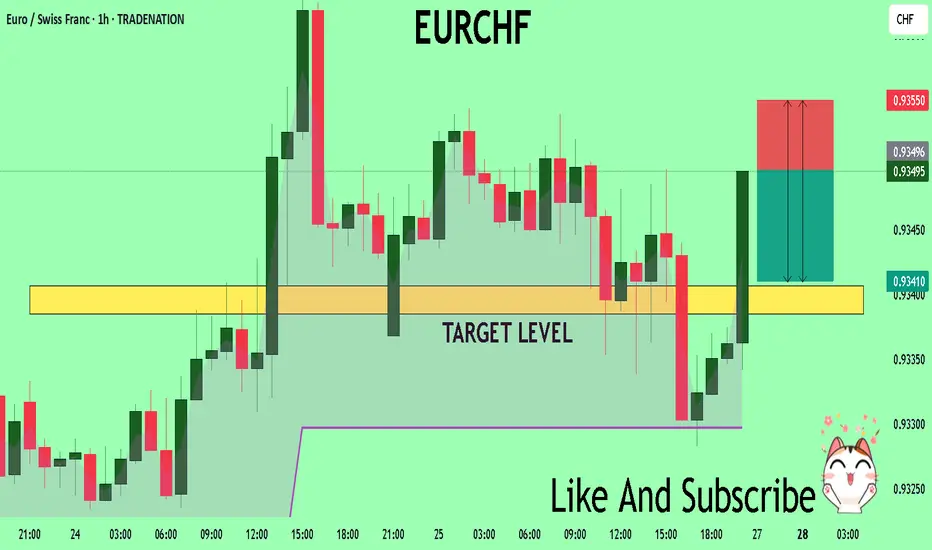
EURCHF Set To Fall! SELL!
My dear friends,
My technical analysis for EURCHF is below:
The market is trading on 0.9349 pivot level.
Bias - Bearish
Technical Indicators: Both Super Trend & Pivot HL indicate a highly probable Bearish continuation.
Target - 0.9340
Recommended Stop Loss - 0.9355
About Used Indicators:
A pivot point is a technical analysis indicator, or calculations, used to determine the overall trend of the market over different time frames.
Disclosure: I am part of Trade Nation's Influencer program and receive a monthly fee for using their TradingView charts in my analysis.
———————————
WISH YOU ALL LUCK
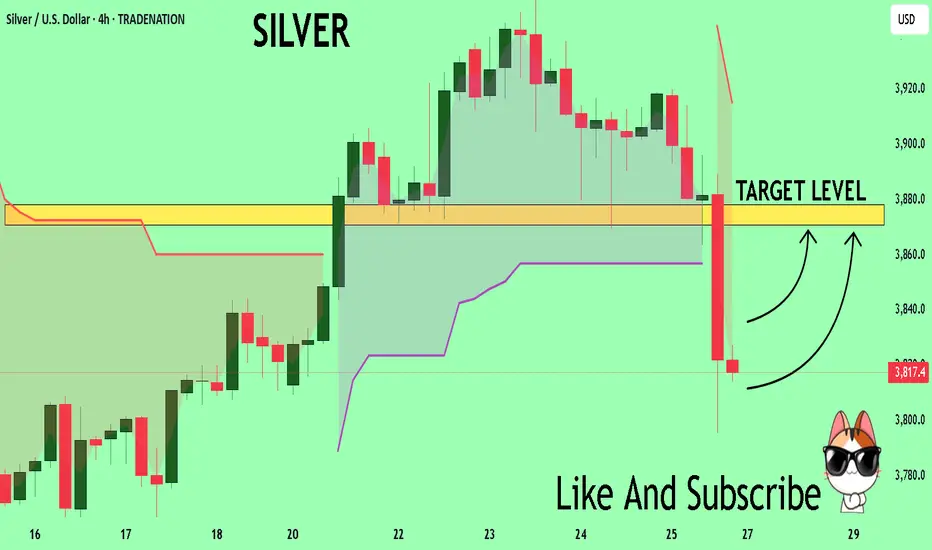
SILVER Trading Opportunity! BUY!
My dear friends,
Please, find my technical outlook for SILVER below:
The price is coiling around a solid key level - 38.174
Bias - Bearish
Technical Indicators: Pivot Points High anticipates a potential price reversal.
Super trend shows a clear sell, giving a perfect indicators' convergence.
Goal - 38.708
About Used Indicators:
The pivot point itself is simply the average of the high, low and closing prices from the previous trading day.
Disclosure: I am part of Trade Nation's Influencer program and receive a monthly fee for using their TradingView charts in my analysis.
———————————
WISH YOU ALL LUCK
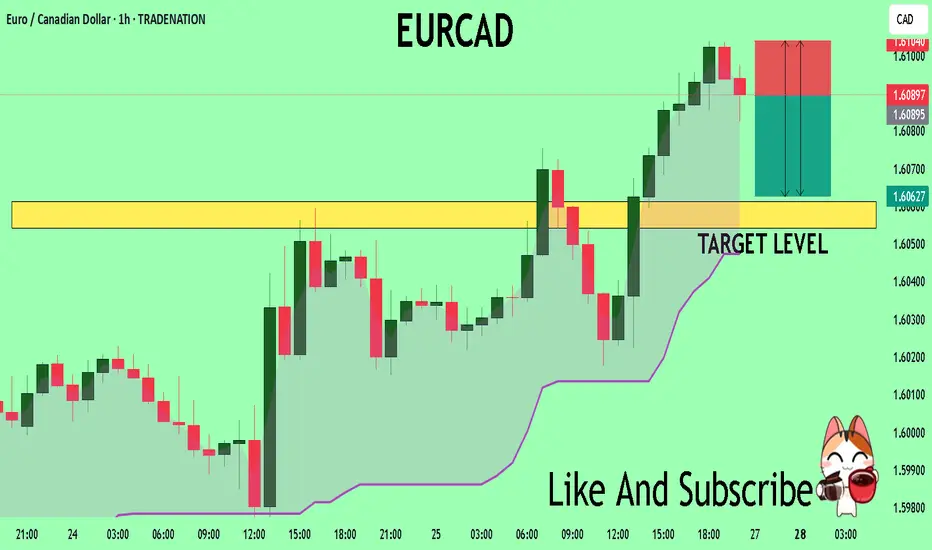
EURCAD The Target Is DOWN! SELL!
My dear subscribers,
EURCAD looks like it will make a good move, and here are the details:
The market is trading on 1.6089 pivot level.
Bias - Bearish
My Stop Loss - 1.6104
Technical Indicators: Both Super Trend & Pivot HL indicate a highly probable Bearish continuation.
Target - 1.6061
About Used Indicators:
The average true range (ATR) plays an important role in 'Supertrend' as the indicator uses ATR to calculate its value. The ATR indicator signals the degree of price volatility.
Disclosure: I am part of Trade Nation's Influencer program and receive a monthly fee for using their TradingView charts in my analysis.
———————————
WISH YOU ALL LUCK
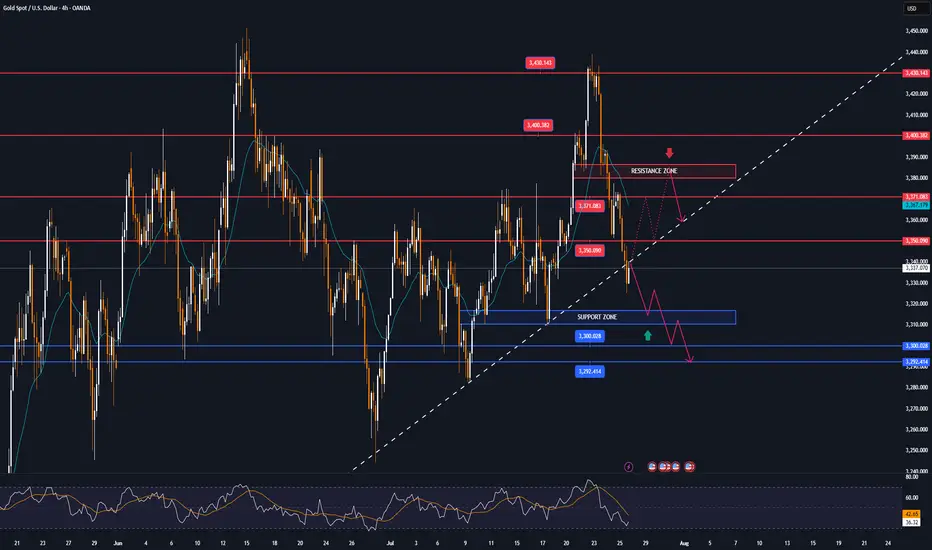
GOLD MARKET ANALYSIS AND COMMENTARY - [Jul 28 - Aug 01]This week, OANDA:XAUUSD prices had a positive start, rising sharply from 3,345 USD/oz to 3,439 USD/oz because investors were concerned about the risk of financial market instability when US President Donald Trump continuously pressured the FED Chairman to reduce interest rates, and there were even rumors of the Fed chairman resigning.
However, the upward momentum in gold prices was not maintained when the US continuously reached trade agreements with partners such as Japan, Indonesia, Philippines..., cooling down the trade war. This caused gold prices to drop sharply for three consecutive trading sessions, at one point the gold price dropped to 3,325 USD/oz and closed at 3,336 USD/oz.
Trade war worries are starting to subside. Therefore, we continue to witness a shift of investment capital flows from gold to risky assets such as stocks..
Notably, this week is the fourth time gold prices broke the $3,400 threshold but did not stay above this level.
Next week, in addition to the FED meeting, the market will also receive information about US non-agricultural employment (NFP) data. If this index falls stronger than expected, it will further strengthen expectations that the FED will continue to keep interest rates at the current level in upcoming meetings, causing gold prices to drop even more sharply next week.
📌In terms of technical analysis, the three crows pattern (3 long red candles) appeared on the D1 chart, showing that sellers were still in control throughout the past 3 trading sessions without much buying power. This technical pattern often suggests that gold prices may be shifting from their recent upward trajectory into a more prolonged period of decline. This technical signal also quite coincides with the context of many fundamental factors, such as geopolitical conflicts, trade wars, low physical gold demand in the summer... no longer strongly supporting gold prices as before. However, according to many experts, if the gold price drops sharply, it will be a good opportunity to buy, because the gold price is forecast to still increase strongly in the long term.
On the H4 chart, gold price may continue to adjust down below the 3,285 USD/oz mark, before recovering again. Meanwhile, the 3,450 USD/oz area is still a strong resistance level for gold prices next week.
Notable technical levels are listed below.
Support: 3,310 – 3,300 – 3,292USD
Resistance: 3,350 – 3,371 – 3,400 – 3,430USD
SELL XAUUSD PRICE 3383 - 3381⚡️
↠↠ Stop Loss 3387
BUY XAUUSD PRICE 3316 - 3318⚡️
↠↠ Stop Loss 3312
HelenP. I Euro can reach resistance zone and then dropHi folks today I'm prepared for you Euro analytics. If we look at the chart, we can observe a mature uptrend that has been supported by a major ascending trend line for an extended period. However, the momentum of this trend appears to be waning, as evidenced by the price's recent failure to establish new highs. The asset is currently trading below the critical resistance zone of 1.1770 - 1.1800, an area that has proven to be a significant barrier for buyers. My analysis for a short position is based on the condition of a final retest of this resistance zone. I believe the price will make another attempt to rally into this area, and a forceful rejection from this zone would serve as the confirmation that sellers are taking definitive control of the market. Such a rejection would likely initiate a strong downward impulse with sufficient momentum to break the long-standing ascending trend line, a pivotal event that would shift the market structure. Therefore, the primary goal for this bearish scenario is set at the 1.1600 level, a logical target for the price to reach after such a significant structural break. If you like my analytics you may support me with your like/comment ❤️
Disclaimer: As part of ThinkMarkets’ Influencer Program, I am sponsored to share and publish their charts in my analysis.

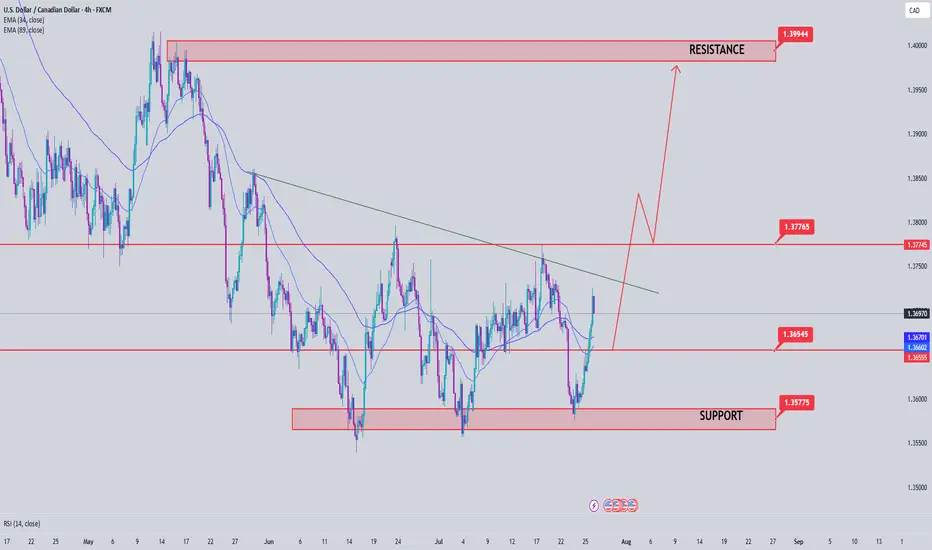
USDCAD Analysis week 31🌐Fundamental Analysis
The Canadian dollar continued to decline against the US dollar on Friday. Trump returned to threatening tariffs on Canada as trade deals remain limited. The August 1 deadline for tariffs is approaching and Canada has not made much of a move so far.
🕯Technical Analysis
USDCAD continues to rally towards the 1.4000 resistance zone. A recovery of the pair to 1.365 is a good momentum for USDCAD to break the trendline and break 1.37700. The trading strategy for next week is mainly to look for BUY points when there is a recovery of the wave structure. If the important support of the week 1.357 is broken, the uptrend will reverse.
📈📉Trading Signals
BUY USDCAD 1.365-1.363 Stoploss 1.360
BUY Break out 1.37700
EUR/USD Robbery Blueprint Bear Strike Activated!💣🎯Operation Fiber Down: EUR/USD Robbery Blueprint (Day Trade Edition) 💰🔫
🚨 Thieves, Hustlers & Chart Bandits Assemble! 🚨
🌍 Hi! Hola! Ola! Bonjour! Hallo! Marhaba! 🌍
Welcome back to another Thief Trading Operation, where the money never sleeps—and neither do we. Let’s break into the vault of EUR/USD “The Fiber” with surgical precision. 🧠💼🕶️
🧨 THE MASTER ROBBERY PLAN: EUR/USD SHORT STRIKE 🔍💸
💀 Market Bias: Bearish – Trend Reversal + Supply Trap Setup
🎯 Target: 1.15800
🛑 Stop-Loss: Near Swing High (around 1.17400 – 3H chart view)
🕓 Timeframe Focus: 15m / 30m / 3H
🧭 ENTRY ZONE:
👣 Plan your entry from recent high retests—that’s where the big money bulls get trapped.
🎯 Use Sell Limit Orders (DCA style / Layered Limit Orders) like a true thief setting up tripwires.
💼 RISK STRATEGY:
💡 SL should match your lot size and order count—not one-size-fits-all!
📌 Place above key structure or swing level (e.g. 1.17400) based on timeframe.
🔍 BEHIND THE SCENES – THE WHY:
The EUR/USD "Fiber" pair is showing all the classic signs of a trend shift and bear raid setup, including:
📰 Fundamentals weakening the Euro
💣 COT Report reveals institutional exits
🍂 Seasonal Bias points to downward trend
📉 Intermarket Pressure from bond yields & USD strength
📊 Sentiment turning overly bullish = trap zone
⛽ Storage & Inventory imbalances adding fuel
📌 Reminder: Before any robbery, study the layout—Macro, Fundamentals, Sentiment, and Intermarket are your blueprint.
🚨 HEIST ALERT – PROTECT THE LOOT:
🕰️ High-Impact News Events? Tighten up!
💼 Don’t take fresh entries during releases.
🔐 Use Trailing SLs to lock in profits.
🎯 Exit with grace before the sirens start.
⚡🔥JOIN THE CREW, BOOST THE LOOT🔥⚡
💥 Smash the Boost Button 💥 if you're vibing with the Thief Trading Movement.
We ain’t just trading—we’re executing strategic robberies on the market’s weaknesses.
🧠💪 Every like = more power to the crew. Every comment = a new map to a vault.
We rob, retreat, and repeat. Let’s make money with skill, not luck. 🕶️💰🚁
⚠️ LEGAL COVER (For the Lawyers 😏):
This plan is not investment advice, just an organized heist blueprint by chart robbers.
Always manage your own risk and update your plan as the market evolves.
🕶️ Stay ready for the next master plan... Until then, keep your charts clean and your stops tight. 🕶️💣📉
– Thief Trader Out 🐱👤🚀

USDJPY Will Fall! Short!
Take a look at our analysis for USDJPY.
Time Frame: 1D
Current Trend: Bearish
Sentiment: Overbought (based on 7-period RSI)
Forecast: Bearish
The price is testing a key resistance 147.661.
Taking into consideration the current market trend & overbought RSI, chances will be high to see a bearish movement to the downside at least to 145.139 level.
P.S
The term oversold refers to a condition where an asset has traded lower in price and has the potential for a price bounce.
Overbought refers to market scenarios where the instrument is traded considerably higher than its fair value. Overvaluation is caused by market sentiments when there is positive news.
Disclosure: I am part of Trade Nation's Influencer program and receive a monthly fee for using their TradingView charts in my analysis.
Like and subscribe and comment my ideas if you enjoy them!

AUDUSD Will Go Higher From Support! Buy!
Please, check our technical outlook for AUDUSD.
Time Frame: 12h
Current Trend: Bullish
Sentiment: Oversold (based on 7-period RSI)
Forecast: Bullish
The market is trading around a solid horizontal structure 0.656.
The above observations make me that the market will inevitably achieve 0.662 level.
P.S
We determine oversold/overbought condition with RSI indicator.
When it drops below 30 - the market is considered to be oversold.
When it bounces above 70 - the market is considered to be overbought.
Disclosure: I am part of Trade Nation's Influencer program and receive a monthly fee for using their TradingView charts in my analysis.
Like and subscribe and comment my ideas if you enjoy them!

NG1! BEST PLACE TO BUY FROM|LONG
NG1! SIGNAL
Trade Direction: long
Entry Level: 3.111
Target Level: 3.357
Stop Loss: 2.946
RISK PROFILE
Risk level: medium
Suggested risk: 1%
Timeframe: 1D
Disclosure: I am part of Trade Nation's Influencer program and receive a monthly fee for using their TradingView charts in my analysis.
✅LIKE AND COMMENT MY IDEAS✅

NZD/JPY BEARS ARE STRONG HERE|SHORT
Hello, Friends!
Previous week’s green candle means that for us the NZD/JPY pair is in the uptrend. And the current movement leg was also up but the resistance line will be hit soon and upper BB band proximity will signal an overbought condition so we will go for a counter-trend short trade with the target being at 88.302.
Disclosure: I am part of Trade Nation's Influencer program and receive a monthly fee for using their TradingView charts in my analysis.
✅LIKE AND COMMENT MY IDEAS✅

USD/CAD Institutional Buy Zone – Thief Trading Alert!🔥 USD/CAD "LOONIE BANK HEIST" 🔥 – THIEF TRADING STYLE (BULLISH SNIPER PLAN)
💸 ATTENTION: Market Robbers & Profit Pirates!
"Steal Like a Pro – Escape Before the Cops Arrive!"
🎯 MASTER TRADE PLAN (Based on Thief Trading Tactics):
Entry Zone (Pullback Heist):
📌 Pullback-1: Market Maker Trap Zone (1.35400+) – Wait for retest!
📌 Pullback-2: Institutional Buy Zone (1.33500+) – Confirm bullish momentum!
"Patience = Perfect Heist Timing. Don’t rush—ambush the trend!"
🎯 Profit Target: 1.38100 (or escape earlier if momentum fades).
🛑 Stop Loss (Escape Route): Nearest 4H Swing Low (wick/close) – Adjust based on risk & lot size!
🚨 SCALPERS’ WARNING:
"Only snipe LONG! Big pockets? Strike now. Small stack? Join swing robbers & trail your SL!"
📉 WHY THIS HEIST? (Bullish Triggers):
Technical + Fundamental alignment (COT, Macro, Sentiment).
Overbought but institutional demand holding strong.
"Bears are trapped—time to rob their stops!"
⚠️ CRITICAL ALERT:
News = Volatility = Police Ambush!
Avoid new trades during high-impact news.
Trailing SL = Your Getaway Car! Lock profits before reversals.
💥 BOOST THIS HEIST!
"Hit 👍, 🔔 Follow, and 🚀 Boost to fuel our next robbery! Let’s drain the banks together!"
🔮 NEXT HEIST COMING SOON… Stay tuned, partner! 🎭💰

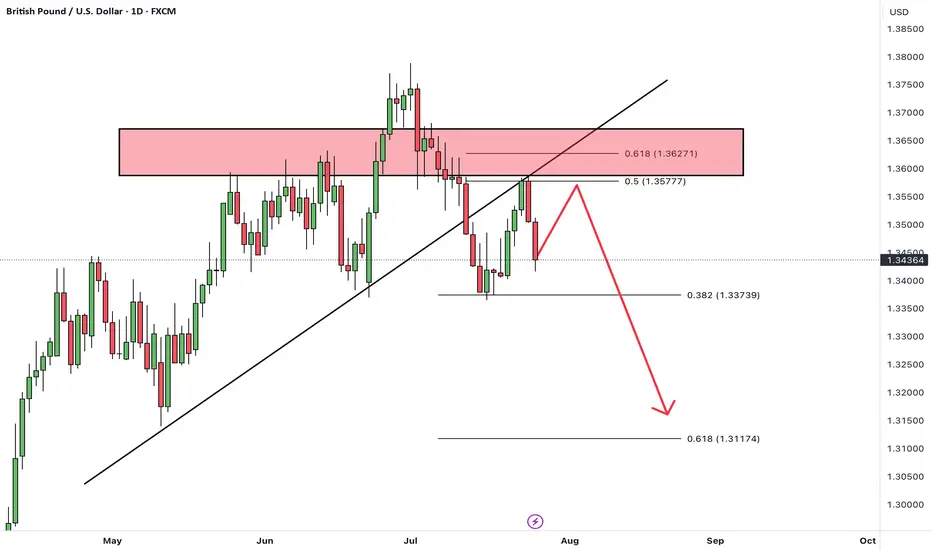
GBPUSDHello Traders! 👋
What are your thoughts on GBPUSD?
GBP/USD has broken below a trendline and has completed a retest (pullback) to the broken level.
The pair is now positioned for a potential downward move.
After some short-term consolidation, we expect price to drop at least toward the next identified support level.
As long as GBP/USD stays below the broken trendline, the bearish bias remains valid, and further downside is likely.
Don’t forget to like and share your thoughts in the comments! ❤️
AUD/USD Sell SetupOANDA:AUDUSD
Timeframe: m30
Entry: 0.66151
SL: 0.66266
TP1: 0.66033
TP2: 0.65914
TP4: 0.65681
📊 Setup Rationale
🔺 Channel Top Rejection (8H Overlay) Price has touched the upper boundary of a descending channel visible on the 8-hour chart. This zone has historically acted as a strong resistance, increasing the probability of a reversal.
🧱 Local Structure (30min) Entry aligns with a minor double top (in lower TFs) and bearish momentum. The tight SL allows for a high R:R profile.
🔄 Momentum Shift Watch for bearish engulfing or rejection wick on lower timeframes to confirm entry.
#MJTrading #Forex #AUDUSD #Sell
Psychology always matters:

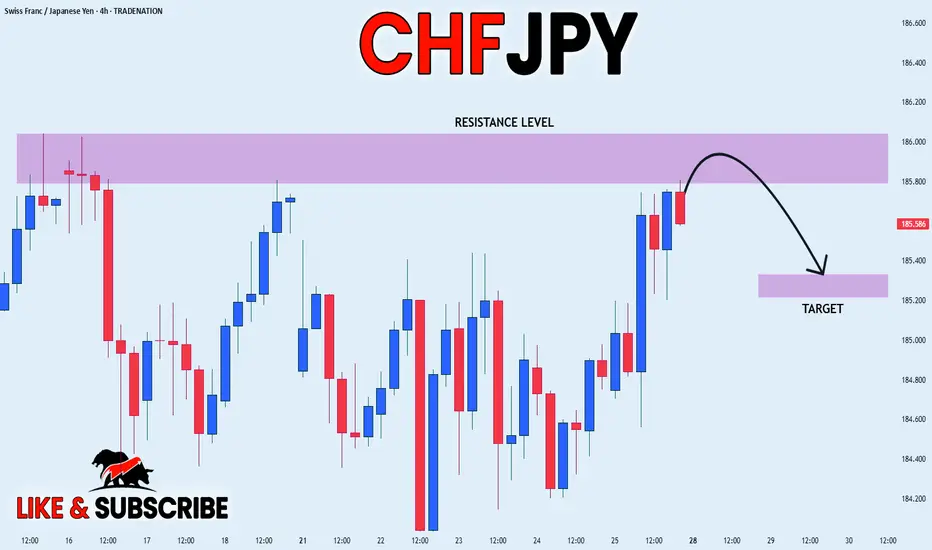
CHF_JPY RISKY SHORT|
✅CHF_JPY is going up now
But a strong resistance level is ahead at 186.036
Thus I am expecting a pullback
And a move down towards the target of 185.329
SHORT🔥
✅Like and subscribe to never miss a new idea!✅
Disclosure: I am part of Trade Nation's Influencer program and receive a monthly fee for using their TradingView charts in my analysis.
CAD-CHF Local Rebound Ahead! Buy!
Hello,Traders!
CAD-CHF made a retest
Of the horizontal support
At 0.5797 from where we
Are already seeing a bullish
Reaction so we will be
Expecting a further local
Bullish move up
Buy!
Comment and subscribe to help us grow!
Check out other forecasts below too!
Disclosure: I am part of Trade Nation's Influencer program and receive a monthly fee for using their TradingView charts in my analysis.

CAD_JPY WILL GO UP|LONG|
✅CAD_JPY will soon retest a key support level of 107.500
So I think that the pair will make a rebound
And go up to retest the supply level above at 108.100
LONG🚀
✅Like and subscribe to never miss a new idea!✅
Disclosure: I am part of Trade Nation's Influencer program and receive a monthly fee for using their TradingView charts in my analysis.

GBP-NZD Will Keep Falling! Sell!
Hello,Traders!
GBP-NZD keeps falling down
And the pair made a strong
Bearish breakout of the key
Horizontal key level of 2.2400
And the breakout is confirmed
So we are bearish biased and
We will be expecting a further
Bearish move down on Monday
Sell!
Comment and subscribe to help us grow!
Check out other forecasts below too!
Disclosure: I am part of Trade Nation's Influencer program and receive a monthly fee for using their TradingView charts in my analysis.

EUR_JPY WILL GROW|LONG|
✅EUR_JPY will keep growing
Because the pair is in the uptrend
And recently broke the key level of 173.200
So we will be expecting
Bullish continuation
LONG🚀
✅Like and subscribe to never miss a new idea!✅
Disclosure: I am part of Trade Nation's Influencer program and receive a monthly fee for using their TradingView charts in my analysis.

EUR-GBP Swing Short! Sell!
Hello,Traders!
EUR-GBP keeps growing in
A strong uptrend but the pair
Is locally overbought so after
The price hits a horizontal
Resistance level of 0.8764
We will be expecting a
Local bearish correction
Sell!
Comment and subscribe to help us grow!
Check out other forecasts below too!
Disclosure: I am part of Trade Nation's Influencer program and receive a monthly fee for using their TradingView charts in my analysis.

USDJPY Breakout and Potential RetraceHey Traders, in today's trading session we are monitoring USDJPY for a buying opportunity around 146.300 zone, USDJPY was trading in a downtrend and successfully managed to break it out. Currently is in a correction phase in which it is approaching the retrace area at 146.300 support and resistance area.
Trade safe, Joe.

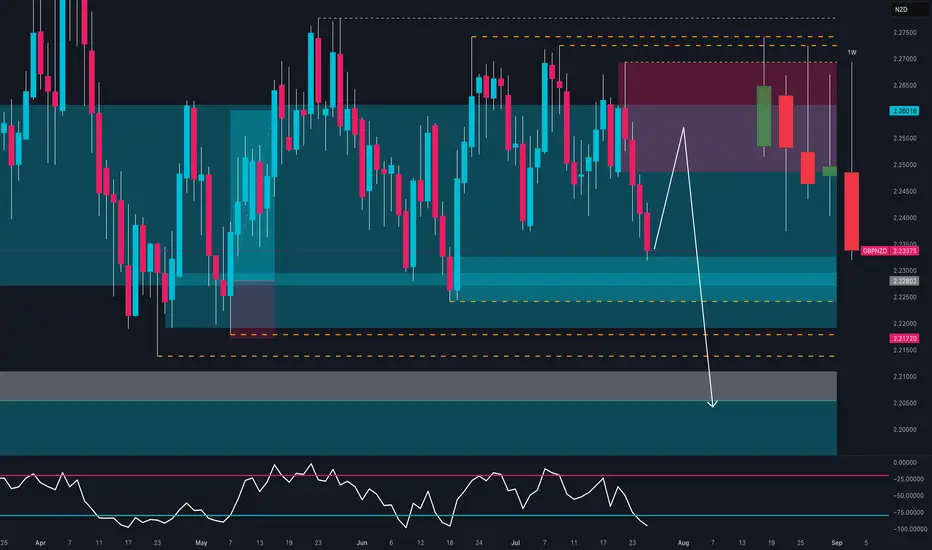
GBPNZD Breakdown – Smart Money Turns Fully Bearish🧠 Macro + COT + Sentiment Context
Commitment of Traders (COT) – Asset Managers
Institutional asset managers are significantly net short on GBPNZD, with positioning at its lowest level of the year and declining sharply since May. This reflects a clear bearish stance from smart money and reinforces the current downward pressure.
Sentiment & Momentum Indicators
DPO: -54.9 → Indicates a moderately bearish momentum phase.
Wyckoff: -20.3 → Price is in a distribution phase, suggesting weakness.
Speed: 3.2 → Low acceleration, but directional bias remains bearish.
Market Mood: Neutral, but leaning into oversold territory.
Seasonality (July 1st – Sept 30th)
Historically, GBPNZD performs positively in this period:
3Y: +1.7%, 5Y: +1.6%, 10Y: +2.3%, 15Y: +2.8%
However, in 2025, price is diverging sharply from seasonal norms. The pair is trading against historical patterns, suggesting a seasonal anomaly where institutional flow is dominating historical behavior.
🧱 Technical Outlook (Daily Chart)
GBPNZD had been consolidating in a clear range between 2.2170 support and 2.2750 resistance since May. The pair has now broken down with a strong, full-bodied weekly candle, closing below the 2.2320 demand zone.
Key Technical Zones:
Supply zone (2.2494–2.2659) → A clear rejection zone that initiated the current selloff.
Demand zone (2.2170–2.2300) → Has been tested twice already, increasing the probability of a clean breakdown.
RSI (Daily) → Currently neutral, with a sequence of lower highs and no bullish divergence in sight — indicating weak momentum.
✅ Conclusion & Trade Plan
Directional Bias: Bearish (Short)
Although seasonality typically supports bullish price action for GBPNZD in Q3, the current context is decisively bearish. Institutional positioning, price structure, and sentiment all confirm a potential shift in direction, reinforced by a confirmed weekly breakdown.
Bearish Targets:
📍 First: 2.2170 (recent support test)
📍 Second: 2.2000–2.1900 (April swing low)
📍 Extension: 2.1750 (base of previous accumulation zone)
Invalidation Criteria:
A weekly close above 2.2490 (supply zone breached)
Bullish RSI divergence + weekly recovery candle