GOLD Will Go Up! Buy!
Please, check our technical outlook for GOLD.
Time Frame: 2h
Current Trend: Bullish
Sentiment: Oversold (based on 7-period RSI)
Forecast: Bullish
The market is trading around a solid horizontal structure 3,427.91.
The above observations make me that the market will inevitably achieve 3,460.54 level.
P.S
We determine oversold/overbought condition with RSI indicator.
When it drops below 30 - the market is considered to be oversold.
When it bounces above 70 - the market is considered to be overbought.
Disclosure: I am part of Trade Nation's Influencer program and receive a monthly fee for using their TradingView charts in my analysis.
Like and subscribe and comment my ideas if you enjoy them!
Forex

EURUSD Will Move Higher! Long!
Here is our detailed technical review for EURUSD.
Time Frame: 9h
Current Trend: Bullish
Sentiment: Oversold (based on 7-period RSI)
Forecast: Bullish
The market is testing a major horizontal structure 1.174.
Taking into consideration the structure & trend analysis, I believe that the market will reach 1.184 level soon.
P.S
Overbought describes a period of time where there has been a significant and consistent upward move in price over a period of time without much pullback.
Disclosure: I am part of Trade Nation's Influencer program and receive a monthly fee for using their TradingView charts in my analysis.
Like and subscribe and comment my ideas if you enjoy them!

USDCHF Is Bearish! Sell!
Take a look at our analysis for USDCHF.
Time Frame: 6h
Current Trend: Bearish
Sentiment: Overbought (based on 7-period RSI)
Forecast: Bearish
The market is approaching a key horizontal level 0.791.
Considering the today's price action, probabilities will be high to see a movement to 0.787.
P.S
Please, note that an oversold/overbought condition can last for a long time, and therefore being oversold/overbought doesn't mean a price rally will come soon, or at all.
Disclosure: I am part of Trade Nation's Influencer program and receive a monthly fee for using their TradingView charts in my analysis.
Like and subscribe and comment my ideas if you enjoy them!

GBPCAD Is Very Bullish! Buy!
Please, check our technical outlook for GBPCAD.
Time Frame: 4h
Current Trend: Bullish
Sentiment: Oversold (based on 7-period RSI)
Forecast: Bullish
The market is approaching a significant support area 1.841.
The underlined horizontal cluster clearly indicates a highly probable bullish movement with target 1.848 level.
P.S
The term oversold refers to a condition where an asset has traded lower in price and has the potential for a price bounce.
Overbought refers to market scenarios where the instrument is traded considerably higher than its fair value. Overvaluation is caused by market sentiments when there is positive news.
Disclosure: I am part of Trade Nation's Influencer program and receive a monthly fee for using their TradingView charts in my analysis.
Like and subscribe and comment my ideas if you enjoy them!

Could the Kiwi reverse from here?The price is rising towards the pivot, which acts as an overlap resistance that aligns with the 61.8% Fibonacci retracement and could reverse to the 1st support which is an overlap support.
Pivot: 0.6038
1st Support: 0.5979
1st Resistance: 0.6115
Risk Warning:
Trading Forex and CFDs carries a high level of risk to your capital and you should only trade with money you can afford to lose. Trading Forex and CFDs may not be suitable for all investors, so please ensure that you fully understand the risks involved and seek independent advice if necessary.
Disclaimer:
The above opinions given constitute general market commentary, and do not constitute the opinion or advice of IC Markets or any form of personal or investment advice.
Any opinions, news, research, analyses, prices, other information, or links to third-party sites contained on this website are provided on an "as-is" basis, are intended only to be informative, is not an advice nor a recommendation, nor research, or a record of our trading prices, or an offer of, or solicitation for a transaction in any financial instrument and thus should not be treated as such. The information provided does not involve any specific investment objectives, financial situation and needs of any specific person who may receive it. Please be aware, that past performance is not a reliable indicator of future performance and/or results. Past Performance or Forward-looking scenarios based upon the reasonable beliefs of the third-party provider are not a guarantee of future performance. Actual results may differ materially from those anticipated in forward-looking or past performance statements. IC Markets makes no representation or warranty and assumes no liability as to the accuracy or completeness of the information provided, nor any loss arising from any investment based on a recommendation, forecast or any information supplied by any third-party.

Bearish reversal off overlap resistance?The Cable (GBP/USD) is rising towards the pivot, which acts as an overlap resistance and could reverse to the 1st support.
Pivot: 1.3611
1st Support: 1.3469
1st Resistance: 1.3693
Risk Warning:
Trading Forex and CFDs carries a high level of risk to your capital and you should only trade with money you can afford to lose. Trading Forex and CFDs may not be suitable for all investors, so please ensure that you fully understand the risks involved and seek independent advice if necessary.
Disclaimer:
The above opinions given constitute general market commentary, and do not constitute the opinion or advice of IC Markets or any form of personal or investment advice.
Any opinions, news, research, analyses, prices, other information, or links to third-party sites contained on this website are provided on an "as-is" basis, are intended only to be informative, is not an advice nor a recommendation, nor research, or a record of our trading prices, or an offer of, or solicitation for a transaction in any financial instrument and thus should not be treated as such. The information provided does not involve any specific investment objectives, financial situation and needs of any specific person who may receive it. Please be aware, that past performance is not a reliable indicator of future performance and/or results. Past Performance or Forward-looking scenarios based upon the reasonable beliefs of the third-party provider are not a guarantee of future performance. Actual results may differ materially from those anticipated in forward-looking or past performance statements. IC Markets makes no representation or warranty and assumes no liability as to the accuracy or completeness of the information provided, nor any loss arising from any investment based on a recommendation, forecast or any information supplied by any third-party.

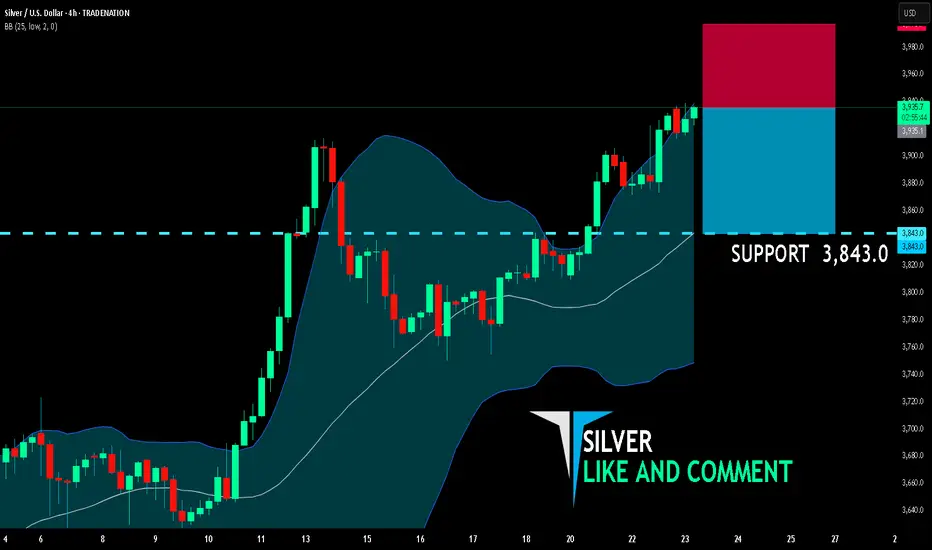
SILVER BEARS ARE GAINING STRENGTH|SHORT
SILVER SIGNAL
Trade Direction: short
Entry Level: 3,935.1
Target Level: 3,843.0
Stop Loss: 3,996.7
RISK PROFILE
Risk level: medium
Suggested risk: 1%
Timeframe: 4h
Disclosure: I am part of Trade Nation's Influencer program and receive a monthly fee for using their TradingView charts in my analysis.
✅LIKE AND COMMENT MY IDEAS✅
EUR/AUD BUYERS WILL DOMINATE THE MARKET|LONG
EUR/AUD SIGNAL
Trade Direction: long
Entry Level: 1.787
Target Level: 1.791
Stop Loss: 1.785
RISK PROFILE
Risk level: medium
Suggested risk: 1%
Timeframe: 1h
Disclosure: I am part of Trade Nation's Influencer program and receive a monthly fee for using their TradingView charts in my analysis.
✅LIKE AND COMMENT MY IDEAS✅

EUR/CAD BULLISH BIAS RIGHT NOW| LONG
Hello, Friends!
Previous week’s red candle means that for us the EUR/CAD pair is in the downtrend. And the current movement leg was also down but the support line will be hit soon and lower BB band proximity will signal an oversold condition so we will go for a counter-trend long trade with the target being at 1.600.
Disclosure: I am part of Trade Nation's Influencer program and receive a monthly fee for using their TradingView charts in my analysis.
✅LIKE AND COMMENT MY IDEAS✅

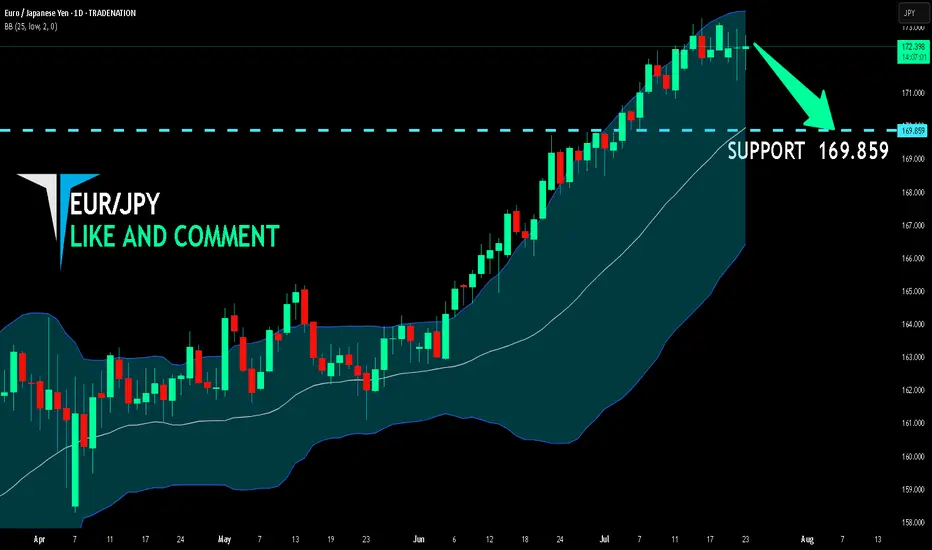
EUR/JPY BEST PLACE TO SELL FROM|SHORT
Hello, Friends!
EUR-JPY uptrend evident from the last 1W green candle makes short trades more risky, but the current set-up targeting 169.859 area still presents a good opportunity for us to sell the pair because the resistance line is nearby and the BB upper band is close which indicates the overbought state of the EUR/JPY pair.
Disclosure: I am part of Trade Nation's Influencer program and receive a monthly fee for using their TradingView charts in my analysis.
✅LIKE AND COMMENT MY IDEAS✅
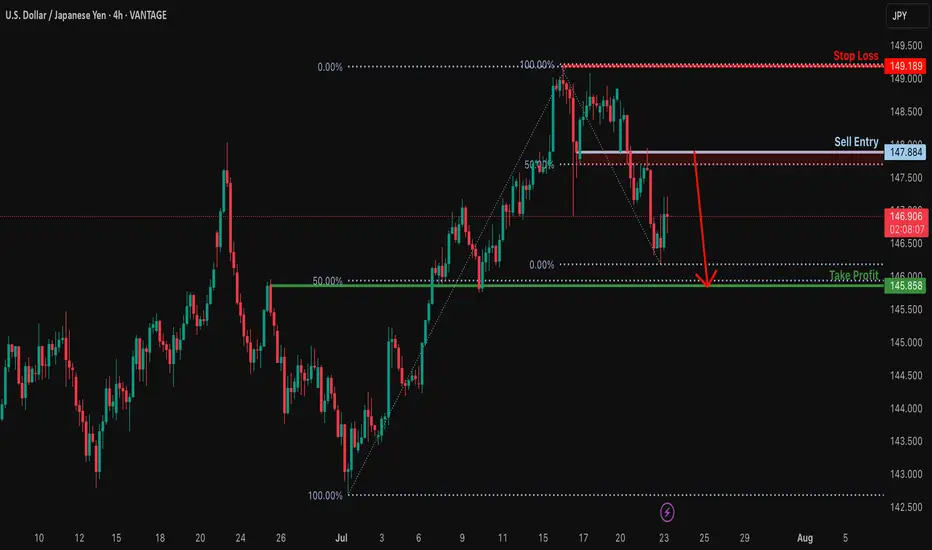
Bearish reversal off overlap resistance?USD/JPY is rising towards the resistance level which is an overlap resitance that is slightly above the 50% Fibonacci retracement and could reverse from this level to our take profit.
Entry: 147.88
Why we like it:
There is an overlap resistance that is slight.y above the 50% Fibonacci retracement.
Stop loss: 149.18
Why we like it:
There is a swing high resistance.
Take profit: 145.85
Why we like it:
There is an overlap support that lines up with the 50% Fibonacci retracement.
Enjoying your TradingView experience? Review us!
Please be advised that the information presented on TradingView is provided to Vantage (‘Vantage Global Limited’, ‘we’) by a third-party provider (‘Everest Fortune Group’). Please be reminded that you are solely responsible for the trading decisions on your account. There is a very high degree of risk involved in trading. Any information and/or content is intended entirely for research, educational and informational purposes only and does not constitute investment or consultation advice or investment strategy. The information is not tailored to the investment needs of any specific person and therefore does not involve a consideration of any of the investment objectives, financial situation or needs of any viewer that may receive it. Kindly also note that past performance is not a reliable indicator of future results. Actual results may differ materially from those anticipated in forward-looking or past performance statements. We assume no liability as to the accuracy or completeness of any of the information and/or content provided herein and the Company cannot be held responsible for any omission, mistake nor for any loss or damage including without limitation to any loss of profit which may arise from reliance on any information supplied by Everest Fortune Group.
Euro Surges as Dollar Falters Amid Political TensionsThe EUR/USD pair is experiencing a strong rally, breaking above the 1.1760 level — its highest point in two weeks as of Tuesday. This sharp move not only signals the Euro’s recovery strength but also highlights the impact of heavy selling pressure on the US dollar.
The driving force? Ongoing trade tensions, coupled with rising uncertainty surrounding the escalating feud between President Trump and Fed Chair Jerome Powell, are shaking investor confidence in the stability of US monetary policy.
As a result, the dollar is losing its safe-haven appeal, paving the way for EUR/USD to climb higher. If this bullish momentum holds, the next key target for the pair could be around 1.1800.

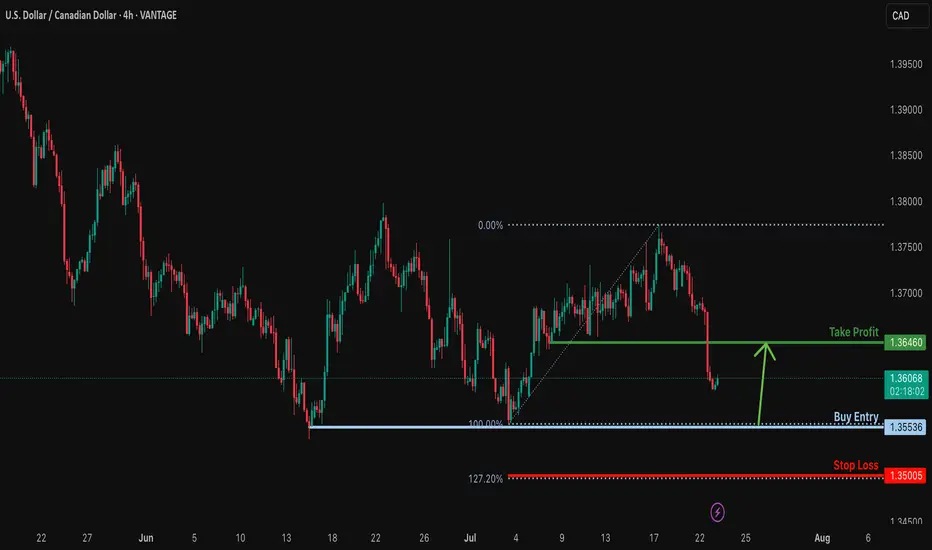
Bullish reversal?USD/CAD is faalling towards the support level which is a multi swing low support and could bounce from this level to our take profit.
Entry: 1.3553
Why we like it:
There is a multi swing low support.
Stop loss: 1.3500
Why we like it:
There is a support at the 127.2% Fibonacc extension.
Take profit: 1.3646
Why we like it:
There is a pullback resistance.
Enjoying your TradingView experience? Review us!
Please be advised that the information presented on TradingView is provided to Vantage (‘Vantage Global Limited’, ‘we’) by a third-party provider (‘Everest Fortune Group’). Please be reminded that you are solely responsible for the trading decisions on your account. There is a very high degree of risk involved in trading. Any information and/or content is intended entirely for research, educational and informational purposes only and does not constitute investment or consultation advice or investment strategy. The information is not tailored to the investment needs of any specific person and therefore does not involve a consideration of any of the investment objectives, financial situation or needs of any viewer that may receive it. Kindly also note that past performance is not a reliable indicator of future results. Actual results may differ materially from those anticipated in forward-looking or past performance statements. We assume no liability as to the accuracy or completeness of any of the information and/or content provided herein and the Company cannot be held responsible for any omission, mistake nor for any loss or damage including without limitation to any loss of profit which may arise from reliance on any information supplied by Everest Fortune Group.
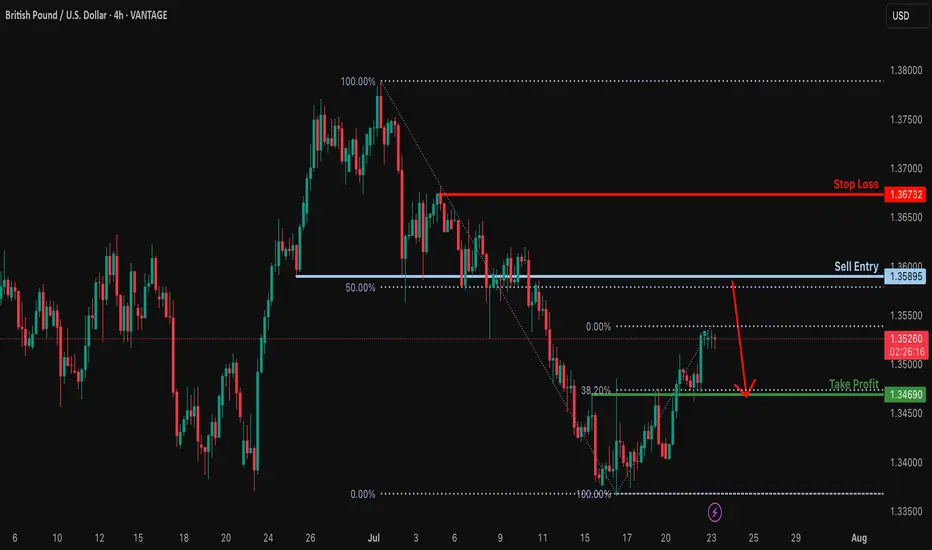
Bearish reversal off 50% Fibonacci resistance?GBP/USD is rising towards the resistance level which his a pullback resistance that lines up with the 50% Fibonacci retracement and could reverse from this level to our take profit.
Entry: 1.3589
Why we like it:
There is a pullback resistance that lines up with the 50% Fibonacci retracement.
Stop loss: 1.3673
Why we like it:
There is a pullback resstance.
Take profit: 1.3469
Why we like it:
There is an overlap support that aligns with the 38.2% Fibonacci retracement.
Enjoying your TradingView experience? Review us!
Please be advised that the information presented on TradingView is provided to Vantage (‘Vantage Global Limited’, ‘we’) by a third-party provider (‘Everest Fortune Group’). Please be reminded that you are solely responsible for the trading decisions on your account. There is a very high degree of risk involved in trading. Any information and/or content is intended entirely for research, educational and informational purposes only and does not constitute investment or consultation advice or investment strategy. The information is not tailored to the investment needs of any specific person and therefore does not involve a consideration of any of the investment objectives, financial situation or needs of any viewer that may receive it. Kindly also note that past performance is not a reliable indicator of future results. Actual results may differ materially from those anticipated in forward-looking or past performance statements. We assume no liability as to the accuracy or completeness of any of the information and/or content provided herein and the Company cannot be held responsible for any omission, mistake nor for any loss or damage including without limitation to any loss of profit which may arise from reliance on any information supplied by Everest Fortune Group.
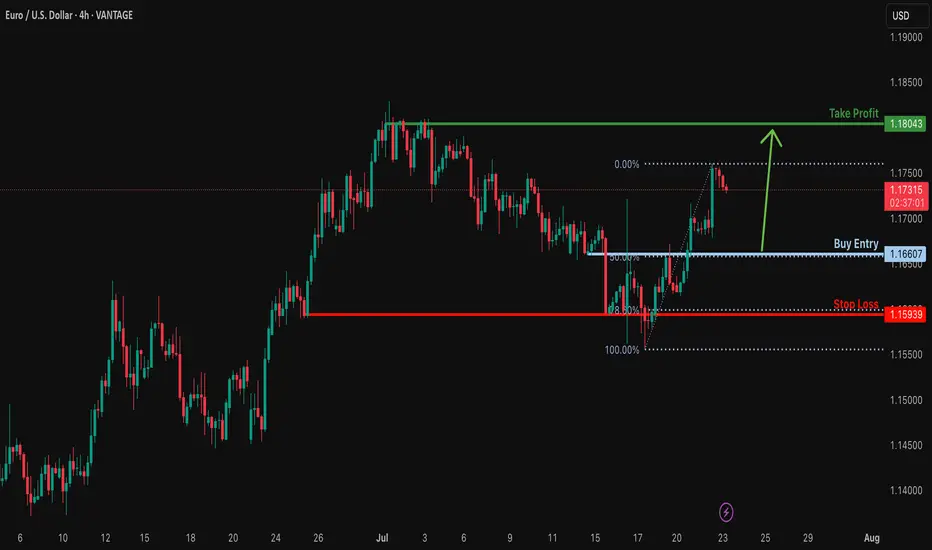
Bullish bounce?EUR/USD is falling towards the support level which is a pullback support that aligns with the 50% Fibonacci retracement and could bounce to from this level to our take profit.
Entry: 1.1660
Why we like it:
There is a pullback support that lines up with the 50% Fibonacci retracement.
Stop loss: 1.1593
Why we like it:
There is a multi swing low support that is slightly below the 78.6% Fibonacci retracement.
Take profit: 1.1813
Why we like it:
There is a swing high resistance.
Enjoying your TradingView experience? Review us!
Please be advised that the information presented on TradingView is provided to Vantage (‘Vantage Global Limited’, ‘we’) by a third-party provider (‘Everest Fortune Group’). Please be reminded that you are solely responsible for the trading decisions on your account. There is a very high degree of risk involved in trading. Any information and/or content is intended entirely for research, educational and informational purposes only and does not constitute investment or consultation advice or investment strategy. The information is not tailored to the investment needs of any specific person and therefore does not involve a consideration of any of the investment objectives, financial situation or needs of any viewer that may receive it. Kindly also note that past performance is not a reliable indicator of future results. Actual results may differ materially from those anticipated in forward-looking or past performance statements. We assume no liability as to the accuracy or completeness of any of the information and/or content provided herein and the Company cannot be held responsible for any omission, mistake nor for any loss or damage including without limitation to any loss of profit which may arise from reliance on any information supplied by Everest Fortune Group.
EUR/USD Elliott Wave Update –Classic Wave 5 Breakout OpportunityThis chart of the EUR/USD pair shows a well-structured Elliott Wave impulse pattern unfolding on the 4-hour timeframe. The price action is currently progressing in the final Wave (5) of the impulse cycle, which typically represents the last bullish leg before a larger correction begins.
Wave (1): The initial move up from the bottom (early May), showing a clean 5-wave internal structure.
Wave (2): A healthy retracement after Wave 1, forming a base for further upside.
Wave (3): The strongest and steepest rally, as expected in Elliott theory. It broke past previous highs and extended sharply.
Wave (4): A corrective phase that formed a falling wedge pattern — typically a bullish continuation pattern.
Wave (5): Currently in progress. The wedge has broken to the upside, confirming the potential start of Wave 5.
Target 1 (T1): 1.18306
Target 2 (T2): 1.19012
Stop Loss (SL): 1.16600
After a strong uptrend, the market went sideways in a wedge pattern (a typical wave 4 behavior). It has now broken out, signaling the start of the final wave 5 move. This is often a strong and sharp push. Since the breakout is clean and the Elliott wave count aligns well, this creates a favorable long opportunity

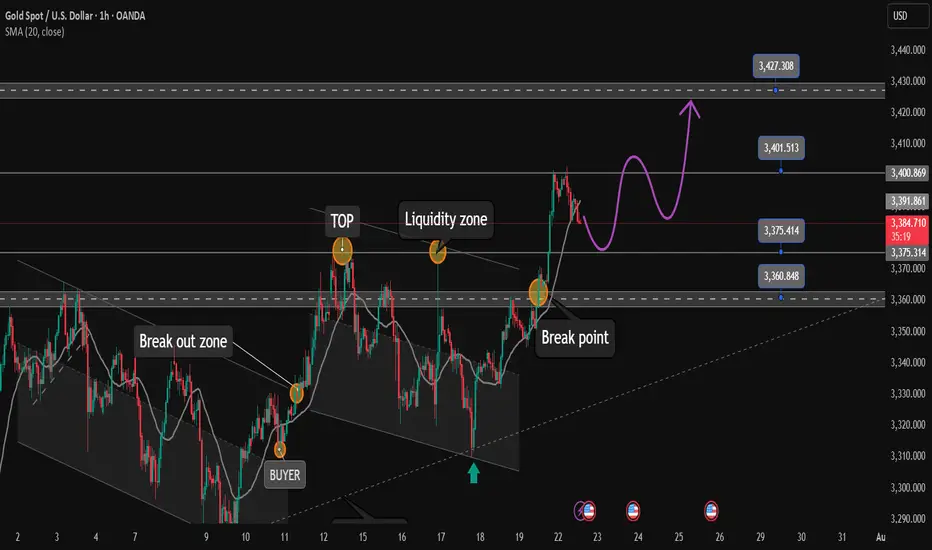
After reaching FULL TP. Relax and wait for strong support zone✏️Continuing yesterday's bullish wave structure, Gold has reached the Target level of 3400. In the European session, there is a possibility of a correction to some important support zones. And the US session will continue to aim for a level higher than 3400. Today's strategy is still quite similar to yesterday's strategy when waiting for the areas where buyers confirm to enter the market to FOMO according to the main trend.
📉 Key Levels
Support: 3375 - 3363
Resistance: 3400-3427
Buy Trigger: Rejects the support zone 3375 and reacts to the upside
Buy Trigger: Rebound from 3363
BUY DCA: Break and trading above 3400
Target 3427
Leave your comments on the idea. I am happy to read your views.
Price channel break. Will the downtrend take place?✏️USDCAD broke the price channel and started forming a bearish wave. The resistance zone of 1.370 played an important role in starting the bearish wave. 1.365 is the immediate support zone that the pair faces. If it wants to extend the decline, it needs to close the h1 candle below this price zone. The convergence between the trendline and the resistance of the Asian session will be a reliable support point for a downtrend to take place.
📉 Key Levels
Support: 1.365-1.356
Resistance: 1.370
SELL Trigger: Rejects bellow 1.370
SELL DCA Trigger: Break support 1.365
Target 1.356
BUY Trigger: Break and trading above resistance 1.370
Leave your comments on the idea. I am happy to read your views.

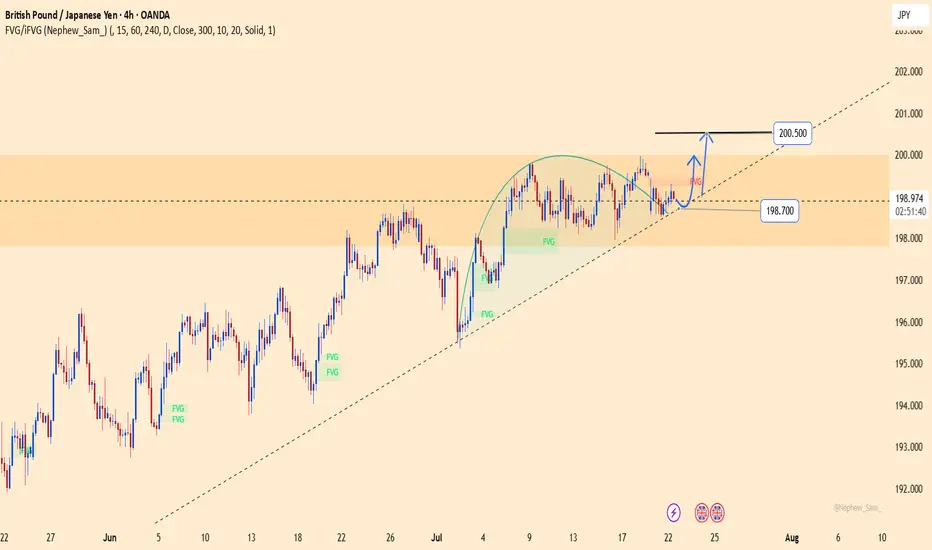
GBPJPY – breakout loading: final leap to 200.500?After days of compression, GBPJPY is flashing clear signs of an explosive breakout.
Price is holding firmly above the ascending trendline and consolidating right at the top of the FVG zone – a strong signal that buyers are preparing to punch through the 200.500 resistance in one decisive move.
Meanwhile, the JPY continues to lose ground as the BoJ shows no clear intention to hike rates, while GBP gains support on expectations that the BoE will maintain its hawkish stance longer due to persistent core inflation.
Trade setup (reference):
Buy limit: 198.900
SL: below 198.500
TP: 200.500
AUD-JPY Will Grow! Buy!
Hello,Traders!
AUD-JPY already made a
Bullish rebound from the
Strong horizontal support
Of 95.610 and as we are
Bullish biased we will be
Expecting a further bullish
Move up
Buy!
Comment and subscribe to help us grow!
Check out other forecasts below too!
Disclosure: I am part of Trade Nation's Influencer program and receive a monthly fee for using their TradingView charts in my analysis.

CADJPY daily 20EMA bounceSimple idea here, CADJPY is testing the daily 20EMA (overlayed on this 4H chart) and recently broke above the monthly 20EMA (overlayed)... if price reclaims the daily 10EMA (overlayer) could be a nice move up.
Very simple trade, tight SL if entering.

Could the Fiber reverse from here?The price is rising towards the pivot which is a pullback resistance and could reverse to the 1st support.
Pivot: 1.1812
1st Support: 1.1608
1st Resistance: 1.1903
Risk Warning:
Trading Forex and CFDs carries a high level of risk to your capital and you should only trade with money you can afford to lose. Trading Forex and CFDs may not be suitable for all investors, so please ensure that you fully understand the risks involved and seek independent advice if necessary.
Disclaimer:
The above opinions given constitute general market commentary, and do not constitute the opinion or advice of IC Markets or any form of personal or investment advice.
Any opinions, news, research, analyses, prices, other information, or links to third-party sites contained on this website are provided on an "as-is" basis, are intended only to be informative, is not an advice nor a recommendation, nor research, or a record of our trading prices, or an offer of, or solicitation for a transaction in any financial instrument and thus should not be treated as such. The information provided does not involve any specific investment objectives, financial situation and needs of any specific person who may receive it. Please be aware, that past performance is not a reliable indicator of future performance and/or results. Past Performance or Forward-looking scenarios based upon the reasonable beliefs of the third-party provider are not a guarantee of future performance. Actual results may differ materially from those anticipated in forward-looking or past performance statements. IC Markets makes no representation or warranty and assumes no liability as to the accuracy or completeness of the information provided, nor any loss arising from any investment based on a recommendation, forecast or any information supplied by any third-party.

Bullish bounce?US Dollar Index (DXY) is falling towards the pivot which aligns with the 78.6% Fibonacci retracement and could bounce to the 1st resistance.
Pivot: 97.00
1st Support: 96.48
1st Resistance: 97.77
Risk Warning:
Trading Forex and CFDs carries a high level of risk to your capital and you should only trade with money you can afford to lose. Trading Forex and CFDs may not be suitable for all investors, so please ensure that you fully understand the risks involved and seek independent advice if necessary.
Disclaimer:
The above opinions given constitute general market commentary, and do not constitute the opinion or advice of IC Markets or any form of personal or investment advice.
Any opinions, news, research, analyses, prices, other information, or links to third-party sites contained on this website are provided on an "as-is" basis, are intended only to be informative, is not an advice nor a recommendation, nor research, or a record of our trading prices, or an offer of, or solicitation for a transaction in any financial instrument and thus should not be treated as such. The information provided does not involve any specific investment objectives, financial situation and needs of any specific person who may receive it. Please be aware, that past performance is not a reliable indicator of future performance and/or results. Past Performance or Forward-looking scenarios based upon the reasonable beliefs of the third-party provider are not a guarantee of future performance. Actual results may differ materially from those anticipated in forward-looking or past performance statements. IC Markets makes no representation or warranty and assumes no liability as to the accuracy or completeness of the information provided, nor any loss arising from any investment based on a recommendation, forecast or any information supplied by any third-party.
