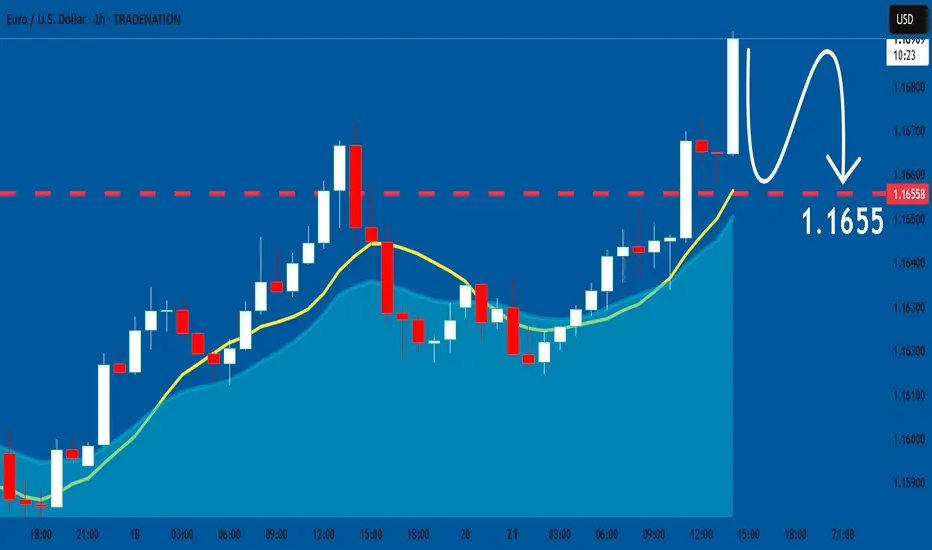
EURUSD: Expecting Bearish Movement! Here is Why:
Balance of buyers and sellers on the EURUSD pair, that is best felt when all the timeframes are analyzed properly is shifting in favor of the sellers, therefore is it only natural that we go short on the pair.
Disclosure: I am part of Trade Nation's Influencer program and receive a monthly fee for using their TradingView charts in my analysis.
❤️ Please, support our work with like & comment! ❤️
Forex
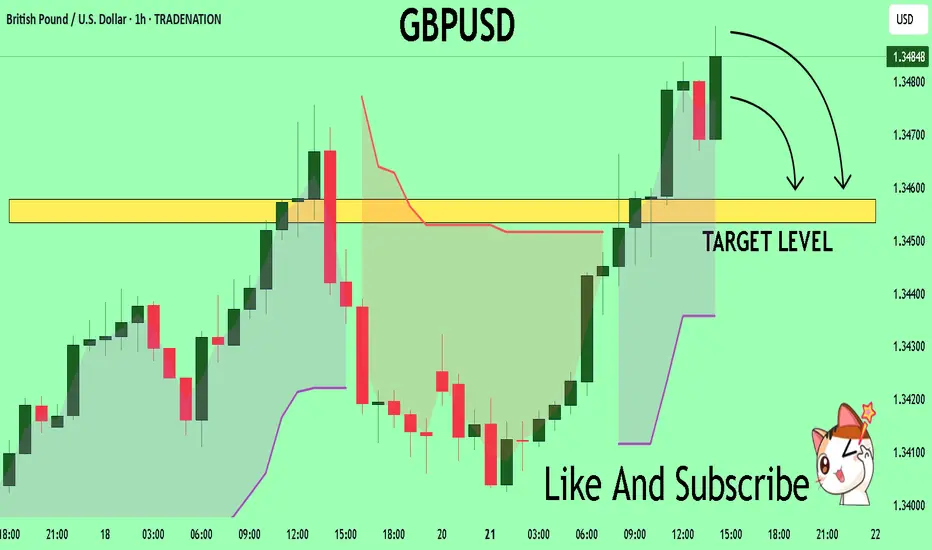
GBPUSD Under Pressure! SELL!
My dear subscribers,
GBPUSD looks like it will make a good move, and here are the details:
The market is trading on 1.3483 pivot level.
Bias - Bearish
Technical Indicators: Both Super Trend & Pivot HL indicate a highly probable Bearish continuation.
Target - 1.3457
About Used Indicators:
The average true range (ATR) plays an important role in 'Supertrend' as the indicator uses ATR to calculate its value. The ATR indicator signals the degree of price volatility.
Disclosure: I am part of Trade Nation's Influencer program and receive a monthly fee for using their TradingView charts in my analysis.
———————————
WISH YOU ALL LUCK
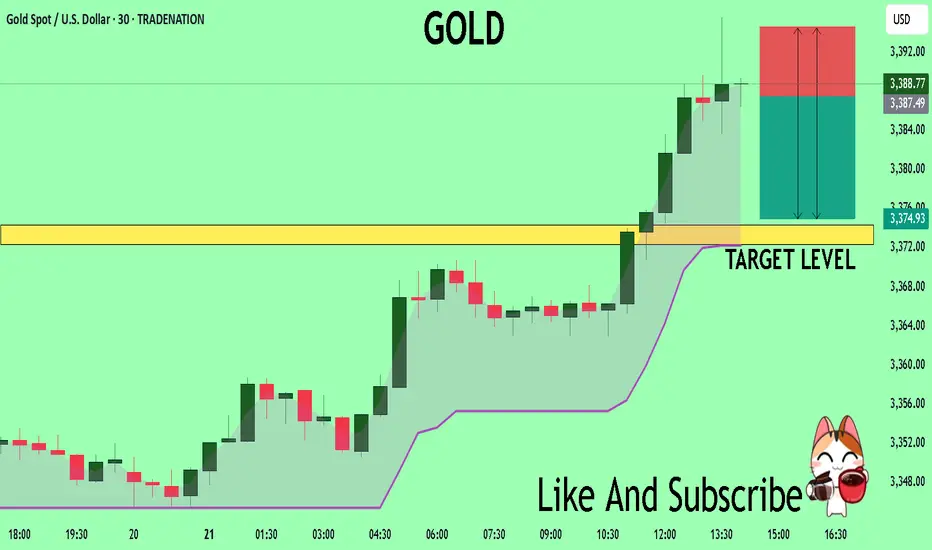
GOLD Technical Analysis! SELL!
My dear subscribers,
This is my opinion on the GOLD next move:
The instrument tests an important psychological level 3387.7
Bias - Bearish
Technical Indicators: Supper Trend gives a precise Bearish signal, while Pivot Point HL predicts price changes and potential reversals in the market.
Target - 3374.3
My Stop Loss - 3394.5
About Used Indicators:
On the subsequent day, trading above the pivot point is thought to indicate ongoing bullish sentiment, while trading below the pivot point indicates bearish sentiment.
Disclosure: I am part of Trade Nation's Influencer program and receive a monthly fee for using their TradingView charts in my analysis.
———————————
WISH YOU ALL LUCK
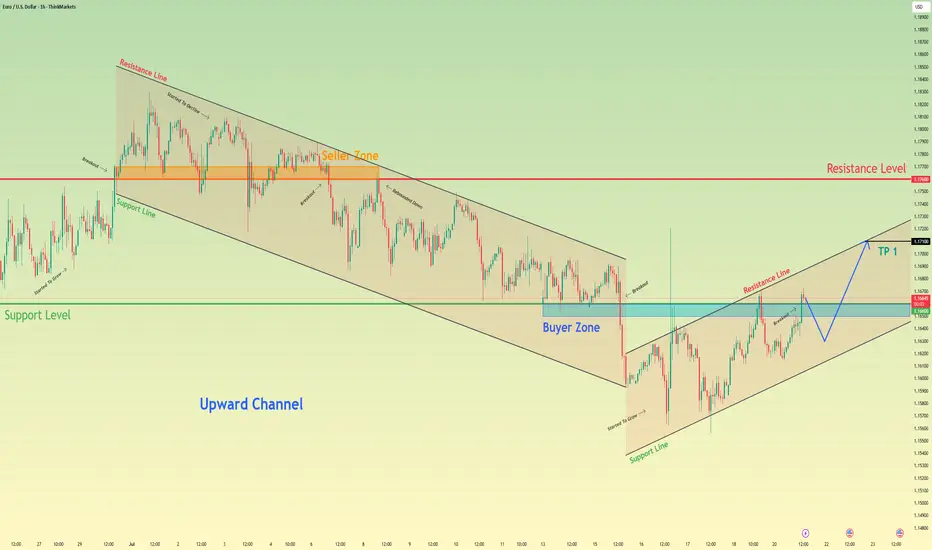
Euro may correct a little and then continue to rise in channelHello traders, I want share with you my opinion about Euro. Observing the recent price action, we can map out a clear transition in market structure. Previously, the pair was contained within a well-defined downward channel, where the seller zone around the 1.1760 resistance level consistently capped rallies, leading to multiple breakdowns and correctional movements. However, after a final push lower, the dynamic shifted, with the price action showing a clear downtrend-to-uptrend reversal. Currently, the euro has established a new upward channel, finding solid ground in the buyer zone around the 1.1660 support level. The price is now engaged in a constructive upward movement within the boundaries of this new channel. The prevailing hypothesis is that after a potential minor correction towards the channel's support line, the pair will resume its ascent. Therefore, the take-profit target for this scenario, tp 1, is strategically placed at 1.1710, as this level directly corresponds with the resistance line of the current upward channel, representing a logical point for price to react. Please share this idea with your friends and click Boost 🚀
Disclaimer: As part of ThinkMarkets’ Influencer Program, I am sponsored to share and publish their charts in my analysis.
DOGE/USDT : eyes More Gains – Mid-Term Targets Up to $0.70! By analyzing the Dogecoin chart on the daily timeframe, we can see that since our last analysis around 7–8 months ago, the price started its rally from $0.10 and surged over 370% to reach $0.48. After that, it corrected back to around $0.13 and is currently trading near $0.27. If Dogecoin manages to hold above $0.25, we can expect further upside movement in the mid-term. The next targets are $0.287, $0.32, $0.41, and $0.70.
Please support me with your likes and comments to motivate me to share more analysis with you and share your opinion about the possible trend of this chart with me !
Best Regards , Arman Shaban

euraud long tradein my opinion this is a good trade with a good r/r
hope hit the tp
consider this is my trade not your trade and i just like to share my trades with world

nzdusd long tradein my opinion this is a good trade with a good r/r
hope it will hit the target
consider this is my trade not your trade
i just like to share my trades with world

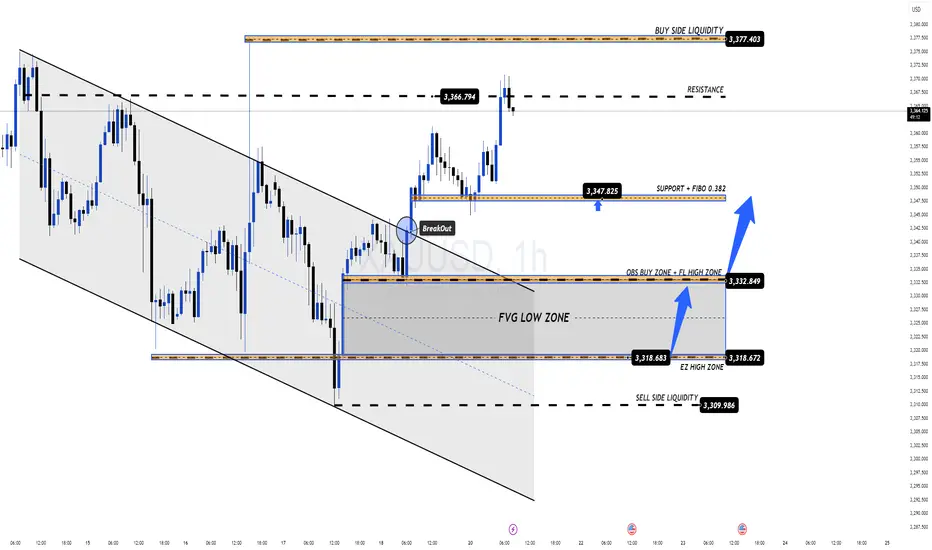
QUIET START TO THE WEEK, WATCH OUT FOR KEY RESISTANCE!🔔 GOLD PLAN 21/07 – QUIET START TO THE WEEK, WATCH OUT FOR KEY RESISTANCE!
🌍 Market Overview
Gold has bounced back strongly following a brief pullback late last week. The move comes as geopolitical tensions and global conflicts continue to escalate.
While this week may not feature high-impact economic data, macroeconomic risks and global uncertainty remain the primary drivers of price action.
📊 Technical Outlook
Price is currently approaching a strong resistance zone between 3377–3380, which aligns with a Buy Side Liquidity region.
💡 Sellers may step in here to push the price lower, aiming to fill FVG zones (Fair Value Gaps) left behind during the previous bullish rally.
⚠️ Entering SELL positions at this level is risky — only act upon confirmed reversal signals (candlestick rejection or volume-based confirmation).
🎯 Trade Setup
🟢 BUY ZONE: 3331 – 3329
Stop Loss: 3325
Take Profits:
3335 → 3340 → 3344 → 3348 → 3352 → 3358 → 3364 → 3370
🔴 SELL ZONE (confirmation required): 3377 – 3379
Stop Loss: 3383
Take Profits:
3372 → 3368 → 3364 → 3360 → 3350
📌 Key Notes
The 3347 zone acts as short-term support for bulls. If this level breaks, a move toward lower FVG liquidity zones becomes more likely.
Keep an eye on EU session volume for clearer short-term direction and better trade timing.
✅ Final Thoughts
Discipline is key. Stick to your TP/SL strategy to manage risk effectively during early-week volatility.
🛡️ Wishing everyone a successful start to the week. Stay patient, stay focused.
GOD BLESS ALL!
GBPAUD: Bullish Movement Continues 🇬🇧🇦🇺
GBPAUD is going to rise more, following a confirmed intraday bullish reversal:
first, the price violated a resistance line of a falling channel.
It started to consolidate within an inverted head & shoulders pattern then.
Its neckline violation is another strong bullish signal.
Next resistance - 2.0685
❤️Please, support my work with like, thank you!❤️
I am part of Trade Nation's Influencer program and receive a monthly fee for using their TradingView charts in my analysis.

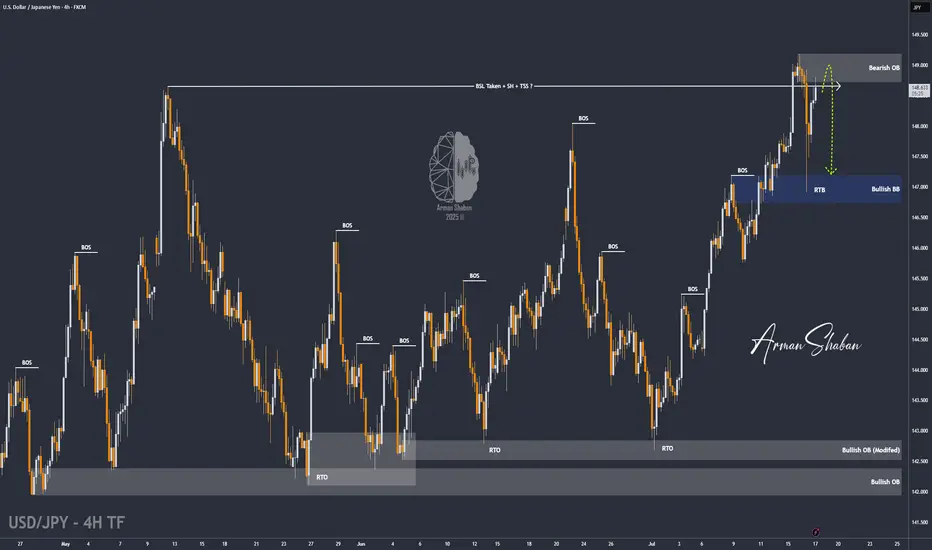
USD/JPY : Get Ready for another Fall ! (READ THE CAPTION)By analyzing the USDJPY chart on the 4-hour timeframe, we can see that after our last daily timeframe analysis, the price started its rally from the 144 zone and, as expected, hit all three targets at 145.5, 147.35, and 148.65, delivering over 500 pips in returns — even reaching as high as 149.2! Once the price broke above 148.65 and swept the liquidity above this level, it faced selling pressure and dropped to 146.9. Currently trading around 148.65, if USDJPY manages to hold below the supply zone between 148.65 and 149.2, we can expect further downside movement. This analysis will be updated with your support!
THE DAILY ANALYSIS :
Please support me with your likes and comments to motivate me to share more analysis with you and share your opinion about the possible trend of this chart with me !
Best Regards , Arman Shaban
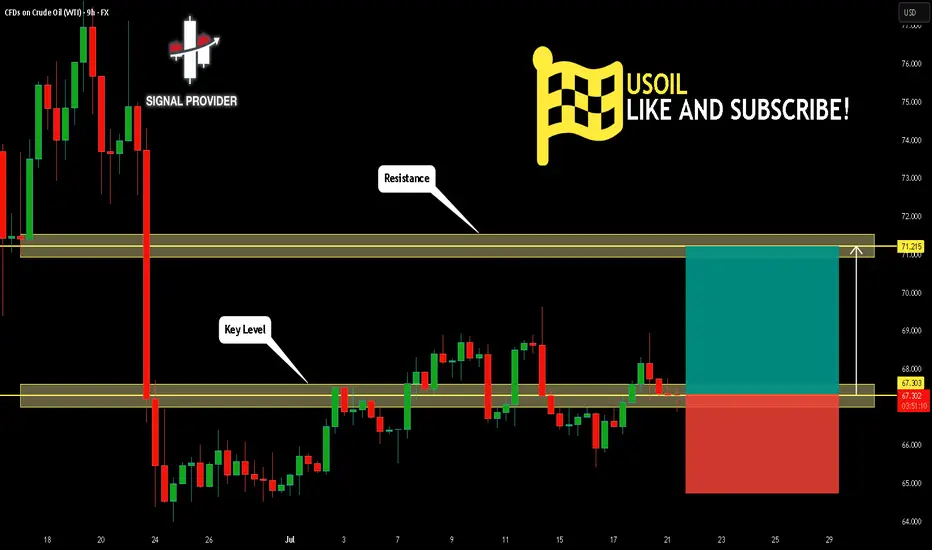
USOIL Will Go Higher! Buy!
Take a look at our analysis for USOIL.
Time Frame: 9h
Current Trend: Bullish
Sentiment: Oversold (based on 7-period RSI)
Forecast: Bullish
The market is approaching a key horizontal level 67.303.
Considering the today's price action, probabilities will be high to see a movement to 71.215.
P.S
We determine oversold/overbought condition with RSI indicator.
When it drops below 30 - the market is considered to be oversold.
When it bounces above 70 - the market is considered to be overbought.
Disclosure: I am part of Trade Nation's Influencer program and receive a monthly fee for using their TradingView charts in my analysis.
Like and subscribe and comment my ideas if you enjoy them!
EURUSD Will Go Up! Long!
Please, check our technical outlook for EURUSD.
Time Frame: 2h
Current Trend: Bullish
Sentiment: Oversold (based on 7-period RSI)
Forecast: Bullish
The market is approaching a significant support area 1.166.
The underlined horizontal cluster clearly indicates a highly probable bullish movement with target 1.170 level.
P.S
Overbought describes a period of time where there has been a significant and consistent upward move in price over a period of time without much pullback.
Disclosure: I am part of Trade Nation's Influencer program and receive a monthly fee for using their TradingView charts in my analysis.
Like and subscribe and comment my ideas if you enjoy them!

USDCHF Will Move Lower! Sell!
Here is our detailed technical review for USDCHF.
Time Frame: 4h
Current Trend: Bearish
Sentiment: Overbought (based on 7-period RSI)
Forecast: Bearish
The market is on a crucial zone of supply 0.799.
The above-mentioned technicals clearly indicate the dominance of sellers on the market. I recommend shorting the instrument, aiming at 0.794 level.
P.S
Please, note that an oversold/overbought condition can last for a long time, and therefore being oversold/overbought doesn't mean a price rally will come soon, or at all.
Disclosure: I am part of Trade Nation's Influencer program and receive a monthly fee for using their TradingView charts in my analysis.
Like and subscribe and comment my ideas if you enjoy them!

GBPJPY Is Bearish! Short!
Take a look at our analysis for GBPJPY.
Time Frame: 1D
Current Trend: Bearish
Sentiment: Overbought (based on 7-period RSI)
Forecast: Bearish
The price is testing a key resistance 198.794.
Taking into consideration the current market trend & overbought RSI, chances will be high to see a bearish movement to the downside at least to 192.854 level.
P.S
The term oversold refers to a condition where an asset has traded lower in price and has the potential for a price bounce.
Overbought refers to market scenarios where the instrument is traded considerably higher than its fair value. Overvaluation is caused by market sentiments when there is positive news.
Disclosure: I am part of Trade Nation's Influencer program and receive a monthly fee for using their TradingView charts in my analysis.
Like and subscribe and comment my ideas if you enjoy them!

USDJPY Is Very Bullish! Buy!
Here is our detailed technical review for USDJPY.
Time Frame: 1D
Current Trend: Bullish
Sentiment: Oversold (based on 7-period RSI)
Forecast: Bullish
The market is approaching a significant support area 144.493.
The underlined horizontal cluster clearly indicates a highly probable bullish movement with target 148.651 level.
P.S
Overbought describes a period of time where there has been a significant and consistent upward move in price over a period of time without much pullback.
Disclosure: I am part of Trade Nation's Influencer program and receive a monthly fee for using their TradingView charts in my analysis.
Like and subscribe and comment my ideas if you enjoy them!

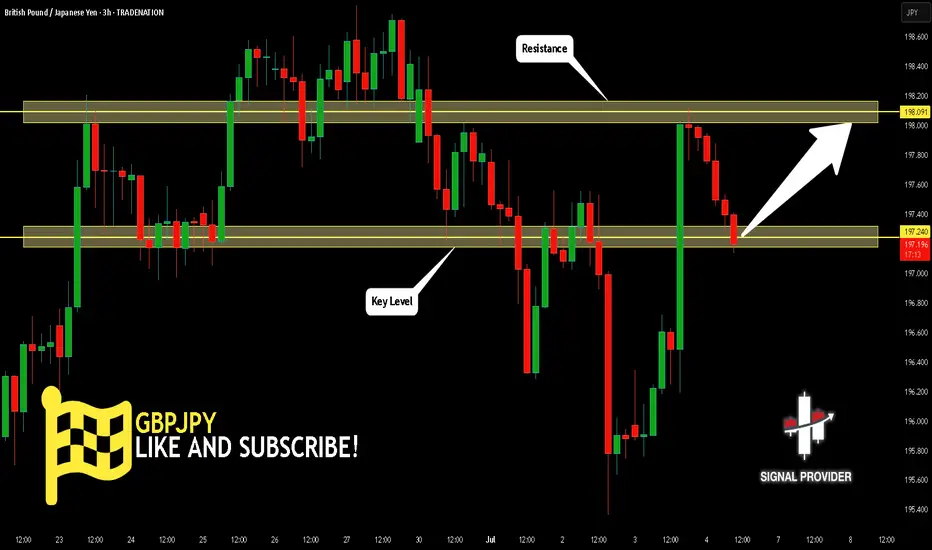
GBPJPY Will Go Up! Buy!
Please, check our technical outlook for GBPJPY.
Time Frame: 3h
Current Trend: Bullish
Sentiment: Oversold (based on 7-period RSI)
Forecast: Bullish
The market is approaching a key horizontal level 197.240.
Considering the today's price action, probabilities will be high to see a movement to 198.091.
P.S
Please, note that an oversold/overbought condition can last for a long time, and therefore being oversold/overbought doesn't mean a price rally will come soon, or at all.
Disclosure: I am part of Trade Nation's Influencer program and receive a monthly fee for using their TradingView charts in my analysis.
Like and subscribe and comment my ideas if you enjoy them!
USDCAD Will Move Higher! Long!
Take a look at our analysis for USDCAD.
Time Frame: 2h
Current Trend: Bullish
Sentiment: Oversold (based on 7-period RSI)
Forecast: Bullish
The market is testing a major horizontal structure 1.368.
Taking into consideration the structure & trend analysis, I believe that the market will reach 1.373 level soon.
P.S
We determine oversold/overbought condition with RSI indicator.
When it drops below 30 - the market is considered to be oversold.
When it bounces above 70 - the market is considered to be overbought.
Disclosure: I am part of Trade Nation's Influencer program and receive a monthly fee for using their TradingView charts in my analysis.
Like and subscribe and comment my ideas if you enjoy them!

EURNZD Will Go Lower From Resistance! Sell!
Take a look at our analysis for EURNZD.
Time Frame: 15m
Current Trend: Bearish
Sentiment: Overbought (based on 7-period RSI)
Forecast: Bearish
The market is on a crucial zone of supply 1.945.
The above-mentioned technicals clearly indicate the dominance of sellers on the market. I recommend shorting the instrument, aiming at 1.943 level.
P.S
Overbought describes a period of time where there has been a significant and consistent upward move in price over a period of time without much pullback.
Disclosure: I am part of Trade Nation's Influencer program and receive a monthly fee for using their TradingView charts in my analysis.
Like and subscribe and comment my ideas if you enjoy them!

USDCHF Will Grow! Long!
Here is our detailed technical review for USDCHF.
Time Frame: 9h
Current Trend: Bullish
Sentiment: Oversold (based on 7-period RSI)
Forecast: Bullish
The market is approaching a significant support area 0.796.
The underlined horizontal cluster clearly indicates a highly probable bullish movement with target 0.804 level.
P.S
We determine oversold/overbought condition with RSI indicator.
When it drops below 30 - the market is considered to be oversold.
When it bounces above 70 - the market is considered to be overbought.
Disclosure: I am part of Trade Nation's Influencer program and receive a monthly fee for using their TradingView charts in my analysis.
Like and subscribe and comment my ideas if you enjoy them!

USDJPY Is Very Bearish! Sell!
Please, check our technical outlook for USDJPY.
Time Frame: 3h
Current Trend: Bearish
Sentiment: Overbought (based on 7-period RSI)
Forecast: Bearish
The market is trading around a solid horizontal structure 148.811.
The above observations make me that the market will inevitably achieve 147.818 level.
P.S
We determine oversold/overbought condition with RSI indicator.
When it drops below 30 - the market is considered to be oversold.
When it bounces above 70 - the market is considered to be overbought.
Disclosure: I am part of Trade Nation's Influencer program and receive a monthly fee for using their TradingView charts in my analysis.
Like and subscribe and comment my ideas if you enjoy them!

GBP/JPY: A Key Short Setup Forms as Momentum FadesHello traders,
Taking a look at GBP/JPY on the 4-hour timeframe. After a significant run, the price action has stalled, and we're seeing clear signs of fading momentum. This is creating a well-defined consolidation zone, which may present a key opportunity for a short position.
The Technical Picture 📊
1️⃣ Price Consolidation: GBP/JPY is currently trading sideways within a tight range, highlighted on the chart. This period of indecision and balance between buyers and sellers often precedes a significant directional move. The structure suggests a phase of distribution may be underway.
2️⃣ Fading Momentum: The Relative Strength Index (RSI) confirms this loss of momentum. A sustained reading below the 50 midline would signal that sellers are beginning to gain control and that the path of least resistance is shifting to the downside.
The Strategy 🧠
The core idea is to anticipate a bearish breakdown from the identified consolidation zone. A clean break and hold below this range would serve as confirmation that sellers have taken over, providing an opportunity to enter a short position targeting a continuation of the larger bearish move.
Trade Parameters 📉
👉 Entry: 198.895
⛔️ Stop Loss: 201.405
🎯 Take Profit: 192.872
Risk/Reward Ratio: approx. 2.4
This is my personal analysis and perspective, not financial advice. Always conduct your own research and manage your risk accordingly.
Good luck, and trade safe.

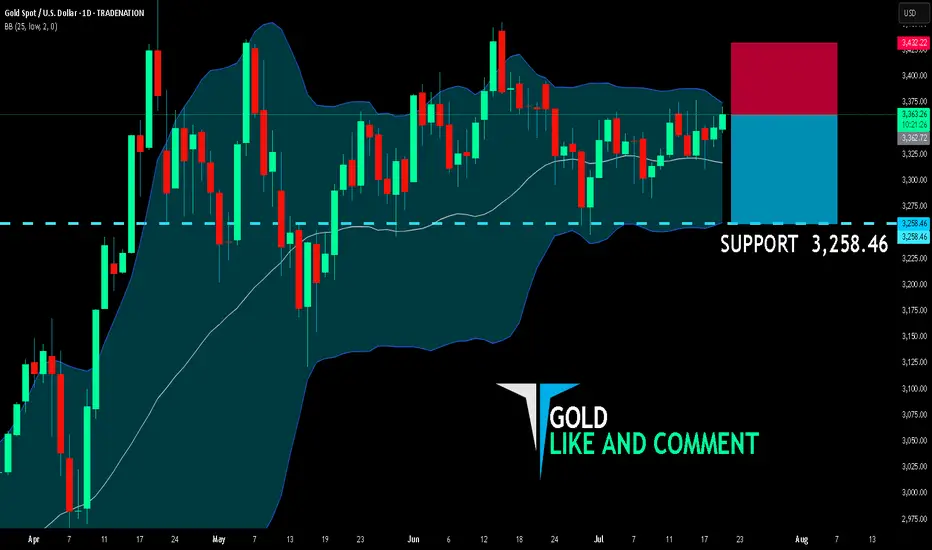
GOLD BEARS ARE GAINING STRENGTH|SHORT
GOLD SIGNAL
Trade Direction: short
Entry Level: 3,362.72
Target Level: 3,258.46
Stop Loss: 3,432.22
RISK PROFILE
Risk level: medium
Suggested risk: 1%
Timeframe: 1D
Disclosure: I am part of Trade Nation's Influencer program and receive a monthly fee for using their TradingView charts in my analysis.
✅LIKE AND COMMENT MY IDEAS✅
NZD/USD BUYERS WILL DOMINATE THE MARKET|LONG
NZD/USD SIGNAL
Trade Direction: long
Entry Level: 0.595
Target Level: 0.608
Stop Loss: 0.587
RISK PROFILE
Risk level: medium
Suggested risk: 1%
Timeframe: 1D
Disclosure: I am part of Trade Nation's Influencer program and receive a monthly fee for using their TradingView charts in my analysis.
✅LIKE AND COMMENT MY IDEAS✅
