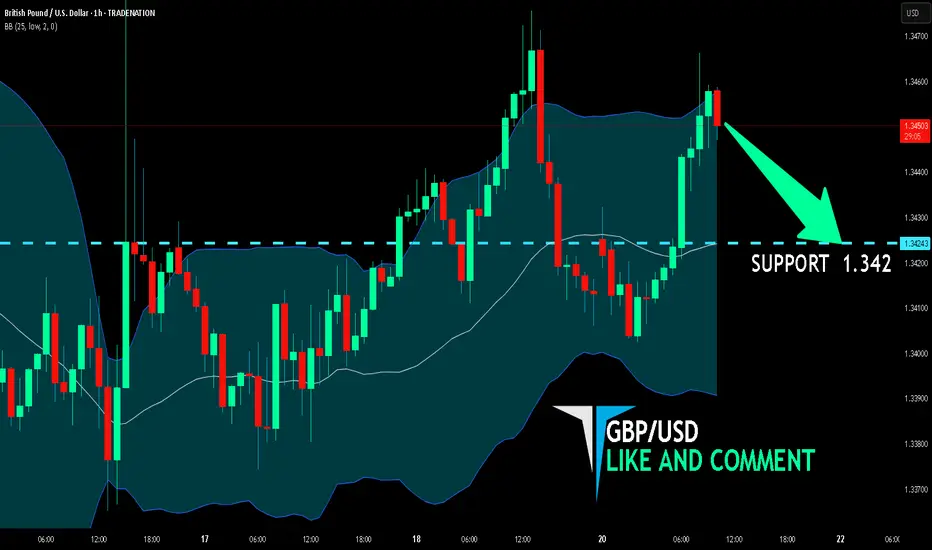
GBP/USD BEARISH BIAS RIGHT NOW| SHORT
Hello, Friends!
We are targeting the 1.342 level area with our short trade on GBP/USD which is based on the fact that the pair is overbought on the BB band scale and is also approaching a resistance line above thus going us a good entry option.
Disclosure: I am part of Trade Nation's Influencer program and receive a monthly fee for using their TradingView charts in my analysis.
✅LIKE AND COMMENT MY IDEAS✅
Forex
July 21, Forex Outlook : Don’t Miss These High-Reward Setups!Welcome back, traders!
In today’s video, we’ll be conducting a Forex Weekly Outlook, analyzing multiple currency pairs from a top-down perspective—starting from the higher timeframes and working our way down to the lower timeframes.
Pairs to focus on this Week:
EURUSD
USDJPY
AUDJPY
CADJPY
EURJPY
GBPCHF
USDCHF
NZDCHF
EURNZD
Our focus will be on identifying high-probability price action scenarios using clear market structure, institutional order flow, and key confirmation levels. This detailed breakdown is designed to give you a strategic edge and help you navigate this week’s trading opportunities with confidence.
📊 What to Expect in This Video:
1. Higher timeframe trend analysis
2. Key zones of interest and potential setups
3. High-precision confirmations on lower timeframes
4. Institutional insight into where price is likely to go next
Stay tuned, take notes, and be sure to like, comment, and subscribe so you don’t miss future trading insights!
Have a great week ahead, God bless you!
The Architect 🏛️📉

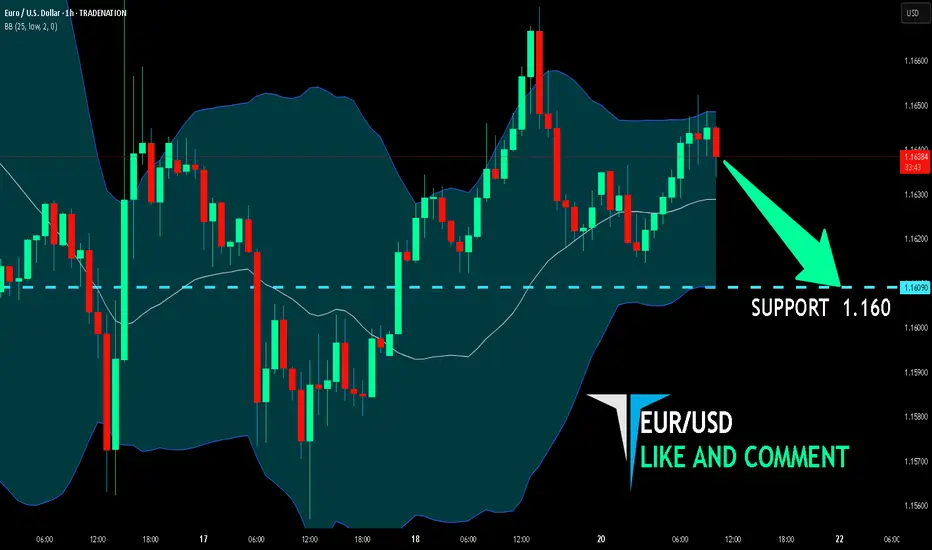
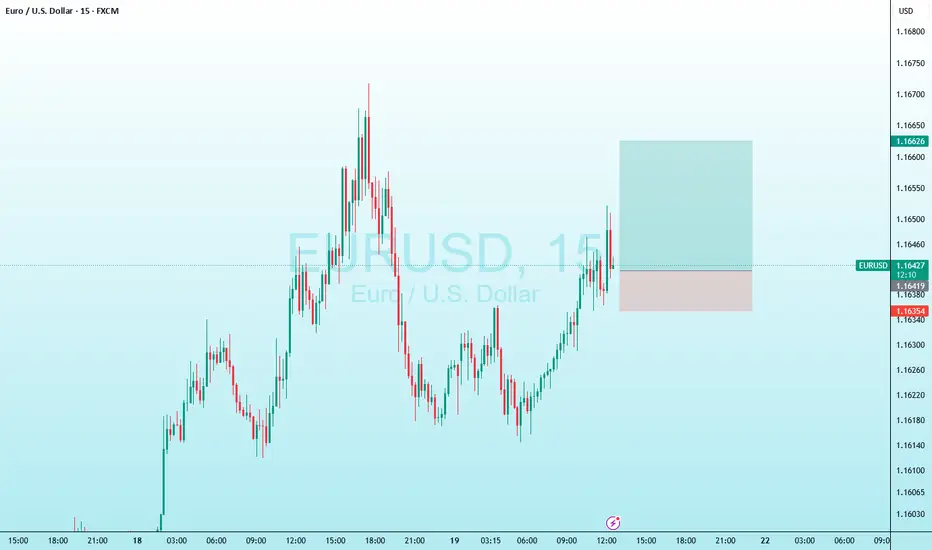
EUR/USD BEST PLACE TO SELL FROM|SHORT
Hello, Friends!
EUR/USD is making a bullish rebound on the 1H TF and is nearing the resistance line above while we are generally bearish biased on the pair due to our previous 1W candle analysis, thus making a trend-following short a good option for us with the target being the 1.160level.
Disclosure: I am part of Trade Nation's Influencer program and receive a monthly fee for using their TradingView charts in my analysis.
✅LIKE AND COMMENT MY IDEAS✅
USDJPY SELL
USD/JPY
Editorial Tools Latest
USD/JPY Forecast and News
share
Join
NEW
Japanese Yen hangs near multi-month low against USD ahead of Japan election on Sunday
The Japanese Yen drifts lower against its American counterpart for the second straight day on Friday and remains within striking distance of an over three-month low touched earlier this week. Investors now seem convinced that the Bank of Japan (BoJ) would forgo raising interest rates this year amid worries about the economic fallout from higher US tariffs
From a technical perspective, the USD/JPY pair showed some resilience below the 100-hour Simple Moving Average (SMA) earlier this week, and the subsequent move up favors bullish traders. Moreover, oscillators are holding comfortably in positive territory and are still away from being in the overbought zone. However, the overnight failure to build on the momentum beyond the 149.00 mark warrants some caution. Hence, it will be prudent to wait for some follow-through buying beyond the 149.15-149.20 region, or a multi-month peak, before positioning for a move towards reclaiming the 150.00 psychological mark.
On the flip side, the 148.20-148.25 region, or the 100-hour SMA, could offer immediate support ahead of the 148.00 mark. Some follow-through selling, leading to a slide below the 147.70 area, could make the USD/JPY pair vulnerable to accelerate the fall towards testing sub-147.00 levels. Acceptance below the latter might shift the bias in favor of bearish trades and drag spot prices to the 146.60 intermediate support en route to the 146.20 area, the 146.00 mark, and the 100-day SMA, currently pegged near the 145.80 region
1 SUPPORT147.642
2 SUPPORT 147.311
3 SUPPORT 146917
1 RESISTANCE 148.206
2 RESISTANCE 147.972

SILVER SELLERS WILL DOMINATE THE MARKET|SHORT
SILVER SIGNAL
Trade Direction: short
Entry Level: 3,612.8
Target Level: 3,572.6
Stop Loss: 3,639.3
RISK PROFILE
Risk level: medium
Suggested risk: 1%
Timeframe: 2h
Disclosure: I am part of Trade Nation's Influencer program and receive a monthly fee for using their TradingView charts in my analysis.
✅LIKE AND COMMENT MY IDEAS✅

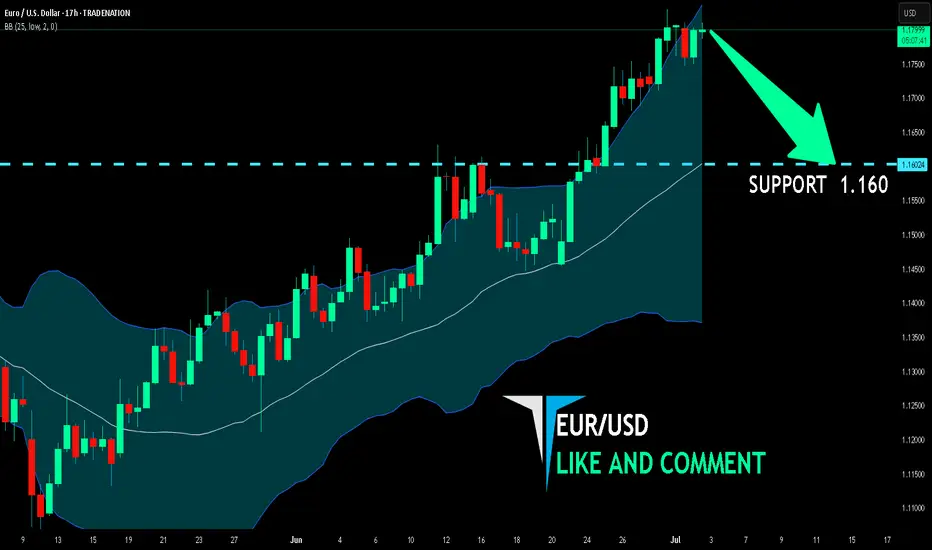
EUR/USD BEST PLACE TO SELL FROM|SHORT
Hello, Friends!
EUR/USD pair is trading in a local downtrend which know by looking at the previous 1W candle which is red. On the 17H timeframe the pair is going up. The pair is overbought because the price is close to the upper band of the BB indicator. So we are looking to sell the pair with the upper BB line acting as resistance. The next target is 1.160 area.
Disclosure: I am part of Trade Nation's Influencer program and receive a monthly fee for using their TradingView charts in my analysis.
✅LIKE AND COMMENT MY IDEAS✅
NG1! BEARS ARE GAINING STRENGTH|SHORT
NG1! SIGNAL
Trade Direction: short
Entry Level: 3.737
Target Level: 3.205
Stop Loss: 4.089
RISK PROFILE
Risk level: medium
Suggested risk: 1%
Timeframe: 1D
Disclosure: I am part of Trade Nation's Influencer program and receive a monthly fee for using their TradingView charts in my analysis.
✅LIKE AND COMMENT MY IDEAS✅

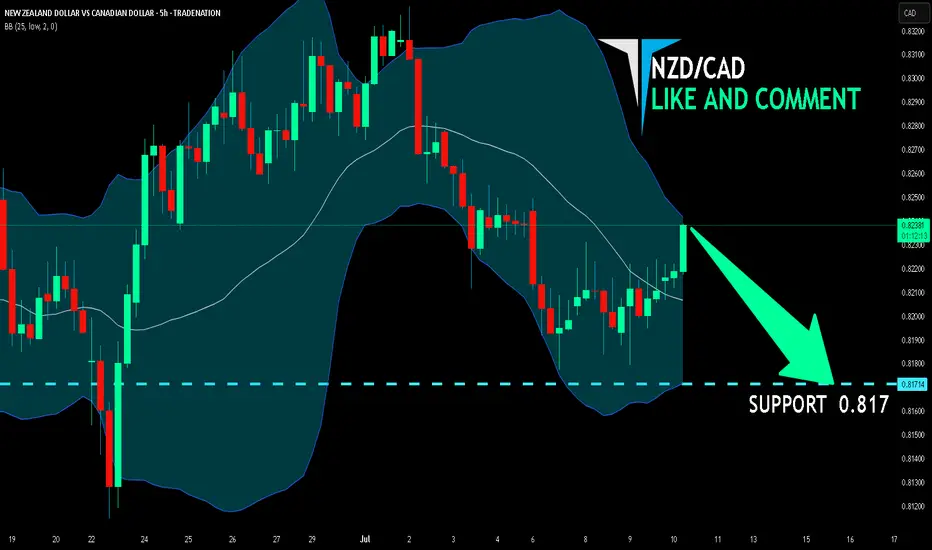
NZD/CAD SELLERS WILL DOMINATE THE MARKET|SHORT
Hello, Friends!
NZD/CAD pair is trading in a local uptrend which we know by looking at the previous 1W candle which is green. On the 5H timeframe the pair is going up too. The pair is overbought because the price is close to the upper band of the BB indicator. So we are looking to sell the pair with the upper BB line acting as resistance. The next target is 0.817 area.
Disclosure: I am part of Trade Nation's Influencer program and receive a monthly fee for using their TradingView charts in my analysis.
✅LIKE AND COMMENT MY IDEAS✅
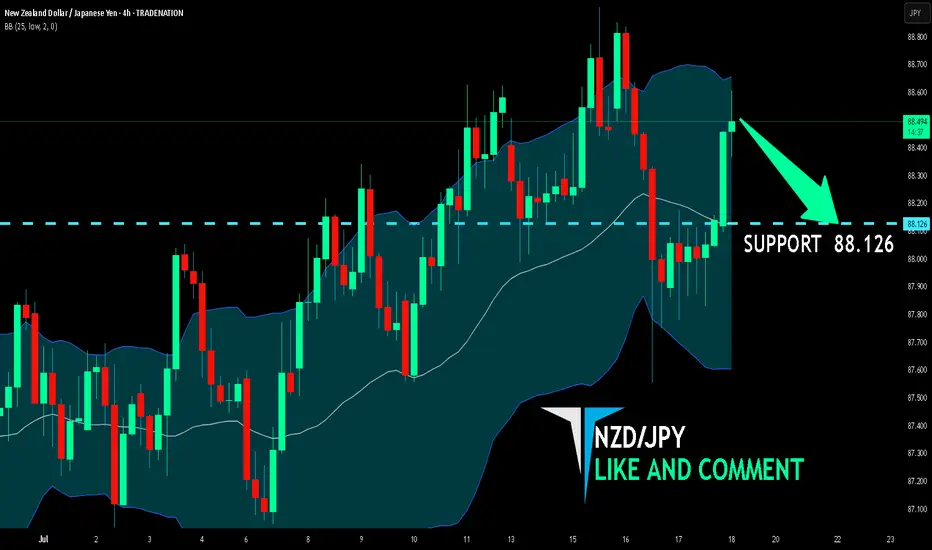
NZD/JPY BEARS ARE STRONG HERE|SHORT
Hello, Friends!
NZD/JPY pair is trading in a local uptrend which we know by looking at the previous 1W candle which is green. On the 4H timeframe the pair is going up too. The pair is overbought because the price is close to the upper band of the BB indicator. So we are looking to sell the pair with the upper BB line acting as resistance. The next target is 88.126 area.
Disclosure: I am part of Trade Nation's Influencer program and receive a monthly fee for using their TradingView charts in my analysis.
✅LIKE AND COMMENT MY IDEAS✅
GBPAUD's wide trading range remains intact✏️GBPAUD is trading in a wide range. After the increase on Friday, the pair is retesting the support zone breaking past resistance. And the current reaction point also coincides with the 20 SMA. There is not much momentum for the pair to break out of the wide trading range, so buying the pair to the upper range of 2.097 is a reasonable choice at the moment.
📉 Key Levels
Support: 2.058
Resistance: 2.083-2.096
BUY Trigger: Confirmed bounce from 2.059 (EMA support)
Target 2.09600
BUY DCA Trigger: Break 2.083
Leave your comments on the idea. I am happy to read your views.

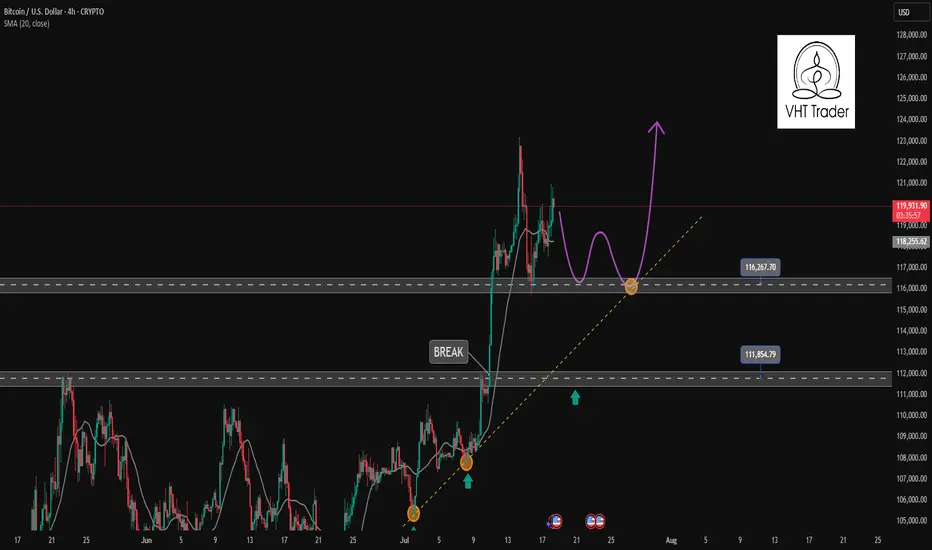
Find a recovery point to continue buying BTC✏️ CRYPTO:BTCUSD is trading near the all-time high. The trading strategy is to wait for some investors to take profit so that the price can return to the nearest support zones and continue to buy to the new all-time high zones.
📉 Key Levels
BUY Trigger: confirms the recovery from the support trend line 116000
BUY zone 112000 (Strong support zone)
Target 129000
Leave your comments on the idea. I am happy to read your views.
EURUSD Trading Price Channel, SELL Strategy✏️ OANDA:EURUSD H4 Timeframe EURUSD is trading in a bearish channel. This bearish channel may extend to the important support at 1.145. A break of this important support will form a Downtrend. Further upside recovery will remain limited by the channel, with the notable upper boundary at 1.16800.
📉 Key Levels
Sell trigger: rejection from 1.168 with bearish confirmation
Sell DCA: Break 1.155
Target: 1.145
Leave your comments on the idea. I am happy to read your views.

EURUSD is Nearing the Daily Uptrend! Hey Traders, in today's trading session we are monitoring EURUSD for a buying opportunity around 1.15800 zone, EURUSD is trading in an uptrend and currently is in a correction phase in which it is approaching the trend at 1.15800 support and resistance area.
Trade safe, Joe.

eurusd long positionin my opinion this is a good trade with a good r/r
hope hit the tp
consider this is my trade not your trade and i just like to share my trades with world
Market Analysis: USD/CAD Consolidates GainsMarket Analysis: USD/CAD Consolidates Gains
USD/CAD declined and now consolidates below the 1.3750 level.
Important Takeaways for USD/CAD Analysis Today
- USD/CAD started a fresh decline after it failed to clear the 1.3775 resistance.
- There is a key bullish trend line forming with support at 1.3715 on the hourly chart at FXOpen.
USD/CAD Technical Analysis
On the hourly chart of USD/CAD at FXOpen, the pair climbed toward the 1.3775 resistance zone before the bears appeared. The US Dollar formed a swing high near 1.3774 and recently declined below the 1.3750 support against the Canadian Dollar.
There was also a close below the 50-hour simple moving average and 1.3735. The pair is now consolidating losses below the 50% Fib retracement level of the downward move from the 1.3774 swing high to the 1.3695 low. But the bulls are active near the 1.3700 level.
If there is a fresh increase, the pair could face resistance near the 1.3735 level. The next key resistance on the USD/CAD chart is near the 1.3755 level or the 61.8% Fib retracement level.
If there is an upside break above 1.3755, the pair could rise toward 1.3775. The next major resistance is near the 1.3800 zone, above which it could rise steadily toward 1.3880.
Immediate support is near the 1.3715 level and a key bullish trend line. The first major support is near 1.3675. A close below the 1.3675 level might trigger a strong decline. In the stated case, USD/CAD might test 1.3650. Any more losses may possibly open the doors for a drop toward the 1.3620 support.
This article represents the opinion of the Companies operating under the FXOpen brand only. It is not to be construed as an offer, solicitation, or recommendation with respect to products and services provided by the Companies operating under the FXOpen brand, nor is it to be considered financial advice.

Market Analysis: GBP/USD Dips FurtherMarket Analysis: GBP/USD Dips Further
GBP/USD started a downside correction from the 1.3620 zone.
Important Takeaways for GBP/USD Analysis Today
- The British Pound started a fresh decline and settled below the 1.3500 zone.
- There is a connecting bullish trend line forming with support at 1.3415 on the hourly chart of GBP/USD at FXOpen.
GBP/USD Technical Analysis
On the hourly chart of GBP/USD at FXOpen, the pair struggled above the 1.3600 zone. The British Pound started a fresh decline below the 1.3550 pivot level against the US Dollar, as discussed in the previous analysis.
The pair dipped below the 1.3500 and 1.3450 levels. A low was formed at 1.3364 and the pair is now consolidating losses. On the upside, it is facing resistance near the 1.3475 level. The next key resistance is near 1.3490 and the 50% Fib retracement level of the downward move from the 1.3619 swing high to the 1.3364 low.
An upside break above the 1.3490 zone could send the pair toward 1.3520 and the 61.8% Fib retracement level.
More gains might open the doors for a test of 1.3620. If there is another decline, the pair could find support near the 1.3415 level and a connecting bullish trend line. The first major support sits near the 1.3365 zone.
The next major support is 1.3350. If there is a break below 1.3350, the pair could extend the decline. The next key support is near the 1.3320 level. Any more losses might call for a test of 1.3250.
This article represents the opinion of the Companies operating under the FXOpen brand only. It is not to be construed as an offer, solicitation, or recommendation with respect to products and services provided by the Companies operating under the FXOpen brand, nor is it to be considered financial advice.

NASDAQ INDEX (US100): Bullish Continuation Confirmed
NASDAQ Index broke and closed above a resistance of a horizontal
parallel channel on a daily.
It confirms a bullish trend continuation and a highly probable growth
to the next strong resistance.
Goal - 23300
❤️Please, support my work with like, thank you!❤️

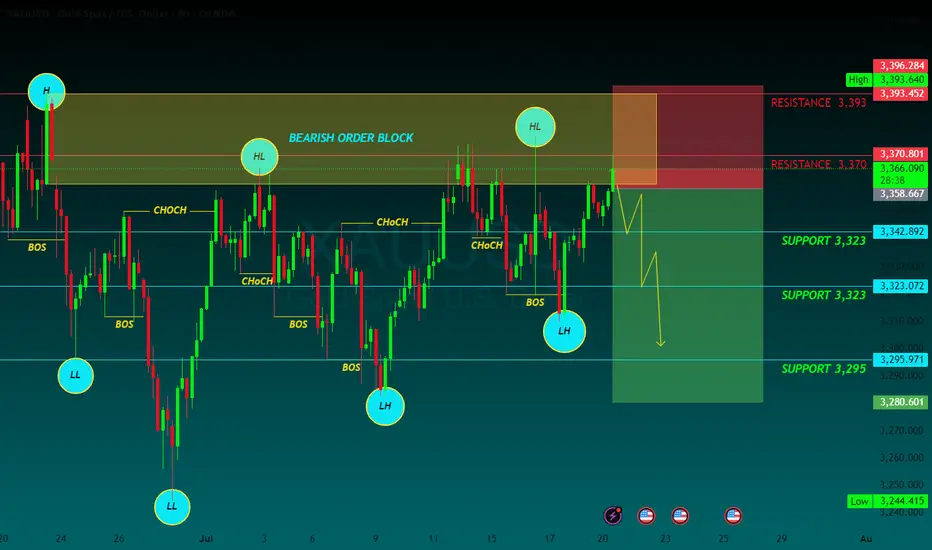
GOLD SELLGold price remains confined in a multi-week-old range as bulls seem reluctant
Gold price attracts some safe-haven flows amid persistent trade-related uncertainties. Mixed Fed rate cut cues keep the USD depressed and further benefit the XAU/USD pair. The range-bound price action warrants some caution before placing fresh bullish bets.
In the Forex market, Gold functions as a currency. The particularity of Gold is that it is traded against the United States Dollar (USD), with the internationally accepted code for gold being XAU.
Known as a safe-haven asset, Gold is expected to appreciate in periods of market volatility and economic uncertainty. Gold is also widely seen as a hedge against inflation and against depreciating currencies as it doesn’t rely on any specific issuer or government.
Central banks are the biggest Gold holders. In their aim to support their currencies in turbulent times, central banks tend to diversify their reserves and buy Gold to improve the perceived strength of the economy and the currency. The United States is the country that holds the biggest resources of Gold in the world.
1 SUPPORT 3,323
2 SUPPORT 3,323
3 SUPPORT 3,295
1 RESISTANCE 3,370
2 RESISTANCE 3,393
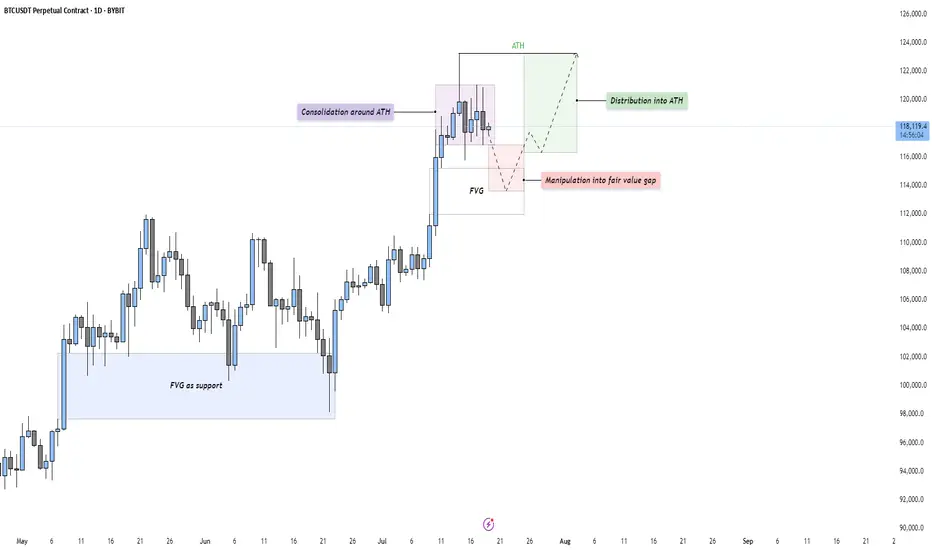
BTC - Consolidation, Manipulation & DistributionMarket Context
After a strong impulsive rally, Bitcoin is currently consolidating just beneath its All-Time High (ATH). This type of consolidation following an extended move higher often indicates indecision in the market — a pause that either leads to continuation or reversal. The current structure suggests that price is building energy for the next leg.
Consolidation and Liquidity Above ATH
The price action is tight and sideways around the ATH, which likely means liquidity is building above. Many stop-losses and breakout orders are sitting just overhead — classic conditions for a Buy Side Liquidity Sweep. This range may serve as a trap for early breakout traders, providing an opportunity for smart money to manipulate price lower before taking it higher.
Fair Value Gap Retest Scenario
Below the current range, we see a Daily Fair Value Gap that aligns with prior bullish imbalances. A move down into this Gap would represent a manipulation phase — shaking out weak longs before rebounding. The Gap also acts as a potential support level where buyers might be waiting. If price reaches into this zone and reacts strongly, it may offer a high-probability long setup.
Distribution or Reaccumulation?
While this could be interpreted as distribution beneath resistance, it’s equally valid to consider it a reaccumulation phase — a temporary markdown into demand before a fresh expansion. If the market dips into the Gap and quickly reclaims the range, it opens the door for a clean breakout above the ATH and continuation toward the 124,000–126,000 region.
Final Thoughts
Price rarely moves in a straight line. It pauses, retraces, and often tricks participants before making the real move. This type of consolidation presents opportunity — but also demands patience and clarity.
If you found this breakdown insightful, a like would be much appreciated! And I’d love to hear your thoughts in the comments — are we about to sweep down into demand, or is the rocket already on the launchpad?
GBPJPY - Trading The Range!Hello TradingView Family / Fellow Traders. This is Richard, also known as theSignalyst.
📈GBPJPY has been hovering within a big range.
This week, GBPJPY is retesting the upper bound of the range and $200 round number.
As long as the resistance holds, we will be looking for shorts on lower timeframes, targeting the lower bound of the range.
📚 Always follow your trading plan regarding entry, risk management, and trade management.
Good luck!
All Strategies Are Good; If Managed Properly!
~Rich
Disclosure: I am part of Trade Nation's Influencer program and receive a monthly fee for using their TradingView charts in my analysis.

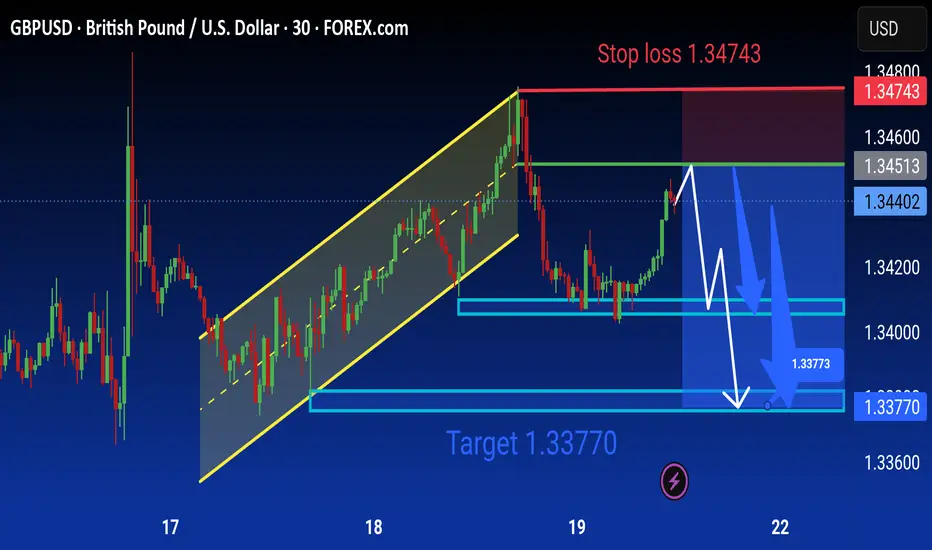
Gbpusd Analysis is Ready Move will be down technical analysis of the GBP/USD (British Pound/US Dollar) currency pair on the 30-minute timeframe using FOREX.com data. Here's a detailed breakdown of the analysis:
---
Chart Summary:
Current Price:
Sell: 1.34401
Buy: 1.34406
Timeframe: 30 minutes (M30)
Platform: TradingView with FOREX.com data
Technical Elements:
1. Ascending Channel (Yellow Parallel Lines):
Price was previously moving in an upward trend within this ascending channel.
The breakout to the downside indicates a potential trend reversal or correction.
2. Bearish Scenario (Blue Arrows):
The chart suggests a short (sell) setup.
Price is expected to face resistance around the 1.34513–1.34600 zone (marked by the green line).
A projected downward move is illustrated with blue arrows, targeting 1.33770.
3. Stop Loss:
Positioned at 1.34743 (highlighted in red), above the recent highs — managing risk for the sell position.
4. Support Zones (Blue Boxes):
First support area near 1.34000
Second, stronger support and main target at 1.33770
5. Target Label:
“Target 1.33770” is clearly marked in blue, showing the final expected move of the sell trade.
6. Forecast Path (White Lines):
Indicates potential short-term bullish pullback before continuing the bearish trend.
---
Trade Idea:
Sell GBP/USD near current resistance
Stop Loss: 1.34743
Take Profit (Target): 1.33770
Bias: Bearish short-term, following the channel breakout
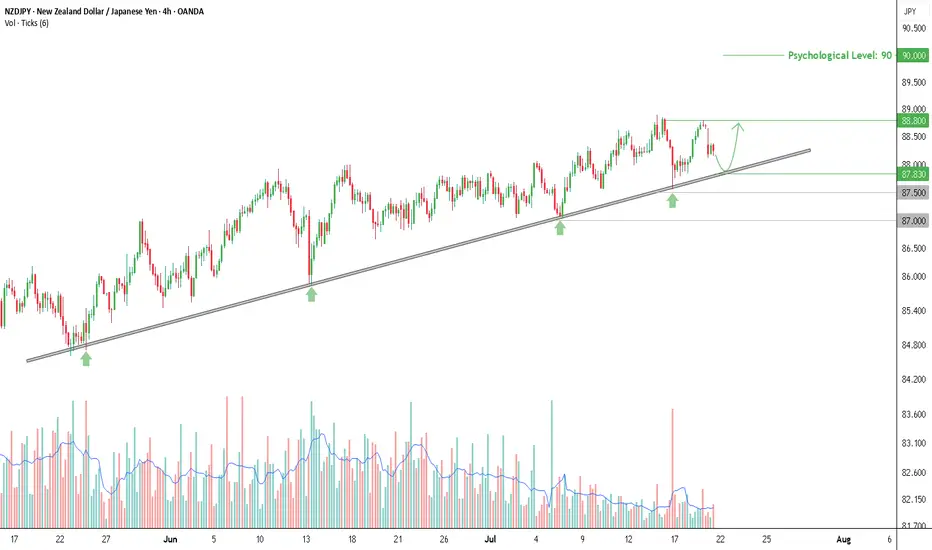
Buy Opportunity on NZDJPY, Testing Trendline with Rising VolumeThe NZDJPY chart on the 4-hour timeframe shows a consistent uptrend pattern, supported by a well-respected ascending trendline that has been tested multiple times since late May 2025. Rebounds from this trendline are marked by green arrows on the chart, indicating a strong reaction zone. Each time price touches the trendline, trading volume tends to increase—signaling active buying interest from market participants.
Currently, price is pulling back toward the trendline support area around 87.830, which could once again act as a bounce point, just like in previous sessions. As long as this trendline holds, the rebound scenario remains dominant and offers a potential opportunity for a long (buy) setup.
Entry & Take Profit
If price bounces from the trendline area, a buy entry can be considered around 87.83, with an initial take profit target at 88.80—the nearest local resistance level and previous consolidation zone.
Should the bullish momentum continue and break above 88.80, the next upside target could reach the psychological level of 90.00.
Stop Loss
As a risk boundary, a closing price below 87.50 can be used as a stop loss (SL) level, as it would indicate a potential breakdown of the higher low structure that has been forming.
If the trendline fails and price drops further, a deeper decline may extend toward the 87.00 area, which is a previously established horizontal support.
Additional Confirmation
It’s recommended to wait for bullish price action signals around the trendline area before entering a position, such as a bullish engulfing pattern, pin bar, or rejection candle. Also, monitor for a spike in volume as price approaches support, as increased volume often indicates strong buying interest.
As long as the trendline holds, the upward bounce scenario remains valid and should be considered for short- to medium-term buy strategies. The 87.83–87.90 zone is a key area to watch for the next market reaction.
Disclaimer: This analysis is part of a trading plan and does not constitute investment advice. Always use strict risk management and consider potential losses in every trade decision.
Xauusd Analysis is Ready technical analysis of XAUUSD (Gold Spot vs. US Dollar) on the 15-minute timeframe using support and resistance levels, with projected price movements annotated.
Key Levels:
Support Zone: Around 3350 USD (labeled as "Support 3350")
Resistance Zones:
Minor resistance: Around 3380.18 USD
Major resistance: Around 3390.77 USD
Target: 3390 USD, highlighted as the ultimate bullish goal.
Current Price:
Price at the time of analysis: ~3368.30 USD
Analysis Summary:
1. Support Retest Scenario:
Price may pull back to the 3350 support zone.
If this support holds, a bullish reversal is expected.
The anticipated move is a rebound back toward the resistance zone at 3380, and possibly to the target at 3390.
2. Immediate Bullish Continuation:
Alternatively, price could continue upwards from the current level without revisiting support.
Resistance around 3380 may act as a minor barrier.
If broken, the price could reach the target at 3390.
3. Bearish Risk:
If 3350 fails to hold as support, further downside may occur, invalidating the bullish setup.
Strategy Implication:
Buy positions could be considered on a successful retest and bounce at 3350.
Take-profits might be set near 3380 and 3390.
Traders should watch for price action confirmation at key levels before entering trades.
This is a classic support-resistance trading setup with short-term bullish bias aiming for a breakout toward higher resistance levels
