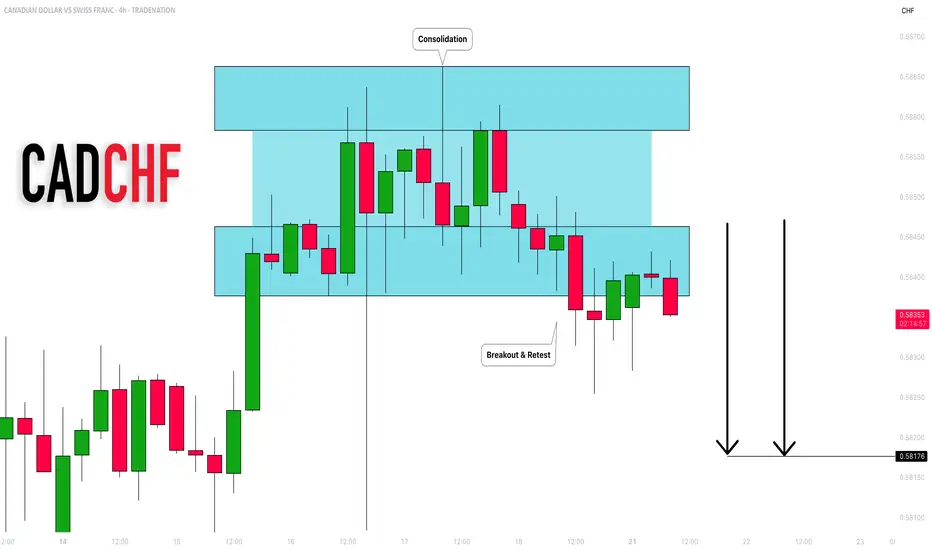
CADCHF: Bearish Outlook Explained 🇨🇦🇨🇭
CADCHF completed an intraday consolidation within a horizontal
parallel channel.
Its support was broken on Friday and we see a positive bearish
reaction to that after its retest.
With a high probability, the price will drop to 0.582 level soon.
❤️Please, support my work with like, thank you!❤️
I am part of Trade Nation's Influencer program and receive a monthly fee for using their TradingView charts in my analysis.
Forex
GBPCAD Q3 | D21 | W30 | Y25📊GBPCAD Q3 | D21 | W30 | Y25
Daily Forecast 🔍📅
Here’s a short diagnosis of the current chart setup 🧠📈
Higher time frame order blocks have been identified — these are our patient points of interest 🎯🧭.
It’s crucial to wait for a confirmed break of structure 🧱✅ before forming a directional bias.
This keeps us disciplined and aligned with what price action is truly telling us.
📈 Risk Management Protocols
🔑 Core principles:
Max 1% risk per trade
Only execute at pre-identified levels
Use alerts, not emotion
Stick to your RR plan — minimum 1:2
🧠 You’re not paid for how many trades you take, you’re paid for how well you manage risk.
🧠 Weekly FRGNT Insight
"Trade what the market gives, not what your ego wants."
Stay mechanical. Stay focused. Let the probabilities work.
FRGNT 📊

USDJPY Q3 | D21 | W30 | Y25📊USDJPY Q3 | D21 | W30 | Y25
Daily Forecast 🔍📅
Here’s a short diagnosis of the current chart setup 🧠📈
Higher time frame order blocks have been identified — these are our patient points of interest 🎯🧭.
It’s crucial to wait for a confirmed break of structure 🧱✅ before forming a directional bias.
This keeps us disciplined and aligned with what price action is truly telling us.
📈 Risk Management Protocols
🔑 Core principles:
Max 1% risk per trade
Only execute at pre-identified levels
Use alerts, not emotion
Stick to your RR plan — minimum 1:2
🧠 You’re not paid for how many trades you take, you’re paid for how well you manage risk.
🧠 Weekly FRGNT Insight
"Trade what the market gives, not what your ego wants."
Stay mechanical. Stay focused. Let the probabilities work.
FRGNT 📊

XAU/USD Elliott Wave Setup : Triangle Ends, Impulse BeginsThe 8-hour XAU/USD chart presents an Elliott Wave structure, currently in the final stages of Wave 4 within a larger impulsive cycle. The complex correction in Wave 4 has unfolded as a WXYXZ (triple-three pattern), forming a contracting triangle (ABCDE) — a classic consolidation phase that typically precedes a sharp impulsive breakout.
Wave E has recently completed near the lower boundary of the triangle, supported by the ascending trendline drawn from the April low. This suggests the correction is mature and Wave 5 is ready to ignite.
Target 1 (T1) : 3434.845
Target 2 (T2) : 3500.535
Stop Loss (SL) : 3309.729
The triangle (Wave 4) breakout structure suggests bullish continuation.
Multiple internal WXY corrective waves have completed, signaling exhaustion.
Volume and candle structure support the possibility of impulsive buying in Wave 5.

Heading into overlap resistance?USD/JPY is rising towards the pivot and could reverse to the 1st support which has been identified as a pullback support.
Pivot: 151.42
1st Support: 146.67
1st Resistance: 154.34
Risk Warning:
Trading Forex and CFDs carries a high level of risk to your capital and you should only trade with money you can afford to lose. Trading Forex and CFDs may not be suitable for all investors, so please ensure that you fully understand the risks involved and seek independent advice if necessary.
Disclaimer:
The above opinions given constitute general market commentary, and do not constitute the opinion or advice of IC Markets or any form of personal or investment advice.
Any opinions, news, research, analyses, prices, other information, or links to third-party sites contained on this website are provided on an "as-is" basis, are intended only to be informative, is not an advice nor a recommendation, nor research, or a record of our trading prices, or an offer of, or solicitation for a transaction in any financial instrument and thus should not be treated as such. The information provided does not involve any specific investment objectives, financial situation and needs of any specific person who may receive it. Please be aware, that past performance is not a reliable indicator of future performance and/or results. Past Performance or Forward-looking scenarios based upon the reasonable beliefs of the third-party provider are not a guarantee of future performance. Actual results may differ materially from those anticipated in forward-looking or past performance statements. IC Markets makes no representation or warranty and assumes no liability as to the accuracy or completeness of the information provided, nor any loss arising from any investment based on a recommendation, forecast or any information supplied by any third-party.

Bullish momentum to extend?The Fiber (EUR/USD) is reacting off the pivot which is a pullback support that aligns with the 61.8% Fibonacci retracement and could bounce to the 1st resistance.
Pivot: 1.1584
1st Support: 1.1448
1st Resistance: 1.1809
Risk Warning:
Trading Forex and CFDs carries a high level of risk to your capital and you should only trade with money you can afford to lose. Trading Forex and CFDs may not be suitable for all investors, so please ensure that you fully understand the risks involved and seek independent advice if necessary.
Disclaimer:
The above opinions given constitute general market commentary, and do not constitute the opinion or advice of IC Markets or any form of personal or investment advice.
Any opinions, news, research, analyses, prices, other information, or links to third-party sites contained on this website are provided on an "as-is" basis, are intended only to be informative, is not an advice nor a recommendation, nor research, or a record of our trading prices, or an offer of, or solicitation for a transaction in any financial instrument and thus should not be treated as such. The information provided does not involve any specific investment objectives, financial situation and needs of any specific person who may receive it. Please be aware, that past performance is not a reliable indicator of future performance and/or results. Past Performance or Forward-looking scenarios based upon the reasonable beliefs of the third-party provider are not a guarantee of future performance. Actual results may differ materially from those anticipated in forward-looking or past performance statements. IC Markets makes no representation or warranty and assumes no liability as to the accuracy or completeness of the information provided, nor any loss arising from any investment based on a recommendation, forecast or any information supplied by any third-party.

Bullish bounce?The Cable (GBP/USD) is falling towards the pivot and could bounce to the 1st resistance which is a pullback support.
Pivot: 1.3373
1st Support: 1.3116
1st Resistance: 1.3622
Risk Warning:
Trading Forex and CFDs carries a high level of risk to your capital and you should only trade with money you can afford to lose. Trading Forex and CFDs may not be suitable for all investors, so please ensure that you fully understand the risks involved and seek independent advice if necessary.
Disclaimer:
The above opinions given constitute general market commentary, and do not constitute the opinion or advice of IC Markets or any form of personal or investment advice.
Any opinions, news, research, analyses, prices, other information, or links to third-party sites contained on this website are provided on an "as-is" basis, are intended only to be informative, is not an advice nor a recommendation, nor research, or a record of our trading prices, or an offer of, or solicitation for a transaction in any financial instrument and thus should not be treated as such. The information provided does not involve any specific investment objectives, financial situation and needs of any specific person who may receive it. Please be aware, that past performance is not a reliable indicator of future performance and/or results. Past Performance or Forward-looking scenarios based upon the reasonable beliefs of the third-party provider are not a guarantee of future performance. Actual results may differ materially from those anticipated in forward-looking or past performance statements. IC Markets makes no representation or warranty and assumes no liability as to the accuracy or completeness of the information provided, nor any loss arising from any investment based on a recommendation, forecast or any information supplied by any third-party.

Bearish drop off 50% Fibonacci resistance?The US Dollar Index (DXY) is rising towards the pivot which acts as a pullback resistance and could drop to the 1st support.
Pivot: 99..15
1st Support: 96.54
1st Resistance: 100.57
Risk Warning:
Trading Forex and CFDs carries a high level of risk to your capital and you should only trade with money you can afford to lose. Trading Forex and CFDs may not be suitable for all investors, so please ensure that you fully understand the risks involved and seek independent advice if necessary.
Disclaimer:
The above opinions given constitute general market commentary, and do not constitute the opinion or advice of IC Markets or any form of personal or investment advice.
Any opinions, news, research, analyses, prices, other information, or links to third-party sites contained on this website are provided on an "as-is" basis, are intended only to be informative, is not an advice nor a recommendation, nor research, or a record of our trading prices, or an offer of, or solicitation for a transaction in any financial instrument and thus should not be treated as such. The information provided does not involve any specific investment objectives, financial situation and needs of any specific person who may receive it. Please be aware, that past performance is not a reliable indicator of future performance and/or results. Past Performance or Forward-looking scenarios based upon the reasonable beliefs of the third-party provider are not a guarantee of future performance. Actual results may differ materially from those anticipated in forward-looking or past performance statements. IC Markets makes no representation or warranty and assumes no liability as to the accuracy or completeness of the information provided, nor any loss arising from any investment based on a recommendation, forecast or any information supplied by any third-party.

EUR/CHF Update: I just found out the next big triggerHey friends 🩵, hope you’re kicking off the week with a great vibe! It’s Skeptic from Skeptic Lab . In this video, I’m diving into EUR/CHF .
We’re stuck in a range box right now, and knowing this setup will help you miss fewer opportunities. Don’t forget money management, dodge FOMO, and have a plan for different scenarios. I also explained in the video why I personally prefer opening a short position. So, let’s get started!

GBP_NZD LOCAL SHORT|
✅GBP_NZD made a retest of the
Local horizontal resistance level of 2.2580
And as you can see the pair is already
Making a local pullback from
The level which sends a clear
Bearish signal to us therefore
We will be expecting a
Further bearish correction
SHORT🔥
✅Like and subscribe to never miss a new idea!✅
Disclosure: I am part of Trade Nation's Influencer program and receive a monthly fee for using their TradingView charts in my analysis.

GBP-USD Local Long! Buy!
Hello,Traders!
GBP-USD is about to retest
The horizontal support
Level below at 1.3383
And as this is a strong
Support level we will be
Expecting a local bullish
Rebound and a move up
Buy!
Comment and subscribe to help us grow!
Check out other forecasts below too!
Disclosure: I am part of Trade Nation's Influencer program and receive a monthly fee for using their TradingView charts in my analysis.

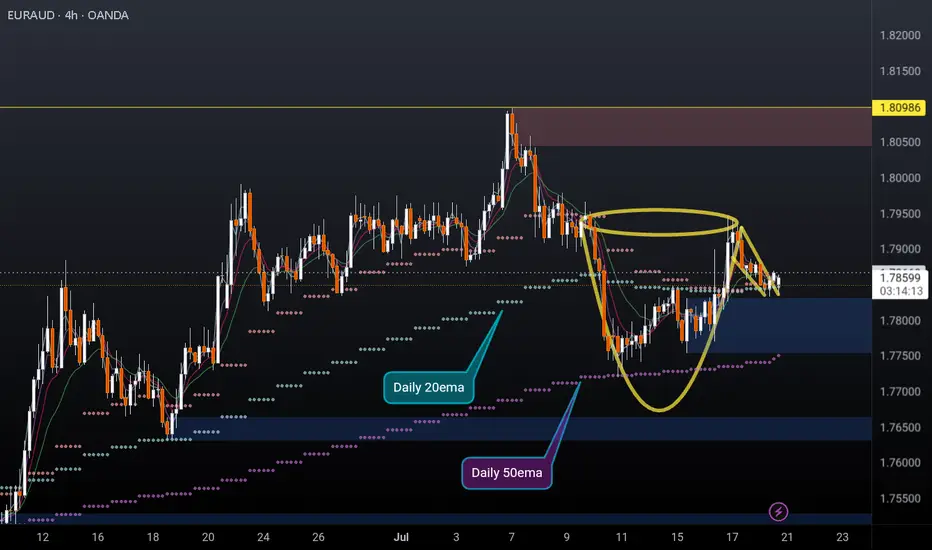
EURAUD 4H cup and handleEURAUD 4H cup and handle formed and possibly breaking out to the upside. Price recently found support off the daily 50ema (overlayed on this 4h chart) and is holding above the daily 10 & 20EMAs (overlayed).
I'm a cat not a financial advisor.
Gold. - Bullish (structure still valid) • Daily: Maintaining higher lows along the trendline. Strong support at 3,300.
• 4H: Still respecting the diagonal, and showing strength despite short-term pullbacks.
• 1H: Breakout from descending trendline and now retesting the breakout zone at 3,350.
⚠️ Watch For:
• Clean bullish break above 3,365 confirms new impulse wave toward 3,400+.
• Support at 3,335 must hold to avoid flipping neutral.
• Patience required if price consolidates between 3,340–3,360.

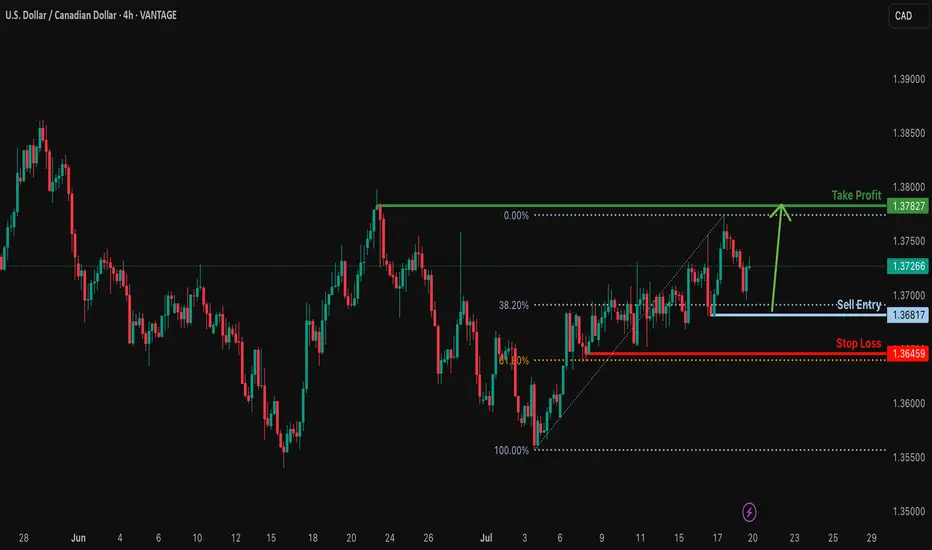
Bullish bounce off pullback support?USD/CAD is falling towards the support level which is a pullback support that lines up with the 38.2% Fibonacci retracement and could bounce from this level to our take profit.
Entry: 1.3681
Why we like it:
There is a pullback support level that aligns with the 38.2% Fibonacci retracement.
Stop loss: 1.3645
Why we like it:
There is a pullback support that lines up with the 61.8% Fibonacci retracement.
Take profit: 1.3782
Why we like it:
There is a pullback resistance.
Enjoying your TradingView experience? Review us!
Please be advised that the information presented on TradingView is provided to Vantage (‘Vantage Global Limited’, ‘we’) by a third-party provider (‘Everest Fortune Group’). Please be reminded that you are solely responsible for the trading decisions on your account. There is a very high degree of risk involved in trading. Any information and/or content is intended entirely for research, educational and informational purposes only and does not constitute investment or consultation advice or investment strategy. The information is not tailored to the investment needs of any specific person and therefore does not involve a consideration of any of the investment objectives, financial situation or needs of any viewer that may receive it. Kindly also note that past performance is not a reliable indicator of future results. Actual results may differ materially from those anticipated in forward-looking or past performance statements. We assume no liability as to the accuracy or completeness of any of the information and/or content provided herein and the Company cannot be held responsible for any omission, mistake nor for any loss or damage including without limitation to any loss of profit which may arise from reliance on any information supplied by Everest Fortune Group.
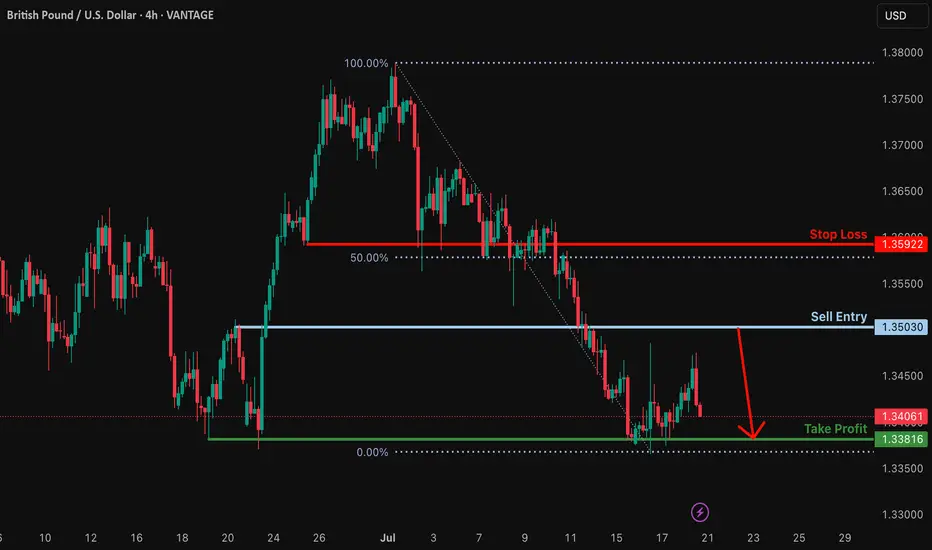
Bearish reversal off pullback resistance?GBP/USD is rising towards the resistance which is a pullback resistance and could drop from this level to our take profit.
Entry: 1.3603
Why we like it:
There is a pullback resistance level.
Stop loss: 1.3592
Why we like it:
There is a pullback resistance that is slightly above the 50% Fibonacci retracement.
Take profit: 1.3361
Why we like it:
There is a pullback support.
Enjoying your TradingView experience? Review us!
Please be advised that the information presented on TradingView is provided to Vantage (‘Vantage Global Limited’, ‘we’) by a third-party provider (‘Everest Fortune Group’). Please be reminded that you are solely responsible for the trading decisions on your account. There is a very high degree of risk involved in trading. Any information and/or content is intended entirely for research, educational and informational purposes only and does not constitute investment or consultation advice or investment strategy. The information is not tailored to the investment needs of any specific person and therefore does not involve a consideration of any of the investment objectives, financial situation or needs of any viewer that may receive it. Kindly also note that past performance is not a reliable indicator of future results. Actual results may differ materially from those anticipated in forward-looking or past performance statements. We assume no liability as to the accuracy or completeness of any of the information and/or content provided herein and the Company cannot be held responsible for any omission, mistake nor for any loss or damage including without limitation to any loss of profit which may arise from reliance on any information supplied by Everest Fortune Group.
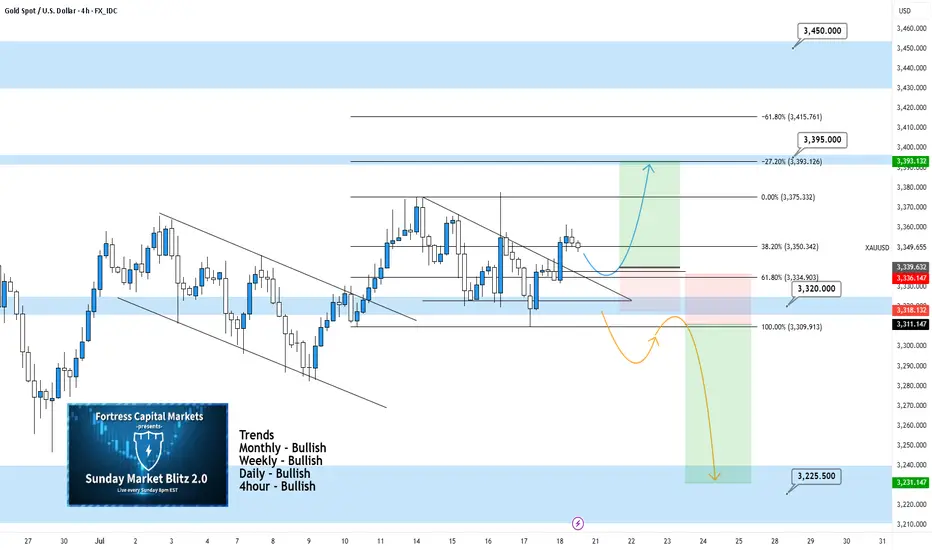
XAUUSD 4Hour TF - July 20th, 2025XAUUSD 7/20/2025
XAUUSD 4 hour Long Idea
Monthly - Bullish
Weekly - Bullish
Daily - Bullish
4hour - Bullish
GOLD,GOLD,GOLD. This thing has been bullish on all timeframes and doesn’t really show any signs of stopping just yet.
We can see two scenarios for the week ahead so let’s dive in:
Bullish continuation - Price action on gold is breaking out of a descending triangle pattern. This is a strong bullish move but for us to consider trades we want the confirmation.
Look for a retest of our 61.8% fib level and mostly recently broken structure. If we can spot bullish conviction coming off this level we can then consider targeting higher resistance levels like 3.395.000. Our -27% fib level lines up with this zone as well.
Bearish Reversal - For us to consider Gold bearish again we would need to see something very convincing. If we did see a break below 3,320.000 with a confirmed lower high I would then consider short scenarios.
Look to target toward major support levels on the way down to 3,225.000, our next monthly support zone.
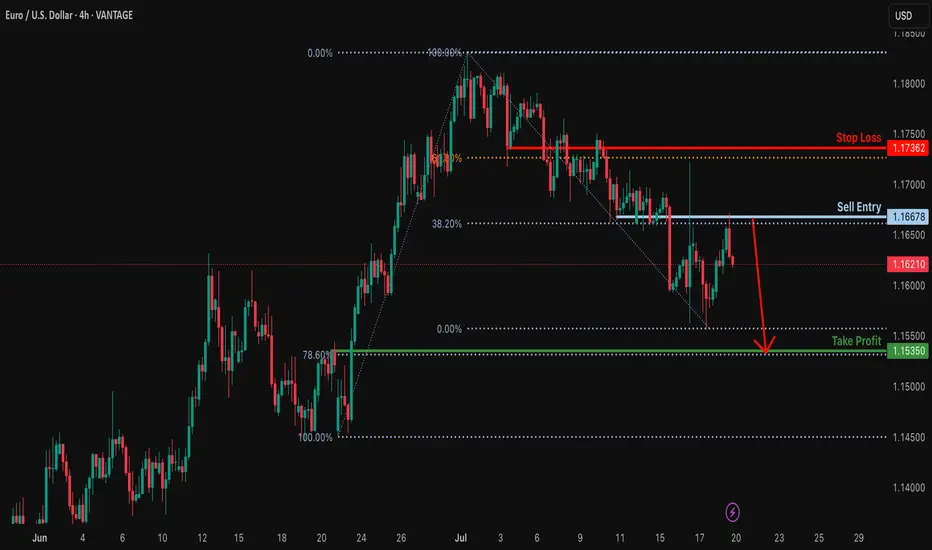
Bearish drop?EUR/USD has rejected off the resistance level which is a pullback resistance that lines up with the 38.2% Fibonacci retracement and could drop from this level to our tale profit.
Entry: 1.1667
Why we like it:
There is a pullback resistance that aligns with the 38.2% Fibonacci retracement.
Stop loss: 1.1736
Why we like it:
There is an overlap resistance that aligns with the 61.8% Fibonacci retracement.
Take profit: 1.1535
Why we like it:
There is a pullback support that lines up with the 78.6% Fibonacci retracement.
Enjoying your TradingView experience? Review us!
Please be advised that the information presented on TradingView is provided to Vantage (‘Vantage Global Limited’, ‘we’) by a third-party provider (‘Everest Fortune Group’). Please be reminded that you are solely responsible for the trading decisions on your account. There is a very high degree of risk involved in trading. Any information and/or content is intended entirely for research, educational and informational purposes only and does not constitute investment or consultation advice or investment strategy. The information is not tailored to the investment needs of any specific person and therefore does not involve a consideration of any of the investment objectives, financial situation or needs of any viewer that may receive it. Kindly also note that past performance is not a reliable indicator of future results. Actual results may differ materially from those anticipated in forward-looking or past performance statements. We assume no liability as to the accuracy or completeness of any of the information and/or content provided herein and the Company cannot be held responsible for any omission, mistake nor for any loss or damage including without limitation to any loss of profit which may arise from reliance on any information supplied by Everest Fortune Group.
EURJPY 4Hour TF - July 20th, 2025EURJPY 7/20/2025
EURJPY 4hour Bullish Idea
Monthly - Bullish
Weekly - Bullish
Daily - Bullish
4hour - Bullish
Bullish Continuation - This is the most likely scenario for EJ this week as nothing suggests anything other than Bullish activity.
EJ could take off right at market open and start pushing up without giving us a retest to enter on. If we do get some sort of retest or pullback, look for rejection as close to 172.400 as possible before looking long.
If this does execute it looks like it will be a very small window of opportunity to enter. Trade cautiously with EJ in this bullish scenario.
Bearish Reversal - This scenario is less likely but is much more favorable in my opinion.
For us to consider EJ bearish we would need to see a clear break below 172.400 with a lower high below. This would give us enough confidence to consider short scenarios and start looking lower toward major support levels like 170.750.

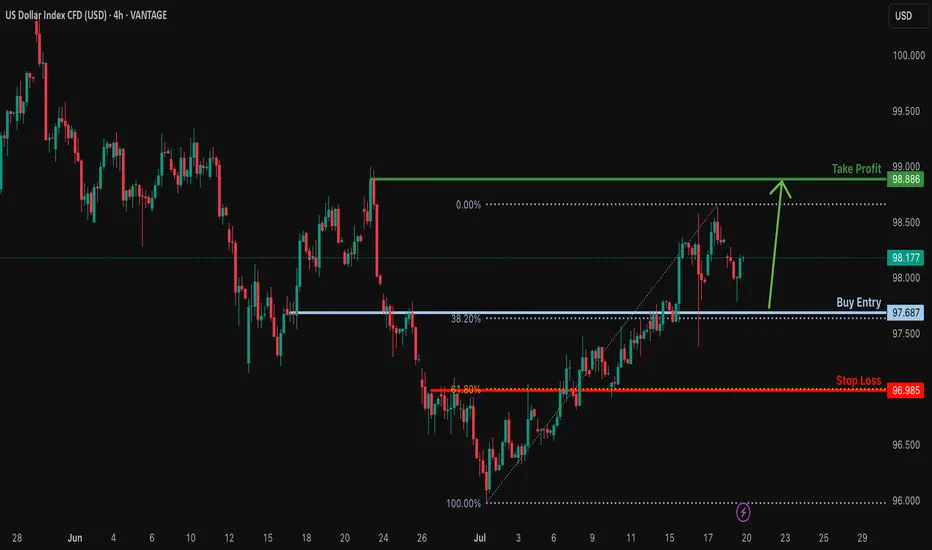
Bullish continuation for the Dollar?The price is falling towards the support level which is a pullback support that lines up with the 38.2% Fibonacci retracement and could bounce from this level to our take profit.
Entry: 97.68
Why we like it:
There is a pullback support that aligns with the 38.6% Fibonacci retracement.
Stop loss: 96.98
Why we lik eit:
There is an overlap support that aligns with the 61.8% Fibonacci retracement.
Take profit: 98.88
Why we like it:
There is a pullback resistance.
Enjoying your TradingView experience? Review us!
Please be advised that the information presented on TradingView is provided to Vantage (‘Vantage Global Limited’, ‘we’) by a third-party provider (‘Everest Fortune Group’). Please be reminded that you are solely responsible for the trading decisions on your account. There is a very high degree of risk involved in trading. Any information and/or content is intended entirely for research, educational and informational purposes only and does not constitute investment or consultation advice or investment strategy. The information is not tailored to the investment needs of any specific person and therefore does not involve a consideration of any of the investment objectives, financial situation or needs of any viewer that may receive it. Kindly also note that past performance is not a reliable indicator of future results. Actual results may differ materially from those anticipated in forward-looking or past performance statements. We assume no liability as to the accuracy or completeness of any of the information and/or content provided herein and the Company cannot be held responsible for any omission, mistake nor for any loss or damage including without limitation to any loss of profit which may arise from reliance on any information supplied by Everest Fortune Group.
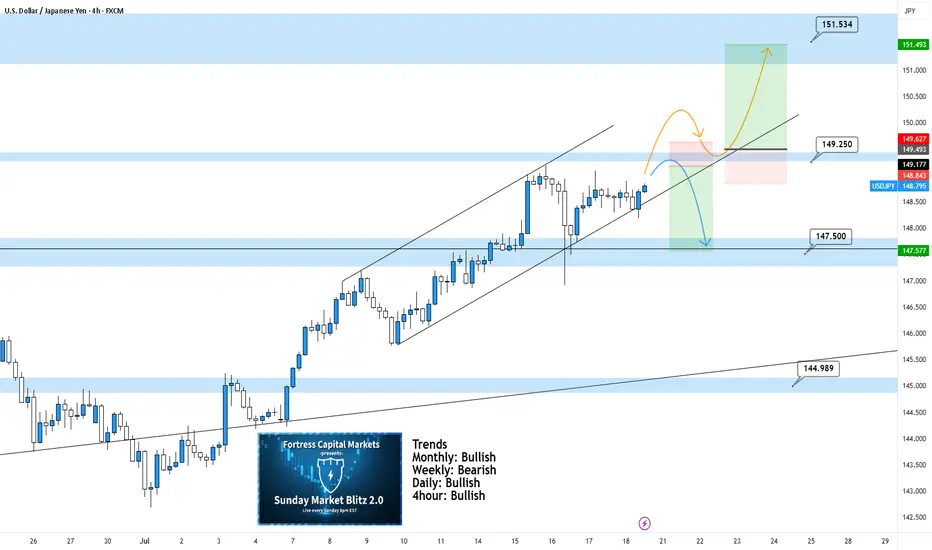
USDJPY 4Hour TF - July 20th,2025USDJPY 7/20/2025
USDJPY 4Hour Neutral Idea
Monthly - Bullish
Weekly - Bearish
Daily - Bullish
4Hour - Bullish
UJ is looking better than a couple weeks ago and at least we can spot some decent setups for the week ahead. These are NOT perfect setups but we have two scenarios that we are ready for if price action shows it is ready too. Here are the two scenarios we’re looking at for the week:
Bullish Continuation - We can see UJ in a nice 4hour channel but we are currently seeing a bit of flat price action. For us to consider UJ long setups again we would need to be convinced. Look for a break above our 149.250 zone with a confirmed higher low above. This would be enough to consider longs and target higher toward key levels of resistance.
Bearish Reversal - If price action continues to stall, this bearish setup will become more and more likely. Ideally, we want to see some strong rejection from our 149.250. If this happens look to target lower toward 147.500.
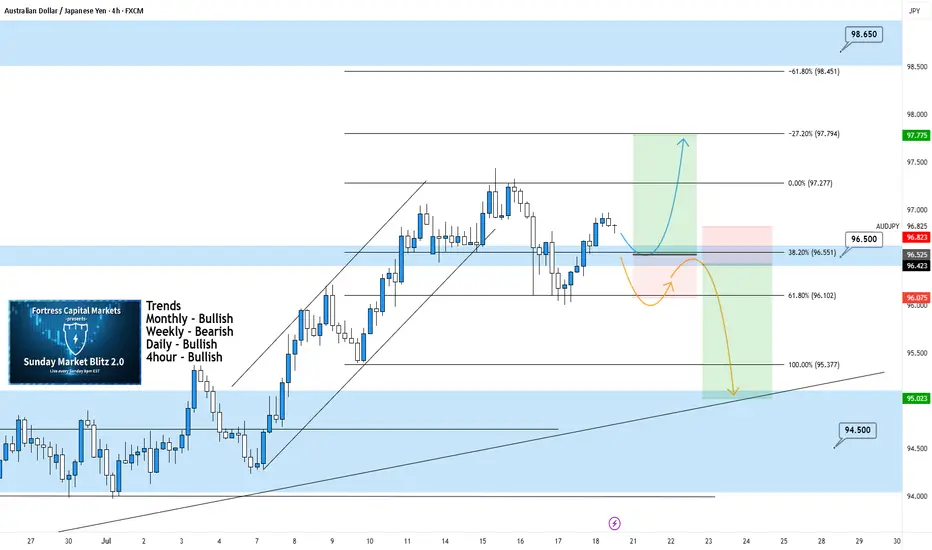
AUDJPY 4Hour TF - July 20th,2025AUDJPY 7/20/2025
AUDJPY 4hour Bullish Idea
Monthly - Bullish
Weekly - Bearish
Dailly - Bullish
4hour - Bullish
We’re looking mostly bullish on AJ going into this week but will this 96.500 hold as support? Let’s take a look at two potential scenarios for the week ahead:
Bullish Continuation - This is the most likely for AU this week according to the trends in play. For us to get confident in long scenarios, we would like to see strong bullish rejection from support around 96.500. If this happens look to target higher toward our negative fib levels and key resistance.
Bearish Reversal - For us to consider AJ bearish for the week, we would need to see some bearish pressure step in and push us below 96.500. If this happens we only need confirmation in the form of a lower high below 96.500.
Look to target lower toward major support levels like 94.500 area if this happens.
Week of 7/20/25: EURUSD AnalysisLast week's price action was bearish and has finally reached the extreme daily demand level and provided some reaction. Price has swept bulls and bears, so now we follow internal structure and wait to see where price actually wants to go. If internal 1h structure breaks bearish, we have confirmation to trade bearish until price goes deeper into the daily extreme zone.

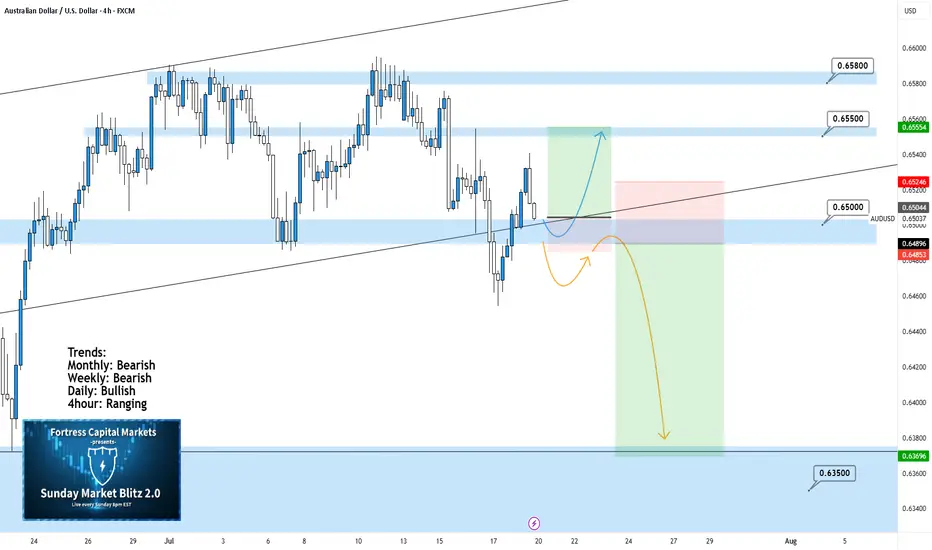
AUDUSD 4Hour TF - July 20th, 2025AUDUSD 7/20/2025
AUDUSD 4hour Neutral idea
Monthly - Bearish
Weekly - Bearish
Dailly - Bullish
4hour - Ranging
We’re looking at a fairly large range here on AU and although the higher timeframe suggests a potential bearish move, I am unsure until we have some clarity around 0.65000. Here are two scenarios that break down what could happen this week and how 0.65000 plays into it:
Range Continuation - Since late June we have seen price action establish this large range and stick to it (0.65800 Resistance & 0.65000 Support).
Currently, we can see price action attempting to break 0.65000 support but it has not done so yet. If we don’t break below 0.65000 early this week it is very likely we will see a rally into the top of the range.
Bearish Breakout - This is the setup we want to see play out this week as it presents a beauty of a trade.
For us to see AU as bearish on the 4hour we need to see a clear break below 0.65000 with a confirmed lower high below. If this happens look to target toward major support levels like 0.63500 area.