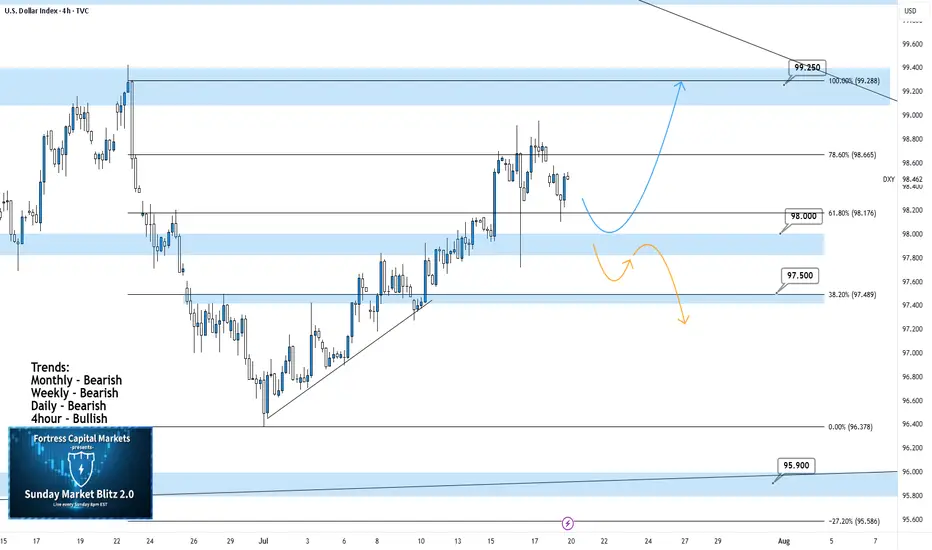
DXY 4Hour TF - July 20th, 2025DXY 7/20/2025
DXY 4hour Neutral Idea
Monthly - Bearish
Weekly - Bearish
Dailly - Bearish
4hour - Bullish
Higher timeframe trend analysis suggests that DXY is primarily bearish and is currently retracing to potential resistance.
Going into this week we are looking to see if our 98.000 zone will stay as support or transition into resistance. Here are two scenarios which highlight both a bullish and bearish outcome:
Bullish Continuation - Last week we saw a strong rally through our 98.000 zone which seems to still be holding. If this 4hour bullish trend is to continue we would like to see some sort of rejection off 98.000 support while also confirming a higher low. If this happens look to target higher toward major resistance levels like 99.250.
Bearish Reversal- If we are to consider DXY bearish again on the 4hour we would need to see a break below 98.000 support and confirm this level as new resistance.
There are a few major support levels to watch out for but DXY has the potential to fall dramatically if we see price get below 97.500.
Forex
AUD-CHF Risky Short From Falling Resistance! Sell!
Hello,Traders!
AUD-CHF is trading in a
Downtrend along the falling
Resistance line so we are
Bearish biased and after
The potential retest of the
Falling resistance we will
Be expecting a further
Bearish move down
Sell!
Comment and subscribe to help us grow!
Check out other forecasts below too!
Disclosure: I am part of Trade Nation's Influencer program and receive a monthly fee for using their TradingView charts in my analysis.

CHF-JPY Resistance Ahead! Sell!
Hello,Traders!
CHF-JPY keeps growing in
An uptrend and the pair is
Locally oversold so after the
Retest of the horizontal
Resistance of 186.000
From where we will be
Expecting a local bearish
Pullback on Monday
Sell!
Comment and subscribe to help us grow!
Check out other forecasts below too!
Disclosure: I am part of Trade Nation's Influencer program and receive a monthly fee for using their TradingView charts in my analysis.

NZD_JPY PULLBACK EXPECTED|SHORT|
✅NZD_JPY has been growing recently
And the pair seems locally overbought
So as the pair has approached
A horizontal resistance of 88.900
Price fall is to be expected
SHORT🔥
✅Like and subscribe to never miss a new idea!✅
Disclosure: I am part of Trade Nation's Influencer program and receive a monthly fee for using their TradingView charts in my analysis.

USD/JPY: The 150.00 Rejection SignalThe chart for USD/JPY looks like a simple one-way street going up. But underneath the surface, my quantitative models are in a state of conflict, and that's a high-clarity signal that something is about to change.
This isn't a signal to short right now. This is a signal to be patient and watch for a very specific setup that the "smart money" models are anticipating.
The Quant Conflict 🤖
My analysis involves several different mathematical models. Here's the situation:
One model, which is great at tracking trends, is still signaling BUY , following the obvious upward momentum.
However, two other, more complex models that analyze the relationships between economic data are now flashing a SELL signal. They are detecting underlying weakness that the price chart isn't showing yet.
When the simple trend model and the complex structural models disagree, it often means a major turning point is near. We are siding with the smarter models, but we need price action to confirm their warning.
The Game Plan 📊
We will use the 150.00 level as our "line in the sand." We are waiting for the market to fail at this level and then break down, which would confirm the bearish quant signal. This is our high-probability entry trigger.
Here is the exact setup we are waiting for:
📉 THE SETUP: A patient short position, waiting for confirmation of a breakdown.
👉 ENTRY: We enter only on a confirmed daily close below 148.00.
⛔️ STOP LOSS: Place the stop just above the psychological wall at 150.25.
🎯 TAKE PROFIT: Our primary target is the major support level at 145.00.
This is a setup where patience pays. We are letting the market do the hard work and show its hand before we commit. Let's watch this one closely.

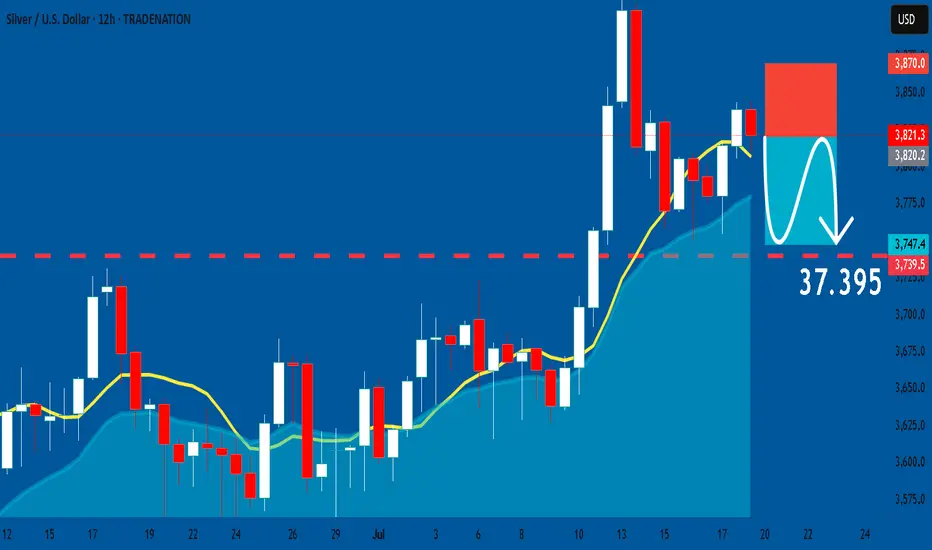
SILVER: Short Trade with Entry/SL/TP
SILVER
- Classic bearish setup
- Our team expects bearish continuation
SUGGESTED TRADE:
Swing Trade
Short SILVER
Entry Point - 38.213
Stop Loss - 38.700
Take Profit - 37.395
Our Risk - 1%
Start protection of your profits from lower levels
Disclosure: I am part of Trade Nation's Influencer program and receive a monthly fee for using their TradingView charts in my analysis.
❤️ Please, support our work with like & comment! ❤️
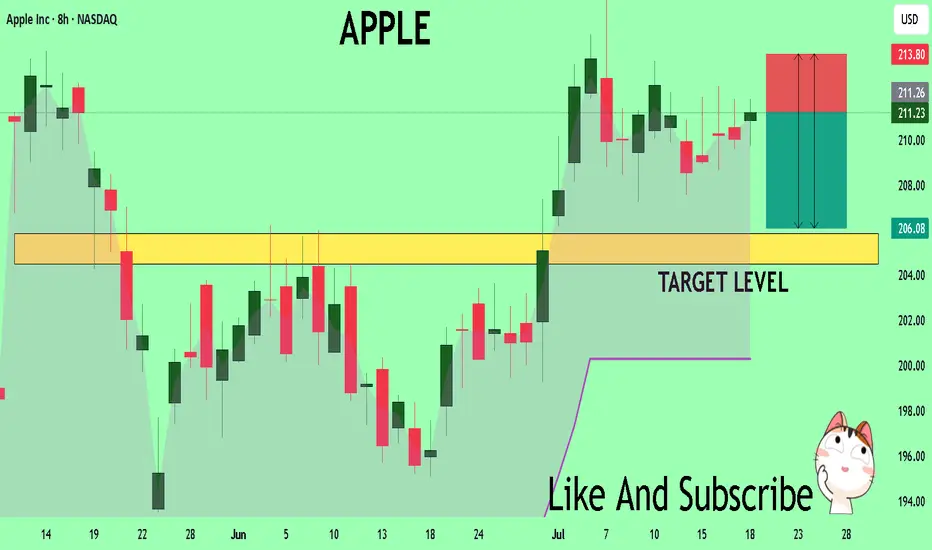
APPLE A Fall Expected! SELL!
My dear friends,
My technical analysis for APPLE is below:
The market is trading on 211.18 pivot level.
Bias - Bearish
Technical Indicators: Both Super Trend & Pivot HL indicate a highly probableBearish continuation.
Target - 205.87
Recommended Stop Loss - 213.80
About Used Indicators:
A pivot point is a technical analysis indicator, or calculations, used to determine the overall trend of the market over different time frames.
Disclosure: I am part of Trade Nation's Influencer program and receive a monthly fee for using their TradingView charts in my analysis.
———————————
WISH YOU ALL LUCK
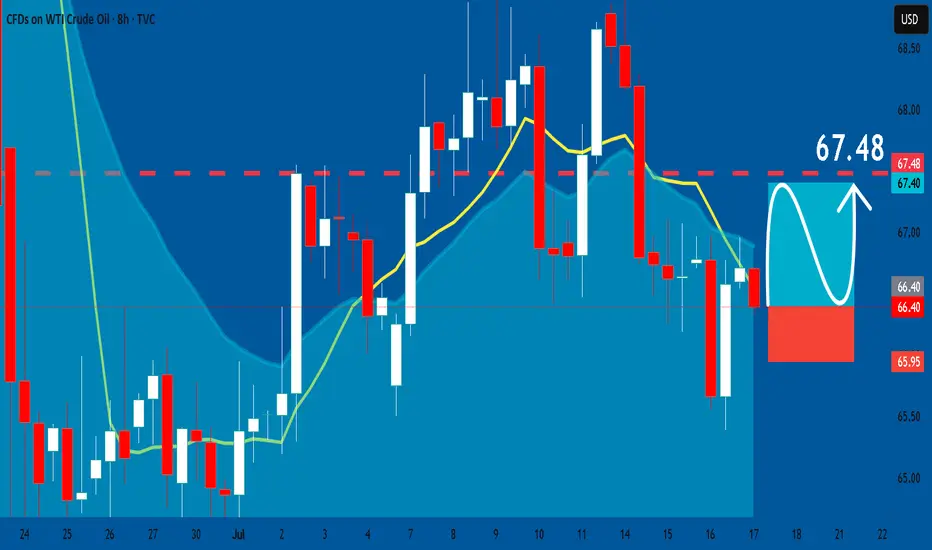
USOIL: Bullish Continuation & Long Trade
USOIL
- Classic bullish pattern
- Our team expects retracement
SUGGESTED TRADE:
Swing Trade
Buy USOIL
Entry - 66.40
Stop - 65.95
Take - 67.48
Our Risk - 1%
Start protection of your profits from lower levels
Disclosure: I am part of Trade Nation's Influencer program and receive a monthly fee for using their TradingView charts in my analysis.
❤️ Please, support our work with like & comment! ❤️
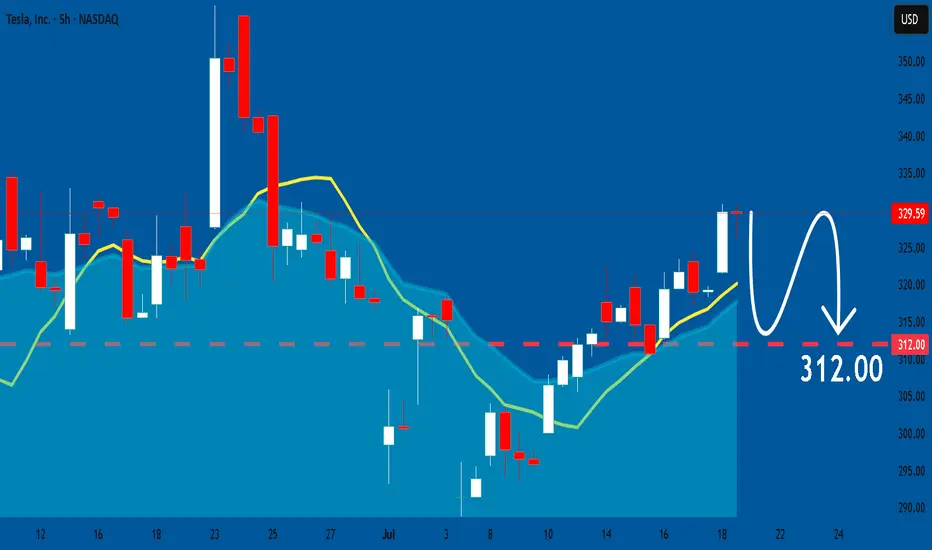
TESLA: Bearish Continuation is Expected! Here is Why:
The charts are full of distraction, disturbance and are a graveyard of fear and greed which shall not cloud our judgement on the current state of affairs in the TESLA pair price action which suggests a high likelihood of a coming move down.
Disclosure: I am part of Trade Nation's Influencer program and receive a monthly fee for using their TradingView charts in my analysis.
❤️ Please, support our work with like & comment! ❤️
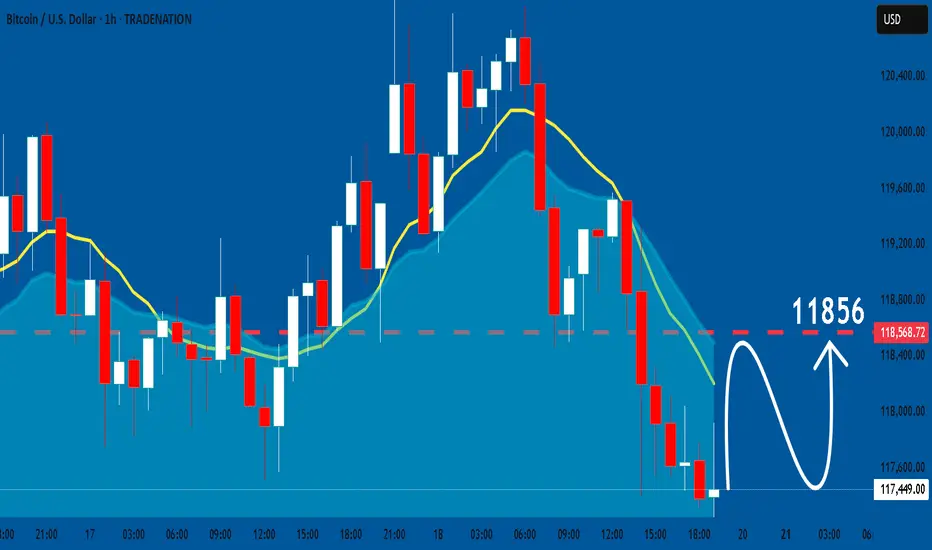
BTCUSD: Bullish Continuation
Looking at the chart of BTCUSD right now we are seeing some interesting price action on the lower timeframes. Thus a local move up seems to be quite likely.
Disclosure: I am part of Trade Nation's Influencer program and receive a monthly fee for using their TradingView charts in my analysis.
❤️ Please, support our work with like & comment! ❤️
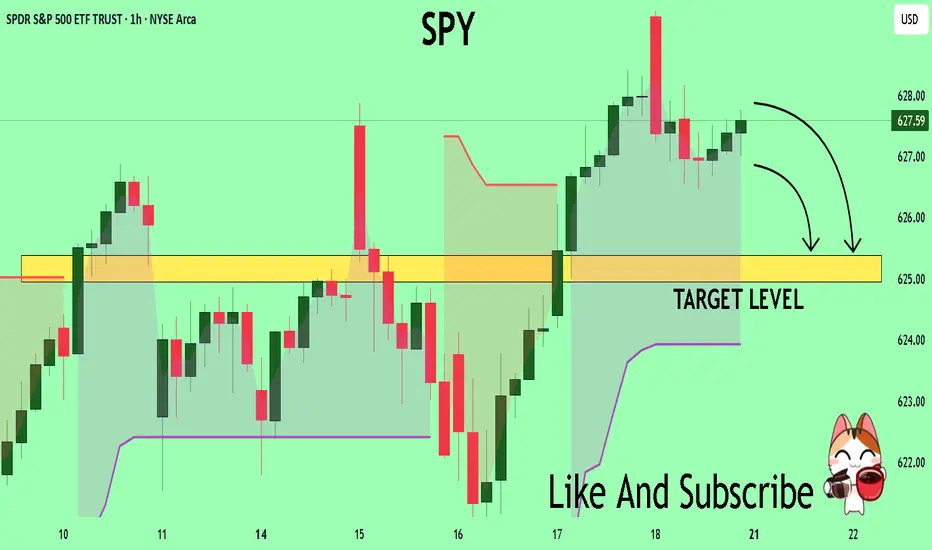
SPY What Next? SELL!
My dear friends,
Please, find my technical outlook for SPY below:
The instrument tests an important psychological level 627.59
Bias - Bearish
Technical Indicators: Supper Trend gives a precise Bearish signal, while Pivot Point HL predicts price changes and potential reversals in the market.
Target - 625.38
About Used Indicators:
Super-trend indicator is more useful in trending markets where there are clear uptrends and downtrends in price.
Disclosure: I am part of Trade Nation's Influencer program and receive a monthly fee for using their TradingView charts in my analysis.
———————————
WISH YOU ALL LUCK
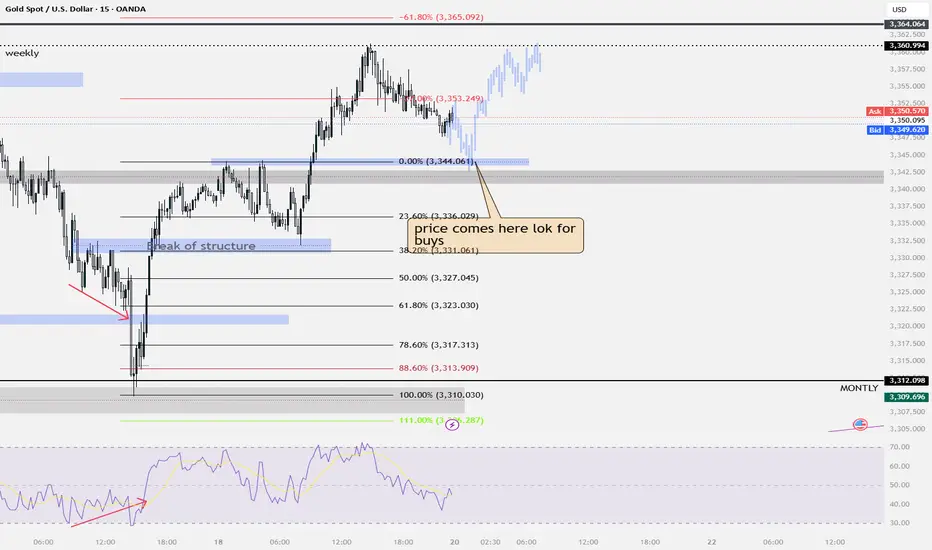
gold buysim looking for buys this week on gold price has been consolidating for the past few weeks. on friday price broke structure on the m15 structure went higher and created new highs... im im looking for a retest of the higher high
VZ: Verizon Earnings tomorrowwith 6% dividend yield and stock price at support level on the lower channel band, this draw attention to the earnings report tomorrow pre-market hours. Focused on future outlook as well.
If all good, I will buy VZ.
Disclaimer: This content is NOT a financial advise, it is for educational purpose only.

EURUSDThe Euro-Dollar has fallen to the downtrend line and reached the top of the ascending channel. We are expecting a pivot to form and reach the bottom of the ascending channel.

PEP: PepsiCo Earnings resultsIts looks like PEP is a buy now. Just want to double check on future sales growth as it is stable for a while. Lower stock price made the dividend very attractive since PEP is a defensive stock.
Disclaimer: This content is NOT a financial advise, it is for educational purpose only.

AUDUSD Potential UpsidesHey Traders, in tomorrow's trading session we are monitoring AUDUSD for a buying opportunity around 0.64200 zone, AUDUSD is trading in an uptrend and currently is in a correction phase in which it is approaching the trend at 0.64200 support and resistance area.
Trade safe, Joe.

Polish zloty in trouble: Swiss franc is sharpening its teethTechnically, CHFPLN has completed a consolidation phase within a narrowing triangle and broke to the upside. The pair is now testing the 4.60 level (the 0.618 Fibonacci retracement) from below — a decisive zone. A breakout and confirmation above this area opens the path toward 4.705, which coincides with the 0.5 Fibo level and a local resistance. A pullback from that zone back to 4.60 is possible, but this time as a support retest. If the level holds, the targets remain: 4.91 and 5.13 - both marked by Fibonacci extensions and major long-term horizontal resistance. The EMAs are aligned in support of further upside, with price consistently trading above them.
Fundamentally, the Swiss franc remains a safe-haven currency, especially amidst increasing instability in the Eurozone. Weak growth in Germany, looming ECB policy easing, and rising inflationary pressures are all tilting investor interest toward CHF. Meanwhile, Poland faces political uncertainty, budgetary debates, and volatility in the agricultural and energy sectors. All of this strengthens the case for the franc in this pair.
Tactically, the game plan is straightforward: a confirmed breakout above 4.60 signals the start of a bullish impulse. The 4.60–4.705 zone is the key area of interest for buyers. If this zone is reclaimed and held, the next targets - 4.91 and 5.13 - remain valid, where large players may look to take profits.
If this scenario plays out, the zloty may soon be tuning into Polish radio to sing nostalgic songs about the golden days of its strength.

EURUSD Analysis week 30🌐Fundamental Analysis
The USD rose after June retail sales beat expectations and initial jobless claims fell to 221,000. However, the USD's gains were limited as US stocks rebounded late in the session.
On Friday morning, US stock index futures rose 0.2%, indicating that risk sentiment remains dominant. If this trend continues, EUR/USD could hold support.
The next focus is on the Consumer Sentiment and Inflation Expectations Index data from the University of Michigan. If the data is positive, the USD could regain support and put pressure on EUR/USD.
🕯Technical Analysis
EURUSD is in a corrective downtrend towards the 1.145 support. If this support zone is broken, the EURUSD trend will turn to a Downtrend. Currently, the main trading strategy will be to look for SELL points. After price reacted at EMA and trendline and headed to temporary bottom 1.156 and hit important support soon.
📈📉Trading Signals
SELL EURUSD 1.17500-1.17700 Stoploss 1.18000
BUY EURUSD 1.14500-1.14300 Stoploss 1.14000

EURCHF Is Going Up! Buy!
Here is our detailed technical review for EURCHF.
Time Frame: 9h
Current Trend: Bullish
Sentiment: Oversold (based on 7-period RSI)
Forecast: Bullish
The market is testing a major horizontal structure 0.931.
Taking into consideration the structure & trend analysis, I believe that the market will reach 0.936 level soon.
P.S
Overbought describes a period of time where there has been a significant and consistent upward move in price over a period of time without much pullback.
Disclosure: I am part of Trade Nation's Influencer program and receive a monthly fee for using their TradingView charts in my analysis.
Like and subscribe and comment my ideas if you enjoy them!

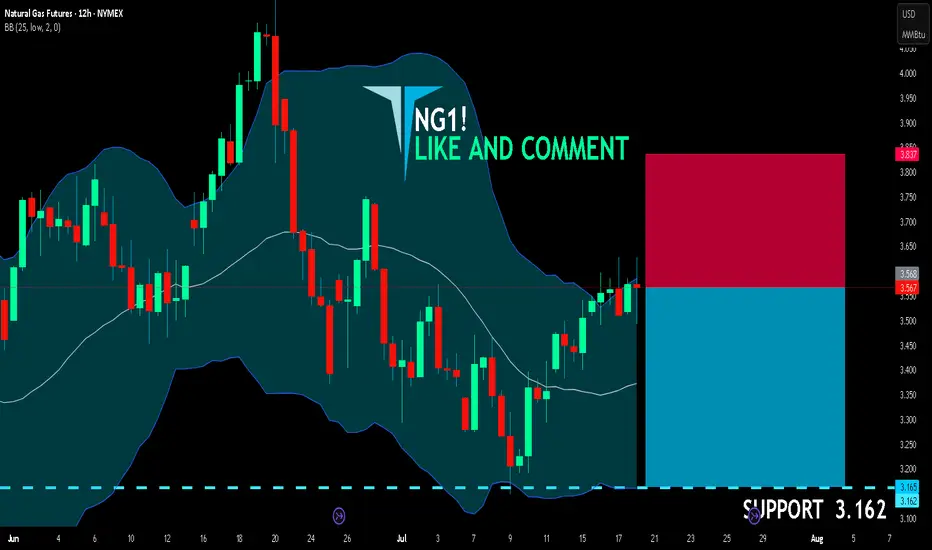
NG1! BEARS ARE STRONG HERE|SHORT
NG1! SIGNAL
Trade Direction: short
Entry Level: 3.568
Target Level: 3.162
Stop Loss: 3.837
RISK PROFILE
Risk level: medium
Suggested risk: 1%
Timeframe: 12h
Disclosure: I am part of Trade Nation's Influencer program and receive a monthly fee for using their TradingView charts in my analysis.
✅LIKE AND COMMENT MY IDEAS✅
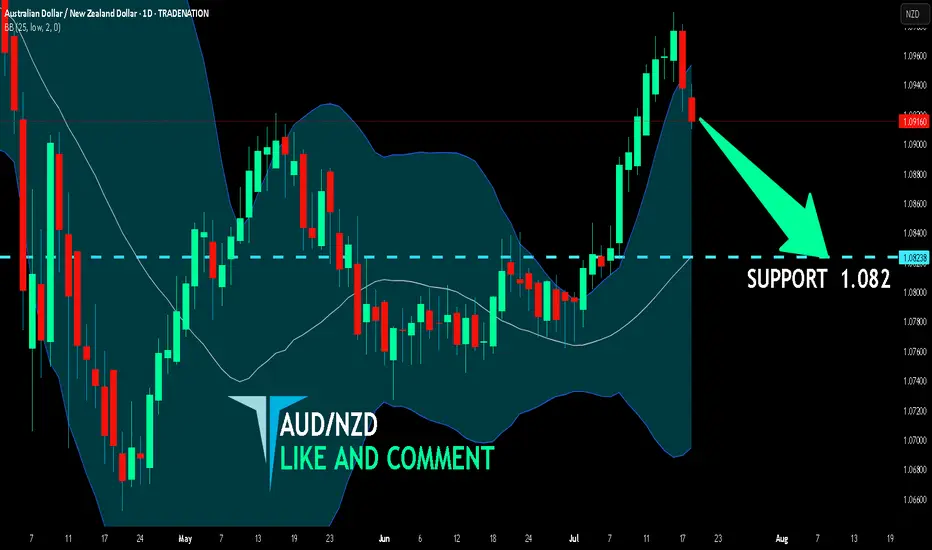
AUD/NZD SHORT FROM RESISTANCE
Hello, Friends!
The BB upper band is nearby so AUD/NZD is in the overbought territory. Thus, despite the uptrend on the 1W timeframe I think that we will see a bearish reaction from the resistance line above and a move down towards the target at around 1.082.
Disclosure: I am part of Trade Nation's Influencer program and receive a monthly fee for using their TradingView charts in my analysis.
✅LIKE AND COMMENT MY IDEAS✅
Miss This Watchlist, Miss Next Week’s OpportunitiesHey friends,it’s Skeptic 🩵 hope you’re having a great weekend!I know it’s the weekend, so a lot of you are probably chilling away from the charts, but for some, trading’s such an addiction that even weekends can’t keep you away. In this video, I’m gonna break down my weekly watchlist for you. Knowing it will help you miss fewer good opportunities, avoid FOMO, and have a plan ready for different scenarios and events.
Don’t forget money management , and stay clear of FOMO. & if it helped smash that boost bottom and follow for more !

Solana (SOL/USDT) 4H Reverse H&S PatternSolana (SOL/USDT) – 4H Market Outlook | July 1, 2025
Introduction
SOL has formed a reverse head and shoulders pattern, followed by a clean breakout above resistance. While the lower time frame is bullish, the higher time frame remains bearish, creating a short-term opportunity within a broader downtrend.
Context 1: Key Zones
Supply Zone: 176 – 187
Demand Zone: 126 – 143
Psychological Levels: 140 and 160
Context 2: Technical Structure
Pattern: Reverse Head & Shoulders
Breakout: Confirmed above neckline/resistance
FVGs:
One below price (within demand)
One above price (potential target)
Golden Pocket: Sits just above lower FVG and inside demand — strong confluence support
Context 3: Volume Insight
OBV Indicator: Shows a sudden volume spike, adding strength to the breakout and the bullish pattern confirmation.
Bullish Scenario
Price pulls back into the golden pocket + FVG + demand zone
Finds support → bounces to form higher low
Second leg of the move breaks swing high → targets upper FVG and 160 psychological level
Bearish Scenario
Price breaks back below demand zone and invalidates the golden pocket
Fails to hold structure → reverts to macro bearish trend
Potential retest of previous swing low below 126
Summary
SOL is showing bullish momentum on the 4H after completing a reversal pattern and spiking in volume. A pullback into the demand zone confluence may offer a strong long setup — but failure to hold could revalidate the higher timeframe downtrend.
