EUR_AUD WILL GO UP|LONG|
✅EUR_AUD is trading in an uptrend
And the bullish bias is confirmed
By the rebound we are seeing
After the pair retested the support
So I think the growth will continue
LONG🚀
✅Like and subscribe to never miss a new idea!✅
Disclosure: I am part of Trade Nation's Influencer program and receive a monthly fee for using their TradingView charts in my analysis.
Forex

GOLD UPDATE Hello friends🙌
📉Regarding the decline we had, which we also analyzed for you and said that the price is falling...
✔Now, with the support hunt identified, you can see that the price has returned strongly and broken the identified resistance and managed to reach higher ceilings, which also created a QM pattern, which increases the likelihood of the upward trend continuing.
Now with capital and risk management you can move towards your specified goals.
🔥Follow us for more signals🔥
*Trade safely with us*

GBP/NZD: The Great Liquidity Grab? (Long Trade Plan)"🏦💰 GBP/NZD BANK VAULT RAID: Bullish Heist in Progress! (Long Setup) 💰🏦
🚨 Overbought Trap? Or Trend Continuation? Here’s How to Loot Pips Safely! 🚨
🦸♂️ GREETINGS, MARKET MARAUDERS!
To all the Profit Pirates & Risk-Takers! 🌍💸
Using our 🔥Thief Trading Tactics🔥 (a ruthless combo of price action + liquidity grabs + macro triggers), we’re executing a bullish heist on GBP/NZD ("Sterling vs Kiwi")—this is not advice, just a strategic raid blueprint for those who trade like outlaws.
📈 THE HEIST PLAN (LONG ENTRY FOCUS)
🎯 Profit Zone: 2.28700 (or escape earlier if momentum stalls)
💥 High-Stakes Play: Overbought but squeezing higher—trap for bears.
🕵️♂️ Trap Spot: Where sellers get liquidated.
🔑 ENTRY RULES:
"The Vault’s Open!" – Swipe bullish loot on pullbacks (15-30min TF).
Buy Limit Orders near swing lows for better risk/reward.
Aggressive? Enter at market—but tighter stops.
📌 SET ALERTS! Don’t miss the breakout retest.
🛑 STOP LOSS (Escape Route):
Thief SL at recent swing low (2H timeframe).
⚠️ Warning: "Ignore this SL? Enjoy donating to the market."
🎯 TARGETS:
Main Take-Profit: 2.28700 (or trail partials).
Scalpers: Ride long waves only. Trailing SL = VIP exit pass.
📡 FUNDAMENTAL BACKUP (Why This Heist Works)
Before raiding, check:
✅ COT Data (Are funds long GBP/short NZD?)
✅ Rate Spreads (GBP vs NZD yield shifts)
✅ Commodity Correlations (Dairy prices? Risk mood?)
✅ Sentiment Extreme (Retail over-shorting?)
🚨 NEWS RISK ALERT
Avoid new trades during RBNZ/BOE speeches (unless you like volatility casinos).
Trailing stops = your bulletproof vest.
💣 BOOST THIS HEIST!
👍 Smash Like to fuel our next raid!
🔁 Share to recruit more trading bandits!
🤑 See you at the target, rebels!
⚖️ DISCLAIMER: Hypothetical scenario. Trade at your own risk.
#Forex #GBPNZD #TradingView #LiquidityGrab #TrendContinuation #ThiefTrading
💬 COMMENT: "Long already—or waiting for a deeper pullback?" 👇🔥

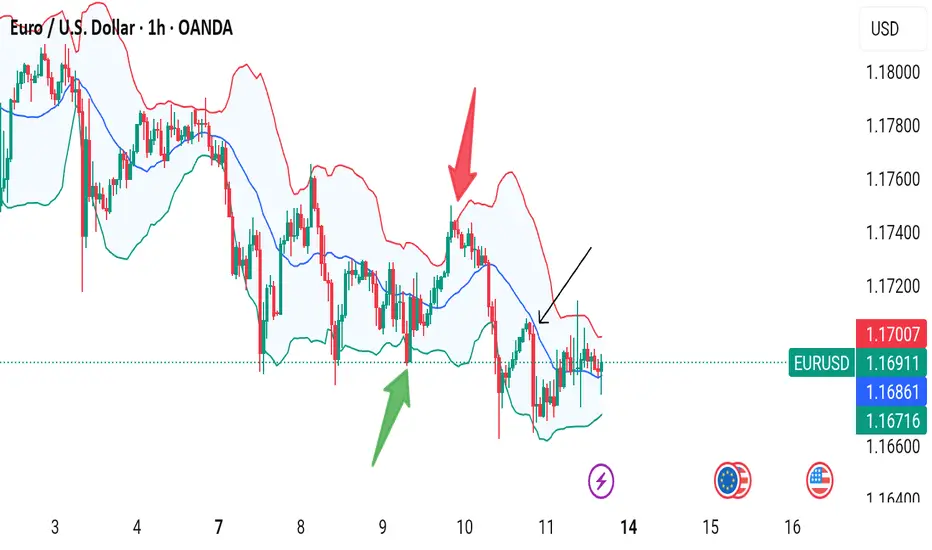
EURUSD: Long Signal with Entry/SL/TP
EURUSD
- Classic bullish formation
- Our team expects pullback
SUGGESTED TRADE:
Swing Trade
Long EURUSD
Entry - 1.1689
Sl - 1.1627
Tp - 1.1799
Our Risk - 1%
Start protection of your profits from lower levels
Disclosure: I am part of Trade Nation's Influencer program and receive a monthly fee for using their TradingView charts in my analysis.
❤️ Please, support our work with like & comment! ❤️

What Are Bollinger Bands? How to use it.✅ What Are Bollinger Bands?
Bollinger Bands are a volatility-based technical analysis tool developed by John Bollinger. They consist of three lines:
1. Middle Band: 20-period Simple Moving Average (SMA)
2. Upper Band: Middle Band + 2 standard deviations
3. Lower Band: Middle Band - 2 standard deviations
The bands expand and contract based on price volatility.
📊 What Bollinger Bands Tell You
Contraction (Squeeze): Low volatility, possible breakout coming
Expansion: High volatility, breakout in progress or exhausted
Price Touches Band: Doesn’t mean reversal—it's a sign of strength or weakness
🎯 Mastering Strategies with Bollinger Bands
1. Bollinger Band Squeeze (Breakout Strategy)
Setup: Bands are very close together (low volatility)
Signal: Wait for breakout and volume spike
Action: Enter in direction of breakout
Tip: Combine with MACD or RSI for confirmation
> 🔍 Example: If the price breaks above the upper band with strong volume after a squeeze → potential long entry.
2. Mean Reversion (Reversal Strategy)
Setup: Price touches or exceeds upper/lower band
Signal: Look for RSI divergence, candlestick reversal patterns
Action: Fade the move back to the 20 SMA (mean reversion)
Tip: Works best in ranging markets
> ⚠️ Warning: Don’t short just because price touches the upper band. Look for confluence.
3. Trend Riding with Bands
Setup: Price rides upper/lower band
Signal: Pullbacks to the 20 SMA in a strong trend
Action: Enter on bounce near SMA if the trend is strong
Tip: Use higher timeframes to confirm the trend
> 🟢 In an uptrend, buy near the 20 SMA when price pulls back but doesn’t break lower band.
📌 Key Tips for Mastery
1. Adjust settings for asset/timeframe (e.g., crypto might need a 10 or 14 SMA)
2. Never use Bollinger Bands alone – combine with:
RSI (for overbought/oversold confirmation)
MACD (trend confirmation)
Volume (for breakout confirmation)
3. Use multiple timeframes – e.g., 4H for trend, 15m for entry
4. Avoid chasing band breakouts without confirmation
5. Backtest strategies with your preferred asset
🧠 Advanced Concepts
Double Bottoms Outside Band: When price forms a W-bottom with the second low outside the lower band bullish reversal setup.
Walking the Band: In strong trends, price can "walk" along the band don’t fade too early.
Band Width: Track the width of bands to detect upcoming breakouts.
⚠️ Disclaimer
This guide is for educational purposes only and does not constitute financial advice. Trading involves risk, and past performance does not guarantee future results. Always do your own research (DYOR) and consult with a financial advisor before making any investment decisions.
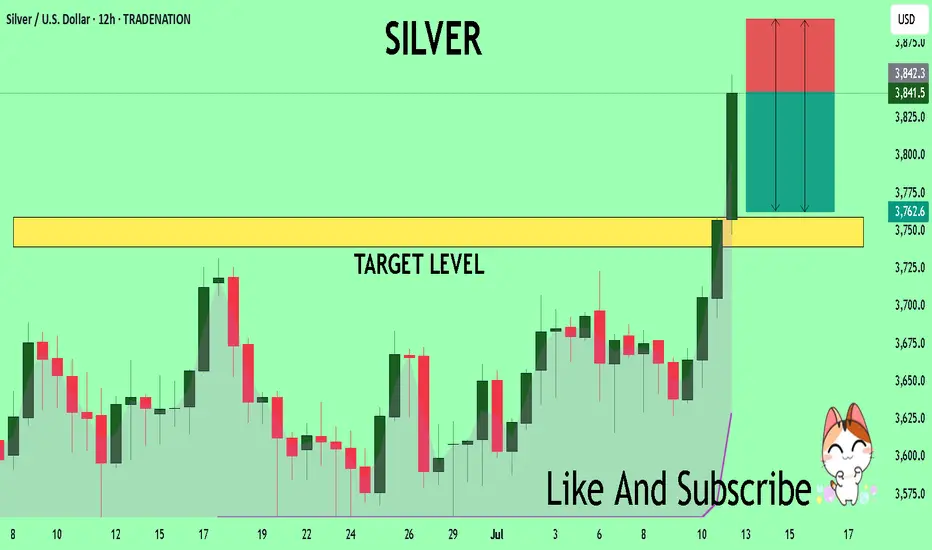
SILVER Trading Opportunity! SELL!
My dear subscribers,
My technical analysis for SILVER is below:
The price is coiling around a solid key level - 38.415
Bias - Bearish
Technical Indicators: Pivot Points High anticipates a potential price reversal.
Super trend shows a clear sell, giving a perfect indicators' convergence.
Goal - 37.591
My Stop Loss - 38.905
About Used Indicators:
By the very nature of the supertrend indicator, it offers firm support and resistance levels for traders to enter and exit trades. Additionally, it also provides signals for setting stop losses
Disclosure: I am part of Trade Nation's Influencer program and receive a monthly fee for using their TradingView charts in my analysis.
———————————
WISH YOU ALL LUCK
USOIL: Bearish Continuation & Short Trade
USOIL
- Classic bearish setup
- Our team expects bearish continuation
SUGGESTED TRADE:
Swing Trade
Short USOI
Entry Point - 68.66
Stop Loss - 69.40
Take Profit - 67.23
Our Risk - 1%
Start protection of your profits from lower levels
Disclosure: I am part of Trade Nation's Influencer program and receive a monthly fee for using their TradingView charts in my analysis.
❤️ Please, support our work with like & comment! ❤️

AUDCAD: Forecast & Technical Analysis
Balance of buyers and sellers on the AUDCAD pair, that is best felt when all the timeframes are analyzed properly is shifting in favor of the sellers, therefore is it only natural that we go short on the pair.
Disclosure: I am part of Trade Nation's Influencer program and receive a monthly fee for using their TradingView charts in my analysis.
❤️ Please, support our work with like & comment! ❤️

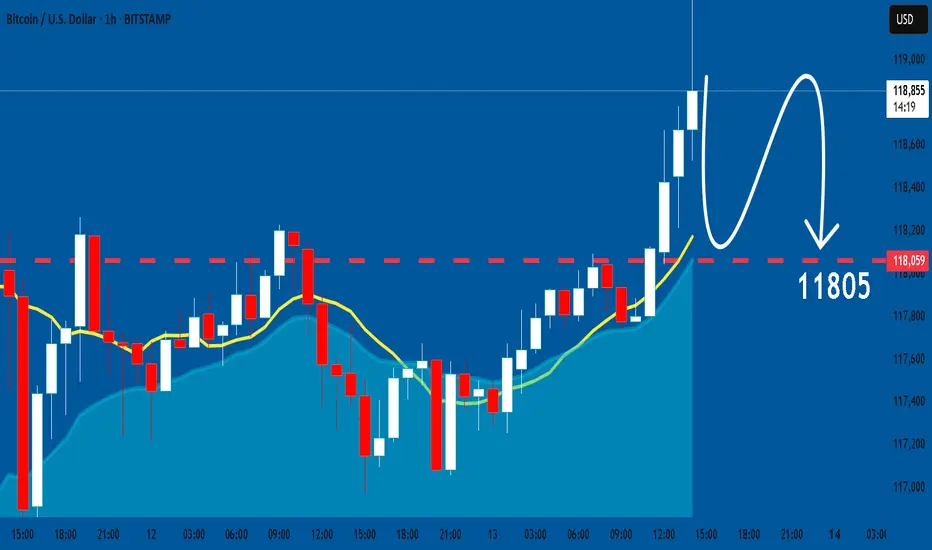
BTCUSD: Bearish Continuation
The charts are full of distraction, disturbance and are a graveyard of fear and greed which shall not cloud our judgement on the current state of affairs in the BTCUSD pair price action which suggests a high likelihood of a coming move down.
Disclosure: I am part of Trade Nation's Influencer program and receive a monthly fee for using their TradingView charts in my analysis.
❤️ Please, support our work with like & comment! ❤️
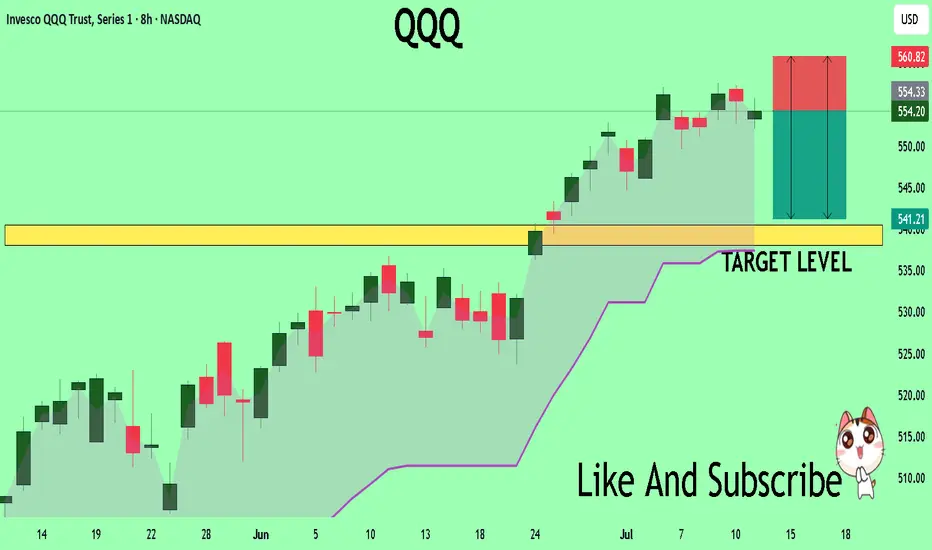
QQQ What Next? SELL!
My dear followers,
I analysed this chart on QQQ and concluded the following:
The market is trading on 554.20 pivot level.
Bias - Bearish
Technical Indicators: Both Super Trend & Pivot HL indicate a highly probable Bearish continuation.
Target - 540.50
Safe Stop Loss - 560.82
About Used Indicators:
A super-trend indicator is plotted on either above or below the closing price to signal a buy or sell. The indicator changes color, based on whether or not you should be buying. If the super-trend indicator moves below the closing price, the indicator turns green, and it signals an entry point or points to buy.
Disclosure: I am part of Trade Nation's Influencer program and receive a monthly fee for using their TradingView charts in my analysis.
———————————
WISH YOU ALL LUCK
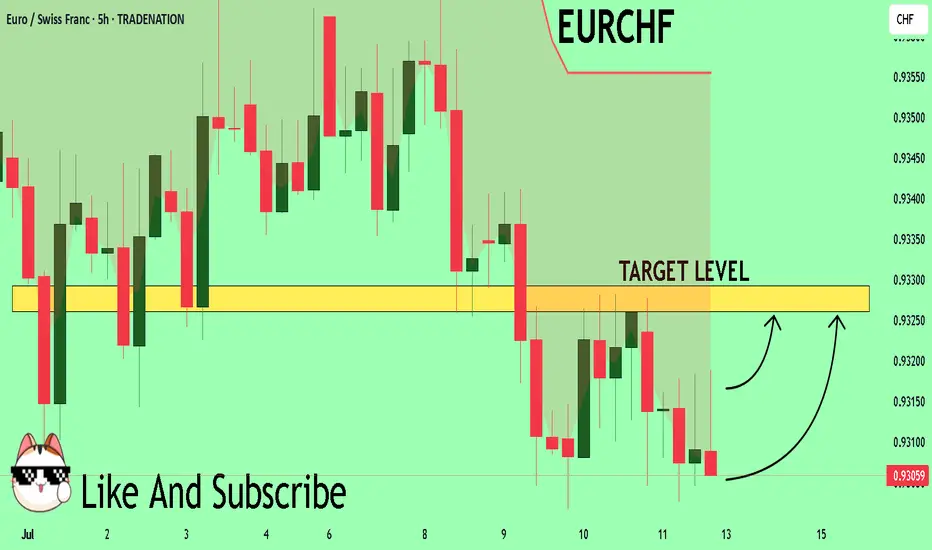
EURCHF On The Rise! BUY!
My dear subscribers,
This is my opinion on the EURCHF next move:
The instrument tests an important psychological level 0.9305
Bias - Bullish
Technical Indicators: Supper Trend gives a precise Bullish signal, while Pivot Point HL predicts price changes and potential reversals in the market.
Target - 0.9326
About Used Indicators:
On the subsequent day, trading above the pivot point is thought to indicate ongoing bullish sentiment, while trading below the pivot point indicates bearish sentiment.
Disclosure: I am part of Trade Nation's Influencer program and receive a monthly fee for using their TradingView charts in my analysis.
———————————
WISH YOU ALL LUCK
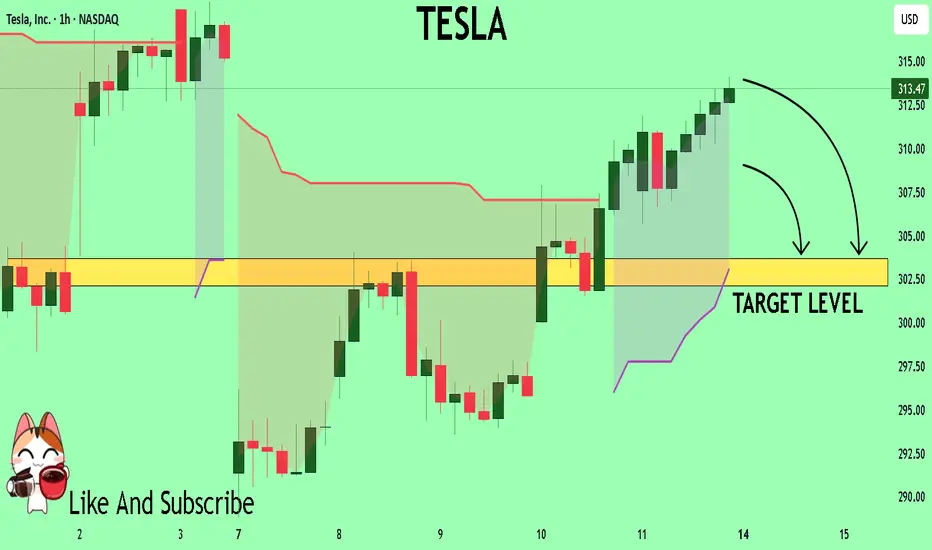
TESLA My Opinion! SELL!
My dear friends,
Please, find my technical outlook for TESLA below:
The price is coiling around a solid key level - 313.47
Bias - Bearish
Technical Indicators: Pivot Points Low anticipates a potential price reversal.
Super trend shows a clear sell, giving a perfect indicators' convergence.
Goal - 303.67
About Used Indicators:
The pivot point itself is simply the average of the high, low and closing prices from the previous trading day.
Disclosure: I am part of Trade Nation's Influencer program and receive a monthly fee for using their TradingView charts in my analysis.
———————————
WISH YOU ALL LUCK
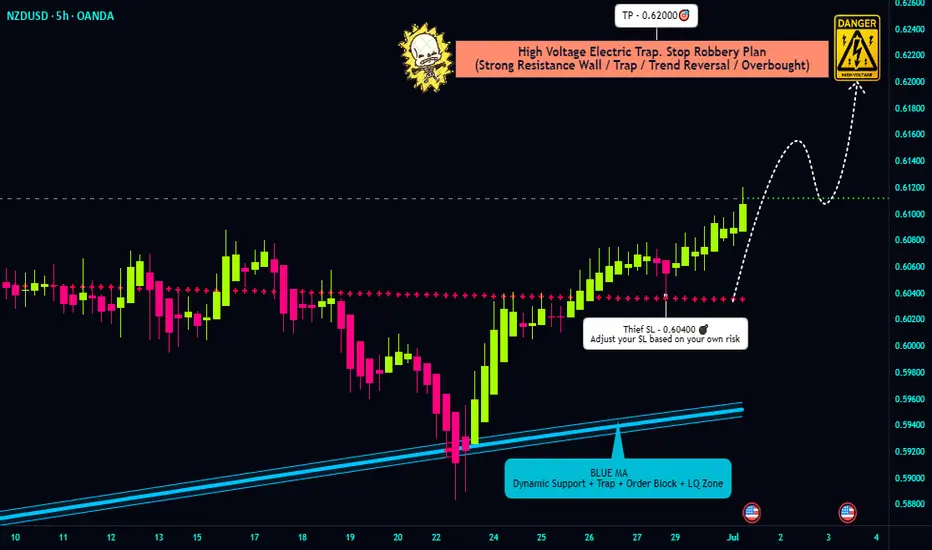
"NZD/USD Bullish Heist! Steal Pips Before the Reversal Trap! 🏴☠️ NZD/USD Kiwi Heist Masterplan – Steal the Bull Run! 💰
🌟 Hola, Money Makers & Market Marauders! 🌟
Welcome to the Thief Trading Style raid on the NZD/USD "The Kiwi" Forex vault. Follow the blueprint sketched in the chart for a bold long takeover — escape the high‑risk Yellow MA Zone before guards tighten!
🎯 Heist Blueprint
1. Entry 🚀
"The vault swings wide—yank that Bull loot at any price!"
Drop your buy-limit orders within the next 15–30 min (or at the latest swing low/high). Don’t sleep—set chart alerts for the perfect breach.
2. Stop‑Loss 🛑
Thief-style SL lurks at the nearest 5h swing‑low wick (≈ 0.60400) for intra‑day.
Adjust your SL based on your risk appetite, position size, and combo of orders.
3. Target 🎯
Aim to escape by 0.62000, or bail early for safety.
4. Scalpers’ Edge 🔍
Only rob on the long side. Big bankroll? Go all‑in. Prefer safety? Slide into the swing crew with a trailing SL to lock in your spoils.
🔍 Market Intel
Why the Kiwi Loot is Ripe:
Bullish momentum marches on, fueled by macroeconomic clues, COT data, sentiment shifts, inter-market moves — all pointing upward.
📚 For Full Recon:
Dive into the fundamental, macro, COT, quant, sentiment & intermarket intel — plus trend targets and scorecards. Check the data here 👉🔗🔗
⚠️ Caution Zone
News Watch & Position Safety:
Major news = guarded vault. Don't open new trades during release windows.
If you're in already, use trailing stops to shield your haul and lock in gains.
💪 Support the Crew
Smash that “Boost” to fuel our team and keep the raid running smooth. With Thief Trading Style, every day’s a payday.
🗓️ Stay tuned for the next Kiwi Heist – we’re just getting started. Happy robbing, legends! 🐱👤💥
GOLD MARKET ANALYSIS AND COMMENTARY - [Jul 14 - Jul 18]This week, OANDA:XAUUSD opened at $3,342/oz, dropped to $3,282/oz, but then rebounded sharply to close at $3,355/oz. The recovery was mainly driven by former President Trump's announcement of new tariffs ranging from 20% to 50% on imports from 22 countries, effective August 1st. Particularly, a 35% tariff on Canadian goods — a key U.S. trading partner — raised concerns about global trade stability and supply chains.
Trump also proposed 15–20% tariffs on most other trading partners, reigniting fears of global trade disruptions. At the same time, ongoing conflict between Israel and Hamas continued to weigh on sentiment, despite U.S. diplomatic efforts showing little progress.
However, analysts note that gold still lacks strong momentum for a breakout. Trump's tariff threats may be more about negotiation leverage than triggering a full-blown trade war. Meanwhile, with the labor market recovering and inflation rising, the Fed is expected to maintain its neutral monetary policy, limiting short-term gold price movements.
Although geopolitical tensions remain (e.g., Russia-Ukraine, Israel-Hamas), the ceasefire between Israel and Iran has reduced gold’s geopolitical risk premium.
Looking ahead, key U.S. economic data next week — including CPI, PPI, and retail sales — will be closely watched. A strong June core CPI (0.4% or higher) could reduce the likelihood of a Fed rate cut in September, strengthening the USD and pushing gold lower. Conversely, weaker inflation data could boost expectations of a rate cut, supporting gold prices.
📌In terms of technical analysis, gold prices next week may continue to adjust and accumulate. Accordingly, if they surpass the 3,370 USD/oz mark, gold prices next week will challenge the 3,400-3,450 USD/oz range. On the contrary, gold prices next week will adjust down to 3,285 USD/oz, or even 3,245 USD/oz.
Notable technical levels are listed below.
Support: 3,350 – 3,310 – 3,300USD
Resistance: 3,371 – 3,400 – 3,430USD
SELL XAUUSD PRICE 3435 - 3433⚡️
↠↠ Stop Loss 3439
BUY XAUUSD PRICE 3329 - 3331⚡️
↠↠ Stop Loss 3326

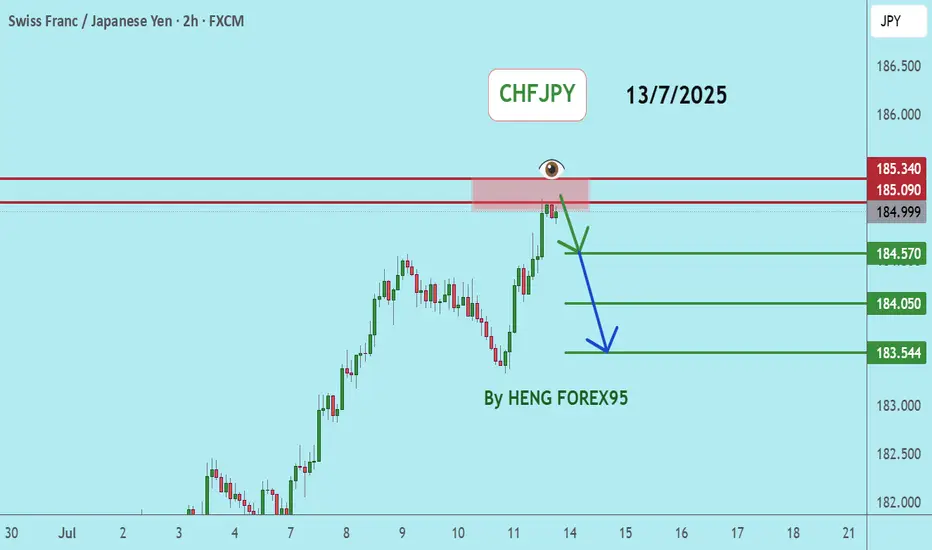
CHFJPYCHFJPY price is in a very bullish trend. At the current price, there may be short-term selling. Therefore, if the price cannot break through 185.34, it is expected that the price will drop. Consider selling the red zone.
🔥Trading futures, forex, CFDs and stocks carries a risk of loss.
Please consider carefully whether such trading is suitable for you.
>>GooD Luck 😊
❤️ Like and subscribe to never miss a new idea!
(2-hour timeframe for WTI Crude Oil (USOIL).(2-hour timeframe for WTI Crude Oil (USOIL)), here’s the technical analysis and target zones:
🟦 Key Observations:
Price is trading in an ascending channel.
I'm using the Ichimoku Cloud for trend confirmation.
There are two clear target zones marked with arrows.
---
🎯 Target Levels (as shown on chart):
1. First Target Zone: ~$74.50
This is the intermediate resistance level.
Price is expected to break above ~$69, then head toward this zone.
2. Final Target Zone: ~$76.50–77.00
This is the major resistance area, possibly the upper end of a swing move.
Could be reached if momentum remains strong and no major reversal occurs.
---
📌 Current Price:
$68.66 (Sell) / $68.76 (Buy) — as of the screenshot.
📈 Suggested Strategy (based on the chart setup):
Entry: On breakout above ~$69.00 with volume confirmation.
First TP: ~$74.50
Second TP: ~$76.50–77.00
Stop-Loss: Below the lower channel support (~$66 or tighter, depending on your risk tolerance).

Ethereum (ETH/USD) on the 2-hour timeframe.Ethereum (ETH/USD) on the 2-hour timeframe, here's the analysis and target level:
---
🟦 Chart Observations:
ETH is in a rising channel.
Price is respecting Ichimoku Cloud support.
A bullish breakout pattern is forming (consolidation above the cloud).
My clearly marked "TARGET 3300" at the top.
---
🎯 Target Level:
Primary Target: $3,300
This is the next major resistance and aligns with the top of the projected ascending channel.
Confirmed by your chart annotation.
---
📍 Current Price:
$2,964.3 (Sell) / $2,964.5 (Buy) — as shown in the screenshot.
---
📈 Strategy Suggestion:
Entry: On break above local consolidation / wedge (~$2,980–3,000).
Target: $3,300
Stop-Loss: Below Ichimoku cloud or lower channel (~$2,850 or tighter).
Support Levels to watch:
$2,815 (highlighted on the chart)
$2,700 (lower channel zone)
---
Would you like me to prepare a full trade plan or backtest this setup?

EURO - Price will rise a little and then drop to $1.1500 pointsHi guys, this is my overview for EURUSD, feel free to check it and write your feedback in comments👊
Price earlier carved out a pennant pattern after a strong rally, with price oscillating between converging trendlines and indecision mounting near $1.1550 resistance.
After several weeks in consolidation, sellers finally broke down below the pennant base, sending price back toward the support area and trapping late buyers.
Buyers regrouped and launched a new advance, driving EUR into a well-defined rising channel.
During this channel run, two notable breakouts above interim highs were quickly followed by exits at the upper trendline.
Price now sits in a tight consolidation just under the rising channel’s ceiling near $1.1700, forming small corrective swings on lighter volume.
I expect one more shallow rally toward $1.1750 before sellers overwhelm buyers again, pushing Euro down through $1.1550 and toward the $1.1500 points.
If this post is useful to you, you can support me with like/boost and advice in comments❤️
Disclaimer: As part of ThinkMarkets’ Influencer Program, I am sponsored to share and publish their charts in my analysis.

GBPJPY: floating at the top – is a drop being loaded?GBPJPY is hovering around 198.91 after an impressive rally, but now it's trapped between two key zones: 199.85 – a resistance level that keeps rejecting price, and 198.20 – a fragile support below. The price action reveals a tense sideways pattern, like a spring coiling up before release.
What’s concerning is that buyers have attempted to break above the high multiple times and failed – and each failure comes with weaker rebounds. With the Bank of England shifting toward a “pause” stance and the yen gaining mild support from rising risk-off sentiment, the market is starting to lean toward a correction.
If price breaks below 198.20, it could mark the beginning of a deeper slide back toward the lower boundary of the channel. Don’t be fooled by the silence – sometimes, calm is the precursor to a sharp fall.

AUDUSD holds bullish structureAUDUSD is currently trading around 0.6576, maintaining a clear uptrend with higher lows and strong respect for the ascending trendline. A consolidation pattern is forming just below the key resistance zone at 0.6600–0.6617, suggesting a potential breakout if price stays above the support at 0.6546.
On the news front, the Australian dollar is supported by expectations that the RBA will keep interest rates high, while the USD is under slight pressure following weaker U.S. job data this week. Additionally, improving consumer data from China – Australia’s major trading partner – is further boosting AUD sentiment.
If the price breaks above 0.6617, AUDUSD could extend its rally into next week. Buyers are in control – have you planned your entry yet?

GOLD EYES 3,360 BREAKOUT – IS THIS THE BUY SETUP?Gold is currently trading around $3,355, up 18 pips from yesterday. The bullish momentum is fueled by rising trade tensions as Trump imposes 35–50% tariffs on Canada and Brazil, along with a weakening USD and falling U.S. bond yields.
Technically, gold maintains a clear uptrend with higher lows. The $3,360 zone is now a key breakout level — if breached, price could surge toward $3,432. As long as gold holds above $3,250, the bullish structure remains intact.
What’s your move — breakout or pullback?

US500 Is Bullish! Long!
Here is our detailed technical review for US500.
Time Frame: 3h
Current Trend: Bullish
Sentiment: Oversold (based on 7-period RSI)
Forecast: Bullish
The market is trading around a solid horizontal structure 6,252.40.
The above observations make me that the market will inevitably achieve 6,297.19 level.
P.S
Overbought describes a period of time where there has been a significant and consistent upward move in price over a period of time without much pullback.
Disclosure: I am part of Trade Nation's Influencer program and receive a monthly fee for using their TradingView charts in my analysis.
Like and subscribe and comment my ideas if you enjoy them!

USDJPY Is Very Bearish! Short!
Take a look at our analysis for USDJPY.
Time Frame: 9h
Current Trend: Bearish
Sentiment: Overbought (based on 7-period RSI)
Forecast: Bearish
The market is testing a major horizontal structure 147.419.
Taking into consideration the structure & trend analysis, I believe that the market will reach 146.283 level soon.
P.S
Please, note that an oversold/overbought condition can last for a long time, and therefore being oversold/overbought doesn't mean a price rally will come soon, or at all.
Disclosure: I am part of Trade Nation's Influencer program and receive a monthly fee for using their TradingView charts in my analysis.
Like and subscribe and comment my ideas if you enjoy them!

NG1! SHORT FROM RESISTANCE
NG1! SIGNAL
Trade Direction: short
Entry Level: 3.356
Target Level: 3.150
Stop Loss: 3.493
RISK PROFILE
Risk level: medium
Suggested risk: 1%
Timeframe: 2h
Disclosure: I am part of Trade Nation's Influencer program and receive a monthly fee for using their TradingView charts in my analysis.
✅LIKE AND COMMENT MY IDEAS✅
