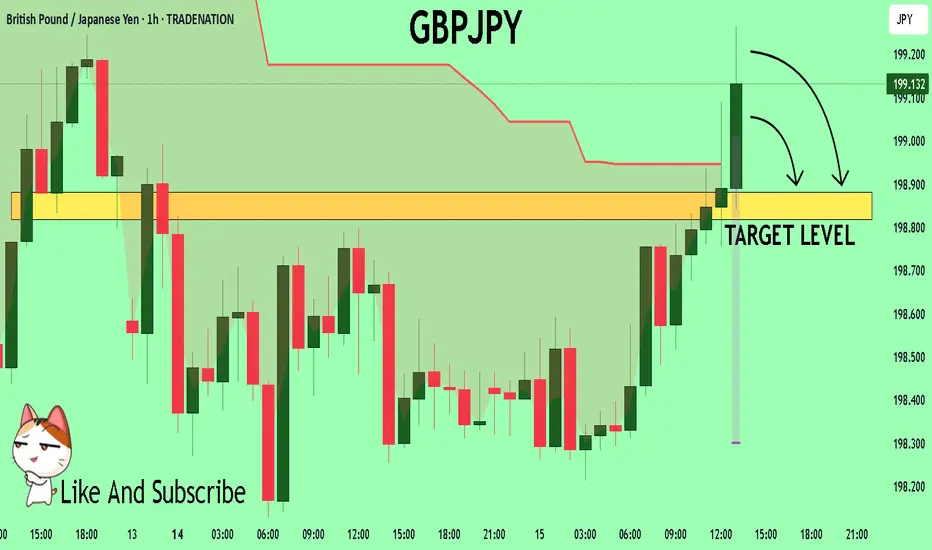
GBPJPY A Fall Expected! SELL!
My dear subscribers,
My technical analysis for GBPJPY is below:
The price is coiling around a solid key level - 199.16
Bias - Bearish
Technical Indicators: Pivot Points Low anticipates a potential price reversal.
Super trend shows a clear sell, giving a perfect indicators' convergence.
Goal - 198.88
About Used Indicators:
By the very nature of the supertrend indicator, it offers firm support and resistance levels for traders to enter and exit trades. Additionally, it also provides signals for setting stop losses
Disclosure: I am part of Trade Nation's Influencer program and receive a monthly fee for using their TradingView charts in my analysis.
———————————
WISH YOU ALL LUCK
Forex
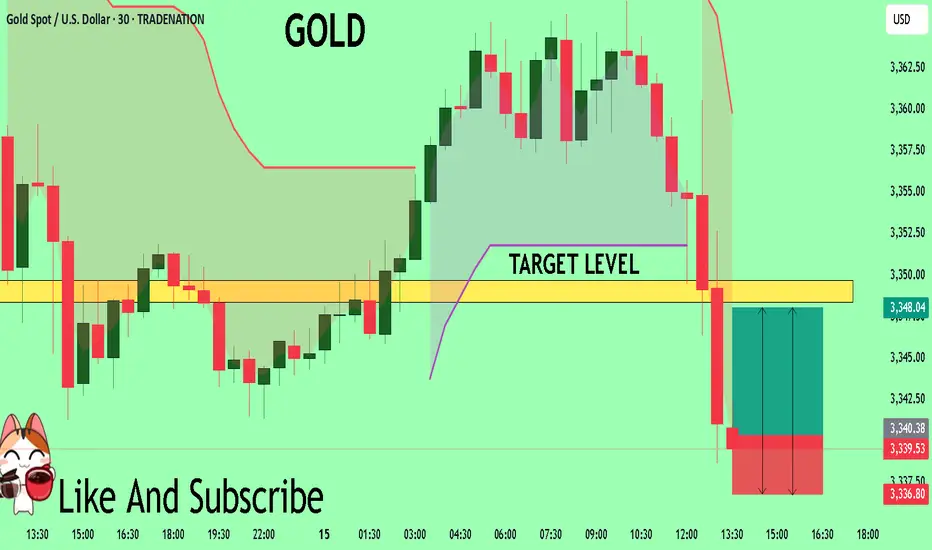
GOLD The Target Is UP! BUY!
My dear subscribers,
GOLD looks like it will make a good move, and here are the details:
The market is trading on 3340.39 pivot level.
Bias - Bullish
My Stop Loss - 3336.8
Technical Indicators: Both Super Trend & Pivot HL indicate a highly probable Bullish continuation.
Target - 3348.3
About Used Indicators:
The average true range (ATR) plays an important role in 'Supertrend' as the indicator uses ATR to calculate its value. The ATR indicator signals the degree of price volatility.
Disclosure: I am part of Trade Nation's Influencer program and receive a monthly fee for using their TradingView charts in my analysis.
———————————
WISH YOU ALL LUCK
GBP/USD still under pressure despite slightly weaker US core CPIThe US dollar, which had gained ground last week, was under a bit of pressure earlier today. And following a mixed inflation report, the greenback spiked before returning to pre-CPI levels. The inflation report hasn’t changed market’s perception about the likely path of interest rates.
US CPI comes in mixed
June’s CPI rose 0.3% MoM and 2.7% YoY—hotter than the prior 2.4% and above the 2.6% consensus. However, core CPI was a touch weaker, rising 0.2% m/m instead of 0.3%, while the y/y rate was 2.9% as expected.
The mixed CPI report means concerns that inflation may persist longer haven’t changed. The Fed may still delay or reduce the scope of any rate cuts, even if a September move is still on the table.
Adding to the dollar’s appeal, President Trump floated steep tariffs—35% on some Canadian goods and up to 30% on imports from Mexico and the EU—if deals aren’t reached by August 1. These protectionist signals and Trump’s expansive fiscal stance could further stoke inflation, supporting the greenback if confidence in US monetary policy holds.
Pound under pressure
Sterling has had a rough start to the week, extending last week’s 1% drop in GBP/USD before rebounding slightly earlier today. The pound's slide follows a run of soft UK economic data, boosting expectations for a Bank of England rate cut—likely in August. On Friday, data confirmed a second consecutive monthly contraction in the UK economy, driven by a worsening manufacturing slump. This has added to speculation that weakening growth and a stronger pound could help ease imported inflation, especially ahead of Wednesday’s UK CPI release.
Technical picture and key data ahead for GBP/USD
GBP/USD has broken below important support zones (1.3630 and 1.3530–1.3550), now turned resistance. It is currently testing the 1.3434 level, aligned with a key trendline. A breakdown here could open the door to deeper losses toward 1.3370 and potentially the low 1.30s.
Two major data points will guide the pair this week:
• UK CPI (July 16): A soft print would likely reinforce rate cut bets.
• US Retail Sales (July 17): After a May decline, a rebound could highlight US resilience and strengthen the dollar further.
By Fawad Razaqzada, market analyst with FOREX.com
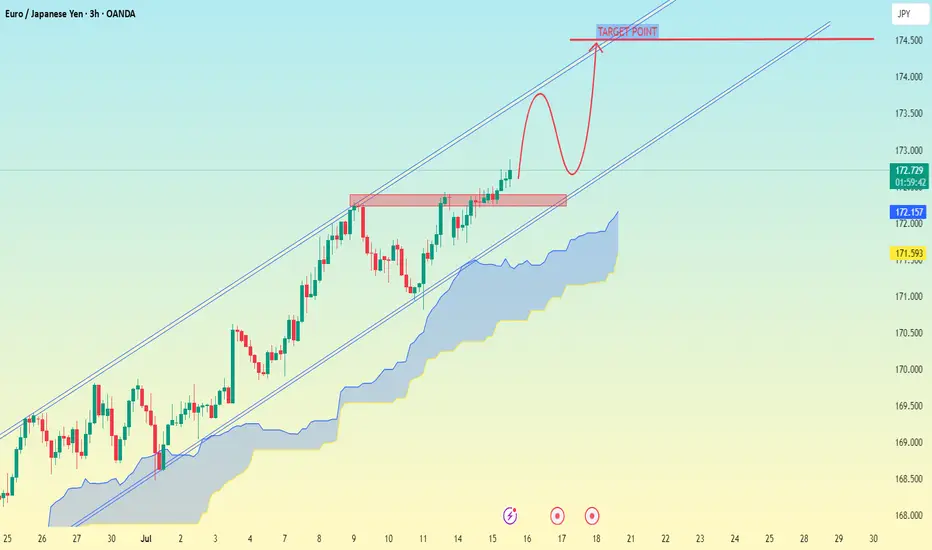
EUR/JPY (Euro vs Japanese Yen) on the 3-hour timeframeEUR/JPY (Euro vs Japanese Yen) on the 3-hour timeframe, the technical setup clearly suggests a bullish continuation inside an ascending channel, with a breakout above a consolidation zone.
---
🎯 Target Point (as marked on your chart):
Main Target Point: 174.500
---
🔍 Analysis Summary:
The price has broken above a resistance zone (around 172.700–172.900).
The chart shows a possible pullback and continuation setup (bullish flag/rounded retest).
The Ichimoku Cloud shows support below, suggesting bullish bias is intact.
The ascending channel remains unbroken and supports higher highs.
---
📌 Summary:
✅ Current Price Area: ~172.70
🥅 Target: 174.50
🔄 Potential Retest Zone: ~172.00–172.30 (marked in red box)
Would you like help with entry strategy, stop-loss placement, or trade management based on this setup?
#AN021: TRUMP Threats on Tariffs and FOREX Tensions
Global markets are waking up to a currency cold war. Hi, I'm Trader Andrea Russo, and today I want to share the latest news with you.
Donald Trump set the day alight, launching a barrage of threats from a rally in Ohio:
"If re-elected, I will impose 60% tariffs on all of China, 20% on Mexico, and 10% on the European Union. And I'm telling Putin clearly: if you continue to help China evade our embargoes, we will hit Russia too."
The words reverberated across global investment banks, triggering an immediate reaction in the dollar and emerging market currencies.
Markets React: USD Soars, GBP and NOK on Alert
The US dollar gained ground against nearly all major currencies, while the GBP collapsed under pressure from fears of a BoE rate cut and a slowing labor market.
The GBP/NOK pair, in particular, is showing signs of a structured bearish breakout: the pound is under dual pressure (domestic politics + trade war), while the Norwegian krone is indirectly benefiting from rising energy prices and pro-commodity sentiment.
US CPI at 2:30 PM: The Real Detonator
The US core inflation figure will be released at 2:30 PM Italian time. The consensus is for +3.4%, but a higher reading could push the Fed to remain more hawkish for longer. This would strengthen the dollar and create new shock waves in weak and emerging market currencies.
Specifically:
USD/JPY could break above 162.00 with strength.
GBP/USD risks a break below 1.29.
USD/SEK and USD/MXN are the key pairs to watch for explosive movements.
Trump vs. Powell: A Showdown
Meanwhile, fears are growing of a direct attack by Trump on the Fed. According to Deutsche Bank, markets are underestimating the possibility that Trump will attempt to remove Jerome Powell if he returns to the White House.
"The market is ignoring the Trump-Powell variance. If he really tries, the dollar could fall 4% in a week," – Deutsche Bank
We are about to enter the best time of the month for Forex. Those who get their timing wrong today will burn capital. Those who wait for the right signal can ride the trend arising from a predicted global crisis.

#010: USD/SEK SHORT Investment Opportunity
At the opening of the 8-hour candle, the price touched the 200-mark moving average with surgical precision on volume compression, signaling the exhaustion of the bullish movement underway since the end of June.
🔍 What strengthened the short position:
The price hit a key area defended by institutions, confirmed by increased open interest and compression in FX options between 9.68 and 9.69.
Retail investors are over 76% long, completely exposed to the wrong side.
Our entry was calculated after the false breakout, and we are positioned exactly below the zone where large traders have already loaded their short positions.
The trade is protected by future passive orders placed below 9.5000, where banks will defend their positions. Our stop is therefore outside the path of stop hunters.
📌 Short-term macro context:
Although the dollar remains strong, USD/SEK has reached a technical and statistical level that historically marks the beginning of short-term corrections, ideal for tactical trading.

USDJPY 1H - market buy with a confirmed structureThe price has bounced from a key support zone and is showing early signs of recovery. A clear base has formed, and the MA50 is starting to turn upward, indicating a shift in short-term momentum. While the MA200 remains above the price, the overall structure suggests a potential continuation of the bullish move.
Trade #1 — entry at market, target: 145.939, stop below recent local low.
Trade #2 — entry after breakout and retest of 145.939, target: 148.000, stop below the retest zone.
Volume has stabilized, and the reaction from support is clear. As long as price holds above the last swing low, buying remains the preferred strategy.

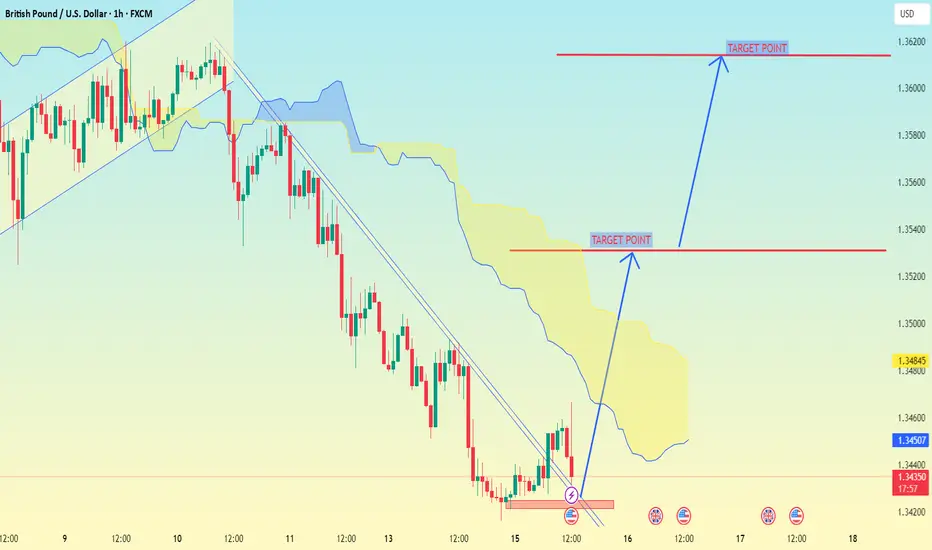
GBP/USD on the 1-hour timeframeGBP/USD on the 1-hour timeframe, here’s a breakdown of the target points indicated:
---
📍 Target Points (as marked on the chart):
1. First Target Point: Around 1.35200
2. Second Target Point: Around 1.36200
---
🧠 Analysis Notes (based on My setup):
Im used Ichimoku Cloud and a trendline breakout, which suggests a bullish reversal.
The price has broken out above a descending trendline and is possibly targeting the top of the cloud and further if momentum sustains.
The two target points represent:
First resistance level (likely top of the Ichimoku cloud).
Second resistance level (recent high before the downtrend began).
---
📌 Summary:
Immediate target: 1.35200
Next potential target: 1.36200
Let me know if you want stop-loss suggestions or a risk-reward analysis.
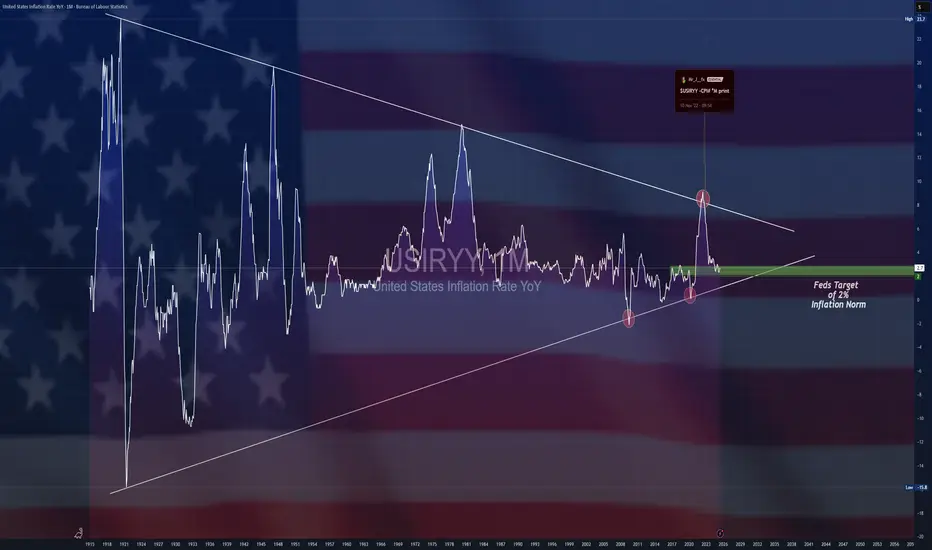
$USIRYY -U.S Inflation Rate Seen Rising for 2nd Month (June/2025ECONOMICS:USIRYY
June/2025
source: U.S. Bureau of Labor Statistics
- The annual inflation rate in the US likely accelerated for the second consecutive month to 2.7% in June, the highest level since February, up from 2.4% in May.
On a monthly basis, the CPI is expected to rise by 0.3%, marking the largest increase in five months.
Meanwhile, core inflation is projected to edge up to 3% from 2.8%. Monthly core CPI is also anticipated to climb 0.3%, up from 0.1% in May, marking its sharpest increase in five months.
NAS100 Is Very Bullish! Long!
Take a look at our analysis for NAS100.
Time Frame: 12h
Current Trend: Bullish
Sentiment: Oversold (based on 7-period RSI)
Forecast: Bullish
The market is on a crucial zone of demand 23,006.9.
The oversold market condition in a combination with key structure gives us a relatively strong bullish signal with goal 23,667.5 level.
P.S
Overbought describes a period of time where there has been a significant and consistent upward move in price over a period of time without much pullback.
Disclosure: I am part of Trade Nation's Influencer program and receive a monthly fee for using their TradingView charts in my analysis.
Like and subscribe and comment my ideas if you enjoy them!

GBPJPY Will Grow! Buy!
Here is our detailed technical review for GBPJPY.
Time Frame: 1D
Current Trend: Bullish
Sentiment: Oversold (based on 7-period RSI)
Forecast: Bullish
The market is trading around a solid horizontal structure 198.531.
The above observations make me that the market will inevitably achieve 202.938 level.
P.S
The term oversold refers to a condition where an asset has traded lower in price and has the potential for a price bounce.
Overbought refers to market scenarios where the instrument is traded considerably higher than its fair value. Overvaluation is caused by market sentiments when there is positive news.
Disclosure: I am part of Trade Nation's Influencer program and receive a monthly fee for using their TradingView charts in my analysis.
Like and subscribe and comment my ideas if you enjoy them!

AUDCHF Will Go Higher From Support! Long!
Take a look at our analysis for AUDCHF.
Time Frame: 1D
Current Trend: Bullish
Sentiment: Oversold (based on 7-period RSI)
Forecast: Bullish
The market is testing a major horizontal structure 0.522.
Taking into consideration the structure & trend analysis, I believe that the market will reach 0.533 level soon.
P.S
We determine oversold/overbought condition with RSI indicator.
When it drops below 30 - the market is considered to be oversold.
When it bounces above 70 - the market is considered to be overbought.
Disclosure: I am part of Trade Nation's Influencer program and receive a monthly fee for using their TradingView charts in my analysis.
Like and subscribe and comment my ideas if you enjoy them!

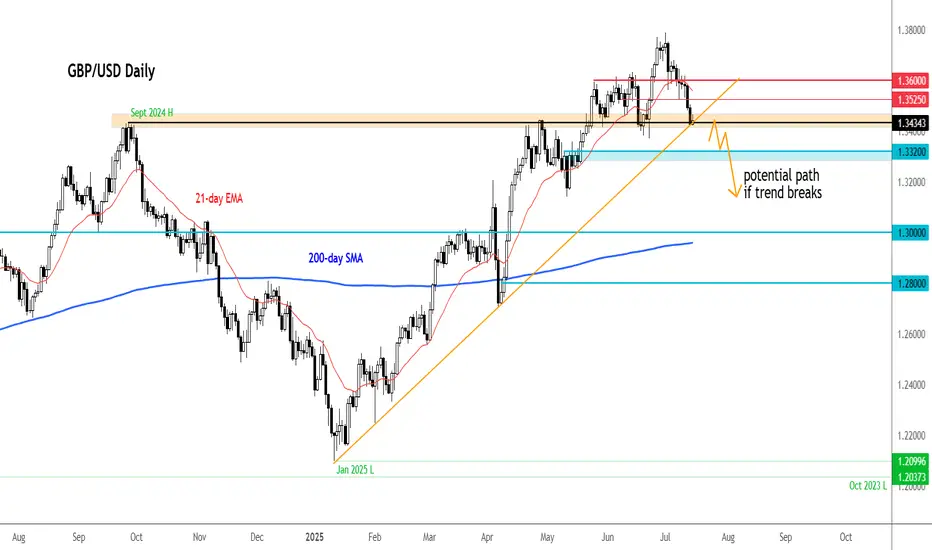
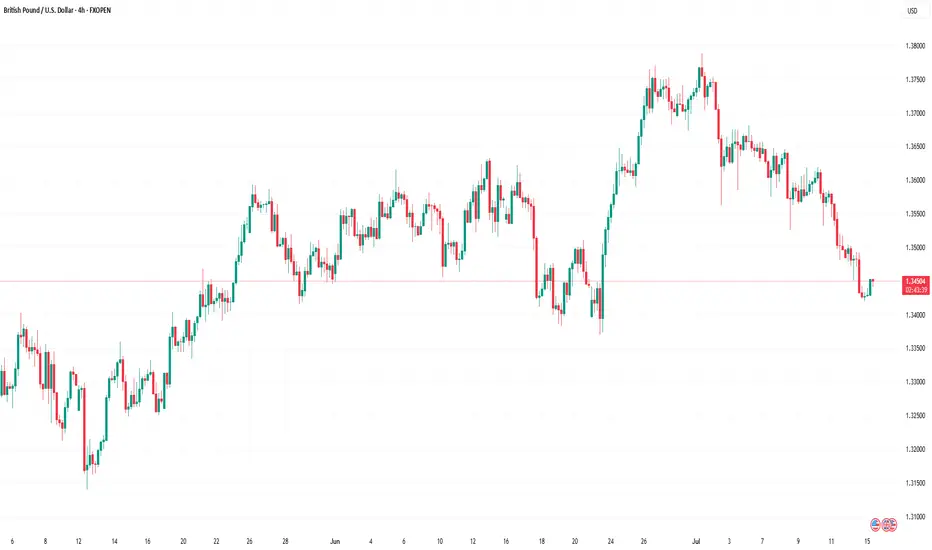
GBP/USD Rate Falls to Key Support LevelGBP/USD Rate Falls to Key Support Level
As of today, the GBP/USD chart indicates that the British pound has declined by more than 2% against the US dollar since the beginning of July. Notably, the pace of the decline accelerated on Friday and continued into Monday.
According to Reuters, the pound is under pressure due to market concerns over a potential economic slowdown amid an escalating trade war. Last week’s data confirmed a contraction in UK GDP, which could have far-reaching implications. In this context, criticism of the UK government’s failure to reduce public spending is becoming more pronounced.
What’s next for GBP/USD?
Technical Analysis of the GBP/USD Chart
From a bullish perspective, it is worth noting that the pair has fallen to a significant support level around 1.3425. This level previously acted as resistance in the spring, but after a breakout, it has now turned into support (as indicated by arrows on the chart). Additionally, the RSI indicator shows strong oversold conditions, which suggests a potential short-term rebound.
From a bearish standpoint, it is concerning that the sharp rally from point A to point B has been entirely erased by the July decline. This indicates that despite significant gains by the bulls, they failed to hold them—casting doubt on GBP/USD's ability to sustain growth in the medium term.
Ongoing pressure may lead to an attempt by bears to push GBP/USD below the June low at point A. However, it is also possible that bearish momentum will weaken thereafter, potentially leading to a recovery within the developing downward channel (marked in red).
This article represents the opinion of the Companies operating under the FXOpen brand only. It is not to be construed as an offer, solicitation, or recommendation with respect to products and services provided by the Companies operating under the FXOpen brand, nor is it to be considered financial advice.
USDJPY - Trade The Range!Hello TradingView Family / Fellow Traders. This is Richard, also known as theSignalyst.
📈USDJPY has been trading within a range between $140 and $150 round numbers and it is currently retesting the upper bound of the range.
📚 As per my trading style:
As #USDJPY is around the red circle zone, I will be looking for bearish reversal setups (like a double top pattern, trendline break , and so on...)
📚 Always follow your trading plan regarding entry, risk management, and trade management.
Good luck!
All Strategies Are Good; If Managed Properly!
~Rich
Disclosure: I am part of Trade Nation's Influencer program and receive a monthly fee for using their TradingView charts in my analysis.

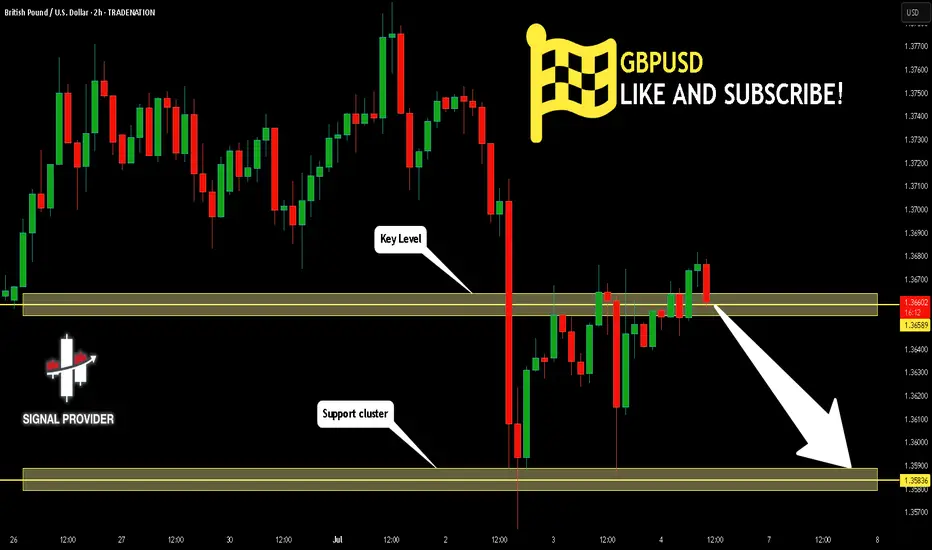
GBPUSD Will Go Lower! Sell!
Take a look at our analysis for GBPUSD.
Time Frame: 2h
Current Trend: Bearish
Sentiment: Overbought (based on 7-period RSI)
Forecast: Bearish
The market is testing a major horizontal structure 1.365.
Taking into consideration the structure & trend analysis, I believe that the market will reach 1.358 level soon.
P.S
Overbought describes a period of time where there has been a significant and consistent upward move in price over a period of time without much pullback.
Disclosure: I am part of Trade Nation's Influencer program and receive a monthly fee for using their TradingView charts in my analysis.
Like and subscribe and comment my ideas if you enjoy them!
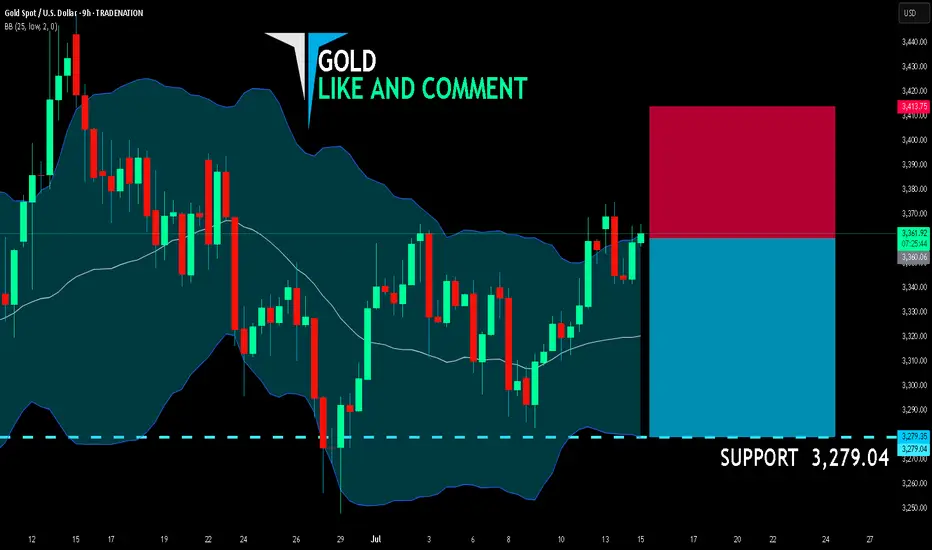
GOLD SHORT FROM RESISTANCE
GOLD SIGNAL
Trade Direction: short
Entry Level: 3,360.06
Target Level: 3,279.04
Stop Loss: 3,413.75
RISK PROFILE
Risk level: medium
Suggested risk: 1%
Timeframe: 9h
Disclosure: I am part of Trade Nation's Influencer program and receive a monthly fee for using their TradingView charts in my analysis.
✅LIKE AND COMMENT MY IDEAS✅
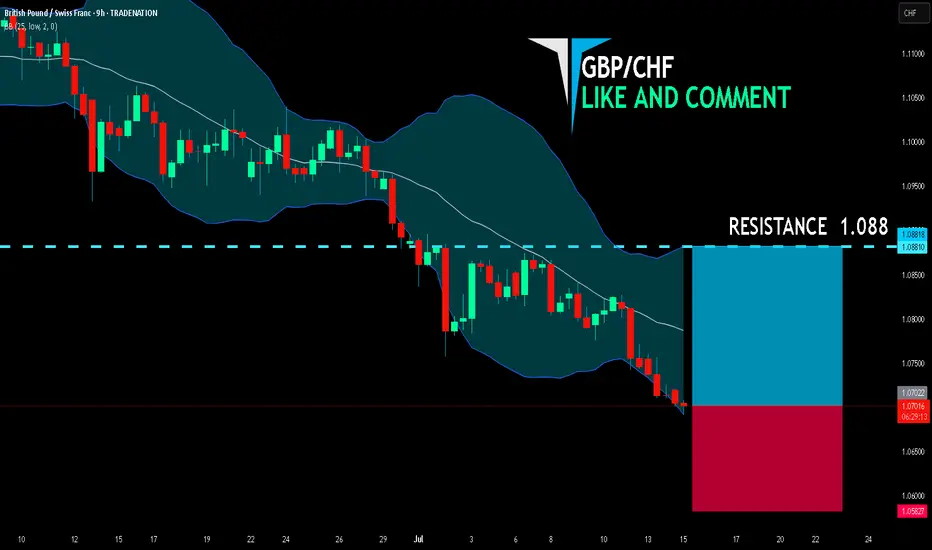
GBP/CHF BULLS WILL DOMINATE THE MARKET|LONG
GBP/CHF SIGNAL
Trade Direction: long
Entry Level: 1.070
Target Level: 1.088
Stop Loss: 1.058
RISK PROFILE
Risk level: medium
Suggested risk: 1%
Timeframe: 9h
Disclosure: I am part of Trade Nation's Influencer program and receive a monthly fee for using their TradingView charts in my analysis.
✅LIKE AND COMMENT MY IDEAS✅
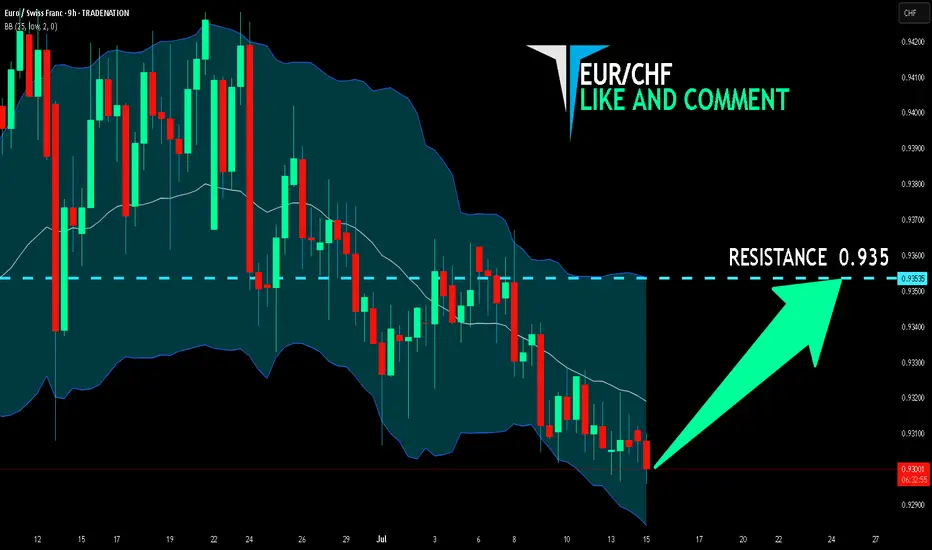
EUR/CHF SENDS CLEAR BULLISH SIGNALS|LONG
Hello, Friends!
EUR-CHF downtrend evident from the last 1W red candle makes longs trades more risky, but the current set-up targeting 0.935 area still presents a good opportunity for us to buy the pair because the support line is nearby and the BB lower band is close which indicates the oversold state of the EUR/CHF pair.
Disclosure: I am part of Trade Nation's Influencer program and receive a monthly fee for using their TradingView charts in my analysis.
✅LIKE AND COMMENT MY IDEAS✅
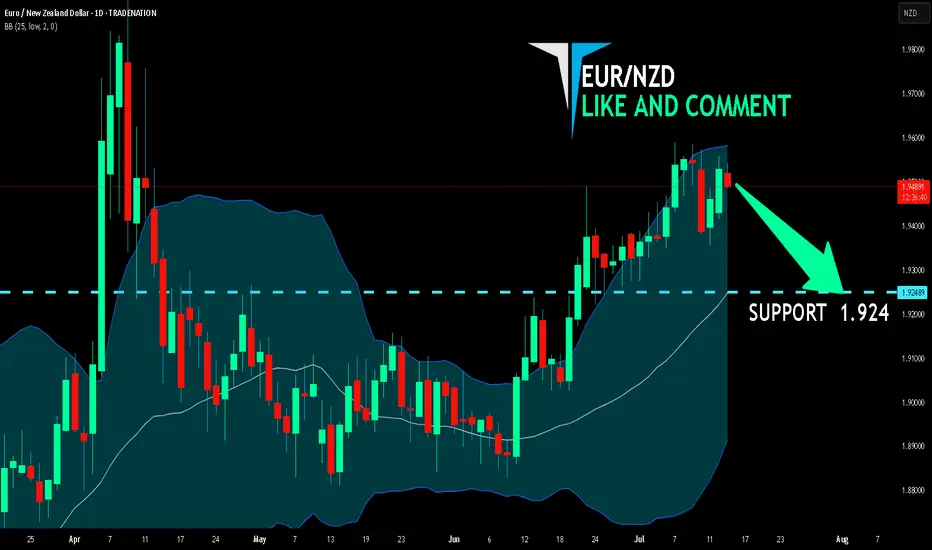
EUR/NZD BEARS ARE GAINING STRENGTH|SHORT
Hello, Friends!
EUR/NZD pair is in the uptrend because previous week’s candle is green, while the price is evidently rising on the 1D timeframe. And after the retest of the resistance line above I believe we will see a move down towards the target below at 1.924 because the pair overbought due to its proximity to the upper BB band and a bearish correction is likely.
Disclosure: I am part of Trade Nation's Influencer program and receive a monthly fee for using their TradingView charts in my analysis.
✅LIKE AND COMMENT MY IDEAS✅
GBP/CAD BEARS ARE GAINING STRENGTH|SHORT
GBP/CAD SIGNAL
Trade Direction: short
Entry Level: 1.858
Target Level: 1.849
Stop Loss: 1.863
RISK PROFILE
Risk level: medium
Suggested risk: 1%
Timeframe: 3h
Disclosure: I am part of Trade Nation's Influencer program and receive a monthly fee for using their TradingView charts in my analysis.
✅LIKE AND COMMENT MY IDEAS✅

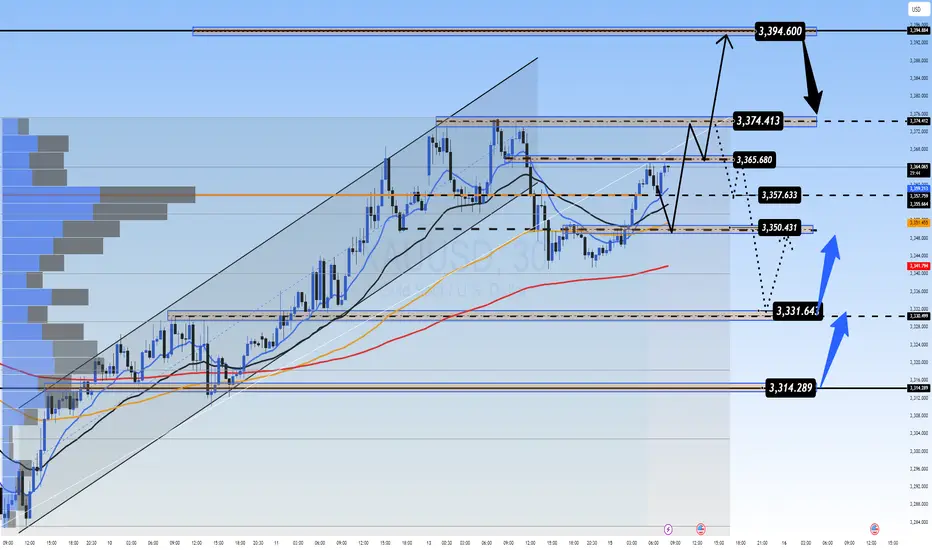
XAUUSD: Gold Moves Sideways, Awaiting Key Economic DataXAUUSD: Gold Moves Sideways, Awaiting Key Economic Data – Correction or Continued Uptrend?
🌍 Macro Overview – Waiting for CPI Data from the US
At the moment, Gold is trading in a wide sideways range between the 3x and 4x price levels, while traders are awaiting key economic data this week from USD, GBP, AUD, and EUR.
📊 Important Economic Data Today:
US CPI Report will be released during the US session today, making it one of the most important reports of the month.
CPI forecast is at 0.3%, which is considered positive for the US economy.
This report is expected to align with the recent Nonfarm data, and could lead to significant price movements upon release, potentially helping to adjust liquidity in the market.
🔍 Technical Analysis – Current Trend with Key Resistance Levels
The current trend remains bullish, but the movement on higher timeframes isn’t as pronounced.
Key resistance levels are located around 337x to 339x, where selling pressure is currently strong.
If price breaks through these levels, Gold could find support and move towards 3400.
📈 Short-Term Forecast:
A pullback to around 333x is expected, offering a good buying opportunity.
Looking further, 331x is a potential target, as the price range remains quite wide.
🎯 Trading Strategy for Today
🟢 BUY ZONE:
Entry: 3331 – 3329
SL: 3325
TP: 3335 → 3340 → 3345 → 3350 → 3360 → 3370 → ????
🔴 SELL ZONE:
Entry: 3392 – 3394
SL: 3398
TP: 3388 → 3384 → 3380 → 3376 → 3370
⚠️ Important Notes:
Watch for support and resistance levels to set up scalping trades that align with the current market trend.
Always set SL and TP to protect your account and avoid FOMO when there’s no clear confirmation for entry.
The 3350-3347 range is a key zone to look for buy opportunities.
💬 What’s your take on Gold’s movement today? Do you think it will break the resistance or will we see further correction? Share your thoughts in the comments below and join the discussion with fellow traders!
👉 If you want more daily updates and to participate in live discussions, don’t forget to follow and join our community! Let’s take advantage of these market opportunities together.
Falling Wedge Formation Ive been bullish on GBPJPY for a couple weeks now and I still believe that it has more upside potential. Here we have a Falling Wedge Formation. we have 4 touches on our pattern already and just waiting for a break and retest to enter again. I am currently in a position based of the retest price gave of the previous resistance (circled on chart). Lets see how it goes.

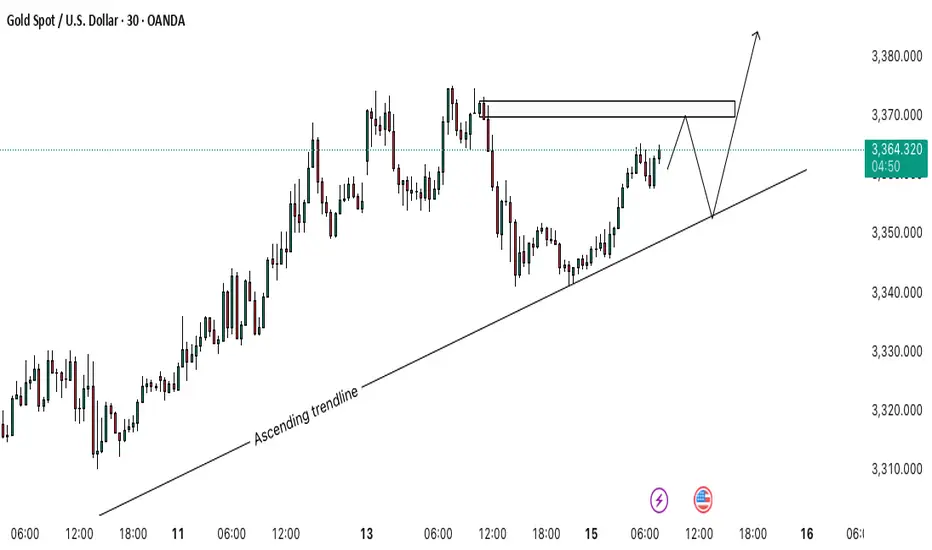
Gold (XAU/USD) – Bullish Continuation SetupGold is moving within an ascending trendline, showing strong bullish momentum. Price is approaching a Bearish Order Block near 3,370, which may trigger a short-term pullback 📉.
If price rejects from this zone and retests the trendline (around 3,355), it could offer a high-probability long setup for a continuation move toward 3,380+ 📈🚀.
🔍 Key Levels:
Resistance: 3,368–3,370 (Bearish Order Block)
Support: 3,355 (Trendline area)
💡 Trading Idea:
Look for price action confirmation near the trendline for potential buys. Break above the order block could fuel further upside.