EUR/USD : Another Fall Ahead ? (READ THE CAPTION)By analyzing the EURUSD chart on the 4-hour timeframe, we can see that the price is currently breaking through the 1.16–1.158 zone. If it manages to hold below 1.159, we can expect further downside movement. The next targets for EURUSD are 1.15580, 1.154, and 1.148.
Please support me with your likes and comments to motivate me to share more analysis with you and share your opinion about the possible trend of this chart with me !
Best Regards , Arman Shaban
Forex
Australian job numbers and AUDWe are keeping a close eye on the Australian job numbers tonight. If you are trading AUD, then that's the data to watch. Let's dig in.
FX_IDC:AUDUSD
FX_IDC:AUDJPY
FX_IDC:AUDNZD
Let us know what you think in the comments below.
Thank you.
75.2% of retail investor accounts lose money when trading CFDs with this provider. You should consider whether you understand how CFDs work and whether you can afford to take the high risk of losing your money. Past performance is not necessarily indicative of future results. The value of investments may fall as well as rise and the investor may not get back the amount initially invested. This content is not intended for nor applicable to residents of the UK. Cryptocurrency CFDs and spread bets are restricted in the UK for all retail clients.

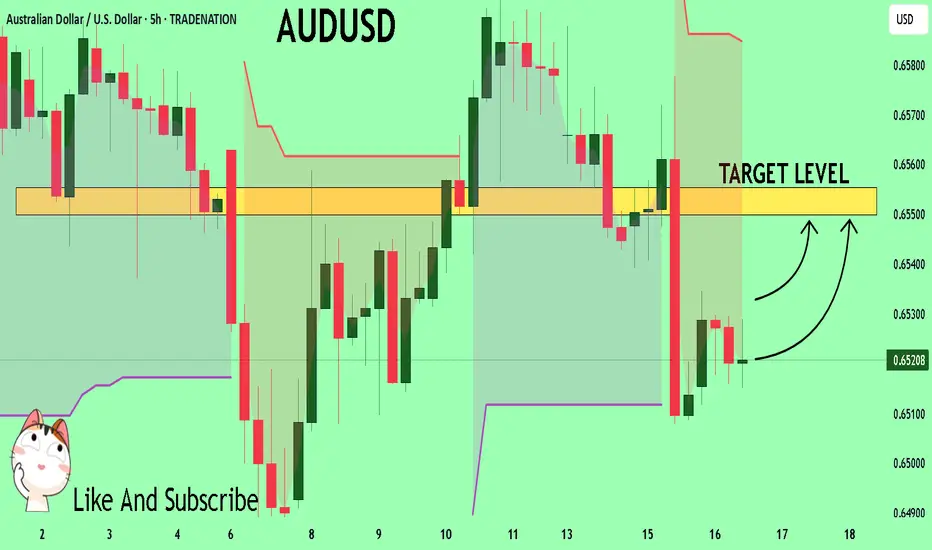
AUDUSD Set To Grow! BUY!
My dear subscribers,
AUDUSD looks like it will make a good move, and here are the details:
The market is trading on 0.6521 pivot level.
Bias - Bullish
Technical Indicators: Both Super Trend & Pivot HL indicate a highly probable Bullish continuation.
Target - 0.6550
About Used Indicators:
The average true range (ATR) plays an important role in 'Supertrend' as the indicator uses ATR to calculate its value. The ATR indicator signals the degree of price volatility.
Disclosure: I am part of Trade Nation's Influencer program and receive a monthly fee for using their TradingView charts in my analysis.
———————————
WISH YOU ALL LUCK
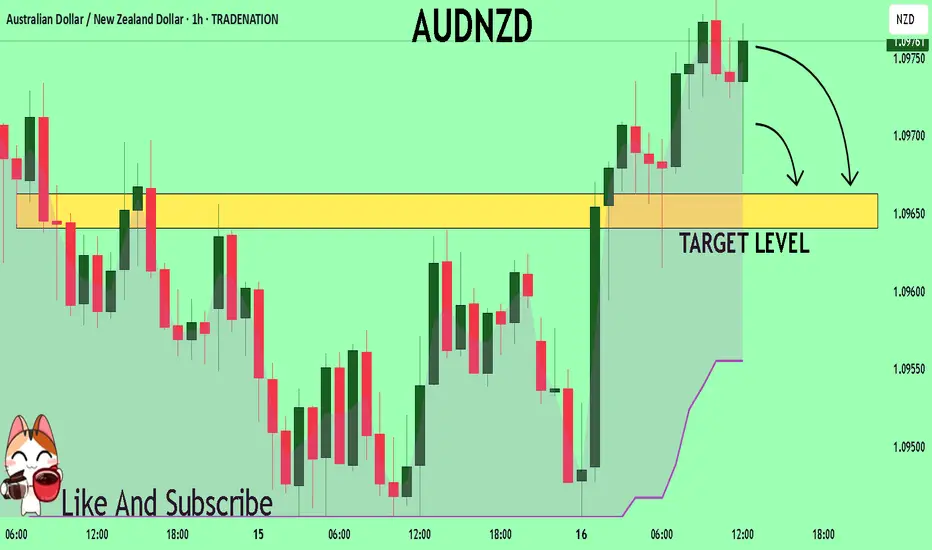
AUDNZD Under Pressure! SELL!
My dear followers,
This is my opinion on the AUDNZD next move:
The asset is approaching an important pivot point 1.0975
Bias - Bearish
Technical Indicators: Supper Trend generates a clear short signal while Pivot Point HL is currently determining the overall Bearish trend of the market.
Goal - 1.0966
About Used Indicators:
For more efficient signals, super-trend is used in combination with other indicators like Pivot Points.
Disclosure: I am part of Trade Nation's Influencer program and receive a monthly fee for using their TradingView charts in my analysis.
———————————
WISH YOU ALL LUCK
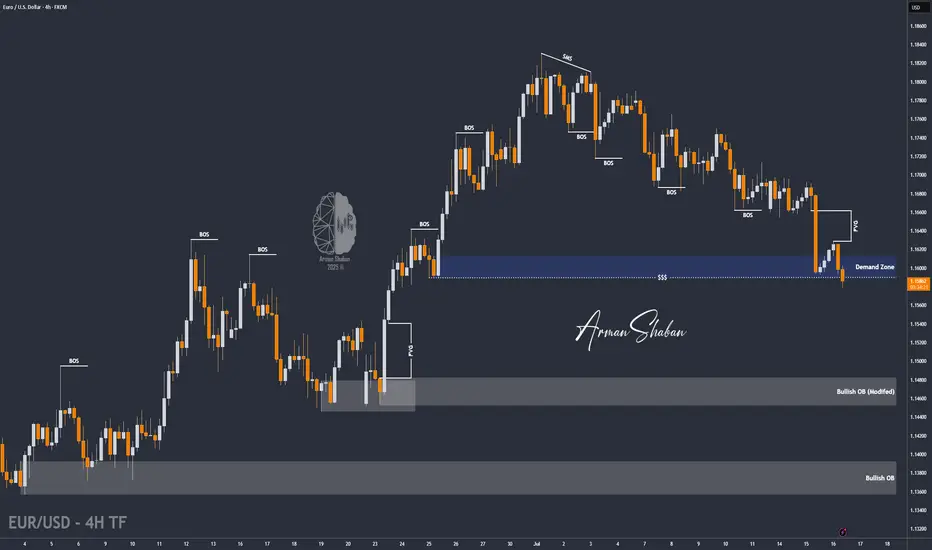
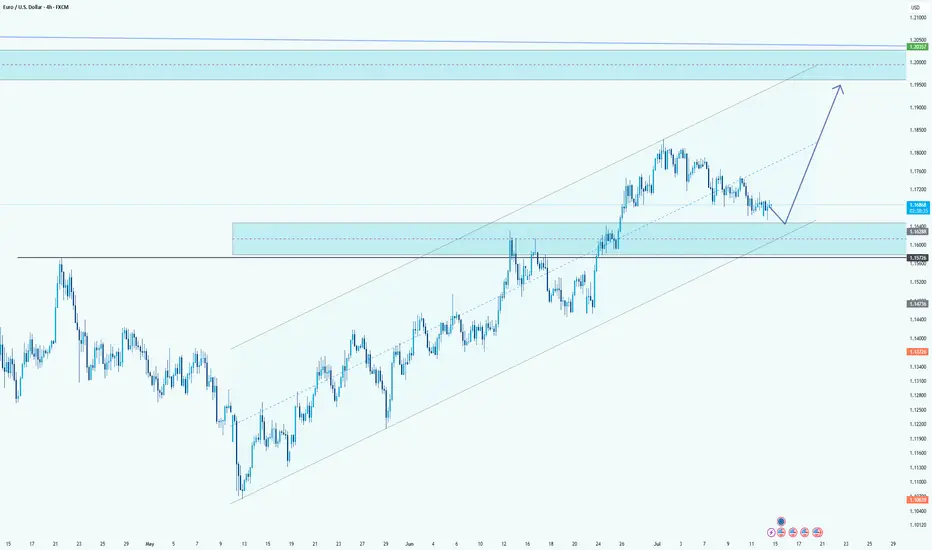
EUR/USD Retracement Into Demand ZoneHello guys!
EUR/USD is currently undergoing a healthy retracement after an extended bullish trend within the ascending channel. The price is now approaching a key demand zone, which aligns perfectly with the mid-line of the channel structure.
This zone previously acted as a strong resistance area and is now expected to serve as support, confirming a classic flip in market structure. The reaction around the 1.16288 - 1.15774 area will be crucial.
If buyers step in here, the bullish momentum is likely to resume with the next major target being the upper resistance zone near 1.20000 , as projected by the upward arrow. The overall structure remains bullish as long as the price holds above the channel support and doesn't close below the last demand zone.
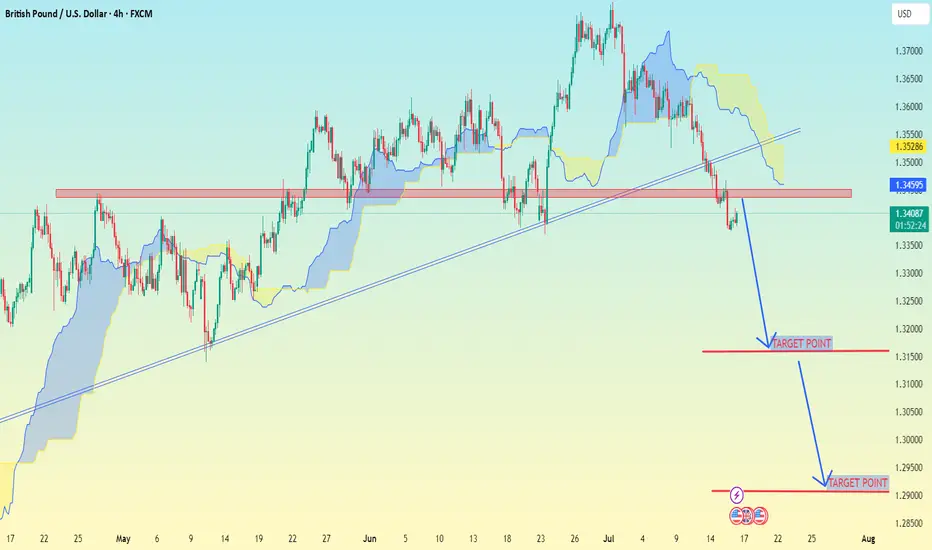
GBP/USD (4H time frame).GBP/USD (4H time frame)
---
📉 GBP/USD Trade Setup – 4H Analysis
Price has broken below a key trendline and horizontal support zone. Current structure shows bearish momentum with clean downside targets.
---
🔻 Sell Opportunity
Entry: 1.34000 (below broken support retest)
Target 1: 1.32000
Target 2: 1.29000
Stop Loss: 1.35200 (above resistance zone and cloud)
---
📌 Analysis Notes:
Price is trading below both the trendline and Ichimoku cloud – strong bearish confirmation.
Retest of broken support/resistance zone has already occurred.
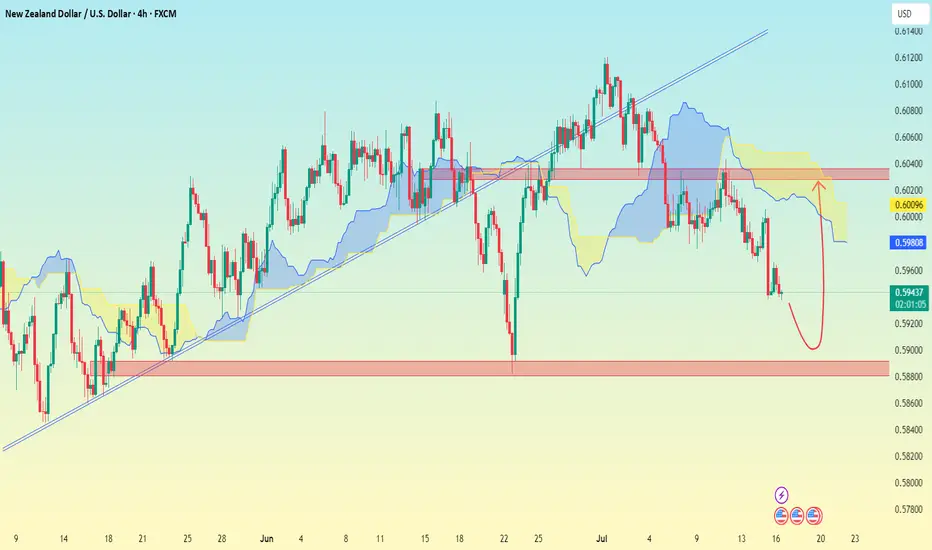
NZD/USD (4H time frame)..NZD/USD (4H time frame), here's the analysis:
---
📉 Chart Analysis Summary:
Price has broken below the trendline and is currently below the Ichimoku cloud, indicating bearish momentum.
A bearish move is likely continuing toward a strong support zone.
A rebound is drawn on my analysis suggesting a possible bounce after reaching a key demand zone.
---
🎯 Target Levels:
🔻 Bearish Move (Primary Setup):
Sell from: Current zone around 0.59400
Target 1: 0.59000
Target 2 (Main Support Zone): 0.58600
Stop Loss: Above the red horizontal resistance — around 0.60000
---
🔁 Possible Bounce Scenario (Secondary Setup):
If price hits the 0.58600 zone and shows reversal signs:
Buy from: 0.58600 – 0.58800
Target: 0.59800 – 0.60000
---
⚠ Key Zones:
🔴 Resistance: 0.60000 – 0.60200
🟢 Support: 0.58600 – 0.58800
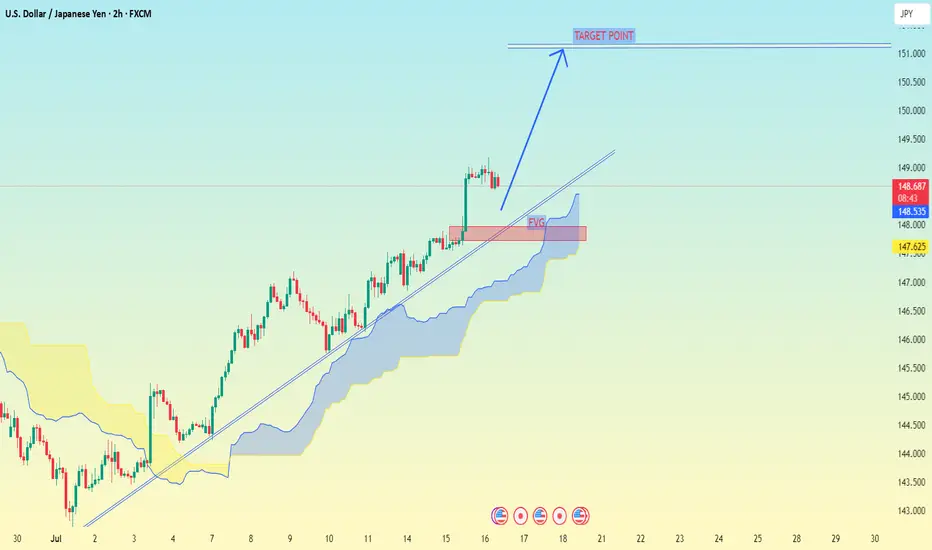
USD/JPY (2H time frame).USD/JPY (2H time frame), here is a breakdown:
📊 Technical Analysis Summary:
The chart shows an uptrend with price respecting a trendline.
Price is currently above the Ichimoku cloud, indicating bullish momentum.
A pullback zone (marked in red) is shown, likely suggesting a buying opportunity.
The chart indicates a projected move to the "Target Point" marked on the chart.
🎯 Target Level:
Target Point = 151.000
📌 Key Zones:
Support Zone / Pullback Entry: Around 147.80 to 148.20
Current Price: ~148.66
Resistance / Final Target: 151.000
✅ Trade Idea:
Buy on pullback near 148.00
Target: 151.000
Stop Loss: Below cloud or trendline, around 147.00
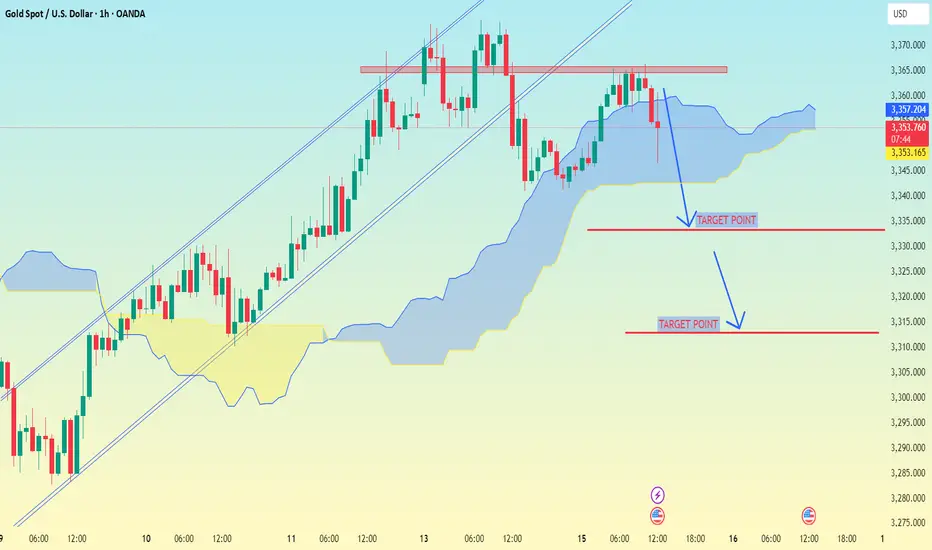
XAU/USD (Gold vs USD) on the 1-hour timeframe..XAU/USD (Gold vs USD) on the 1-hour timeframe, the setup clearly shows a bearish breakdown from an ascending channel, supported by Ichimoku Cloud analysis.
---
📉 Target Points (as marked on your chart):
1. First Target Point: Around $2,335
2. Second Target Point: Around $2,312
---
🔍 Analysis Breakdown:
Price has broken below the Ichimoku cloud – a bearish signal.
The ascending channel is broken to the downside.
Support zones and target levels are clearly marked:
The first target aligns with a previous support level.
The second target is a deeper support area, likely the base of the previous strong rally.
---
📌 Summary:
🥇 First Target: $2,335
🥈 Second Target: $2,312
📉 Bias: Bearish (continuation likely if momentum holds and no strong reversal signs appear)
Let me know if you want suggested stop-loss, entry confirmation ideas, or risk management tips.
BITCOIN Will Go Higher! Long!
Here is our detailed technical review for BITCOIN.
Time Frame: 9h
Current Trend: Bullish
Sentiment: Oversold (based on 7-period RSI)
Forecast: Bullish
The market is trading around a solid horizontal structure 119,063.08.
The above observations make me that the market will inevitably achieve 126,088.10 level.
P.S
Overbought describes a period of time where there has been a significant and consistent upward move in price over a period of time without much pullback.
Disclosure: I am part of Trade Nation's Influencer program and receive a monthly fee for using their TradingView charts in my analysis.
Like and subscribe and comment my ideas if you enjoy them!

EURUSD Will Go Down! Short!
Take a look at our analysis for EURUSD.
Time Frame: 15m
Current Trend: Bearish
Sentiment: Overbought (based on 7-period RSI)
Forecast: Bearish
The market is testing a major horizontal structure 1.161.
Taking into consideration the structure & trend analysis, I believe that the market will reach 1.159 level soon.
P.S
Please, note that an oversold/overbought condition can last for a long time, and therefore being oversold/overbought doesn't mean a price rally will come soon, or at all.
Disclosure: I am part of Trade Nation's Influencer program and receive a monthly fee for using their TradingView charts in my analysis.
Like and subscribe and comment my ideas if you enjoy them!

NZDCHF Will Move Lower! Sell!
Please, check our technical outlook for NZDCHF.
Time Frame: 4h
Current Trend: Bearish
Sentiment: Overbought (based on 7-period RSI)
Forecast: Bearish
The market is approaching a key horizontal level 0.475.
Considering the today's price action, probabilities will be high to see a movement to 0.472.
P.S
The term oversold refers to a condition where an asset has traded lower in price and has the potential for a price bounce.
Overbought refers to market scenarios where the instrument is traded considerably higher than its fair value. Overvaluation is caused by market sentiments when there is positive news.
Disclosure: I am part of Trade Nation's Influencer program and receive a monthly fee for using their TradingView charts in my analysis.
Like and subscribe and comment my ideas if you enjoy them!

GOLD Is Going Down! Short!
Please, check our technical outlook for GOLD.
Time Frame: 2h
Current Trend: Bearish
Sentiment: Overbought (based on 7-period RSI)
Forecast: Bearish
The price is testing a key resistance 3,363.11.
Taking into consideration the current market trend & overbought RSI, chances will be high to see a bearish movement to the downside at least to 3,342.15 level.
P.S
Please, note that an oversold/overbought condition can last for a long time, and therefore being oversold/overbought doesn't mean a price rally will come soon, or at all.
Disclosure: I am part of Trade Nation's Influencer program and receive a monthly fee for using their TradingView charts in my analysis.
Like and subscribe and comment my ideas if you enjoy them!

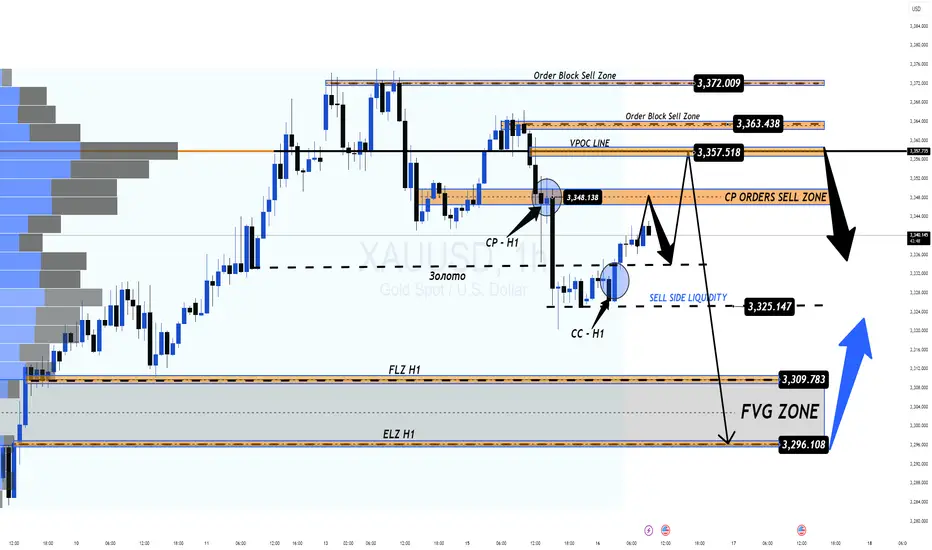
XAUUSD 16/07 – Temporary Rebound or Trap Before the Next Drop?XAUUSD 16/07 – Temporary Rebound or Trap Before the Next Drop?
🌍 Macro View – Calm Before the Volatility?
Gold is currently hovering around $3,334/oz after an aggressive sell-off earlier this week. While June's Core CPI data from the US came in lower than expected — easing immediate inflation concerns — the broader macro landscape remains far from stable:
New US tariffs are beginning to ripple through consumer prices.
Sectors like appliances and electronics are seeing early signs of inflation.
Shrinking inventories may lead to direct price pressures on consumers soon.
🔎 As the market digests these signals, gold remains a defensive play — but today's PPI release could flip sentiment quickly.
📉 Technical Outlook – Setup for a Deeper Pullback?
After CPI, gold retraced sharply and filled liquidity around 332x.
A clear Fair Value Gap (FVG) formed on the H1 chart, alongside a potential Continuation Pattern (CP) near 3347–3349.
Price action is likely to revisit the 334x–336x resistance zone, providing ideal short setups if rejection is confirmed.
🎯 Below lies a deep liquidity zone (FVG) near 3294, which could serve as the magnet for the next bearish move.
📊 Key Trade Zones to Watch
🔵 Buy Zone – Deep Liquidity Support: 3,296 – 3,294
SL: 3,290
TP: 3,300 → 3,304 → 3,308 → 3,312 → 3,316 → 3,320 → 3,330
🔴 Sell Scalp – CP Pattern Rejection: 3,347 – 3,349
SL: 3,353
TP: 3,343 → 3,340 → 3,336 → 3,330 → 3,325 → 3,320 → 3,310 → 3,300
🚨 Sell Zone – VPOC Level Resistance: 3,358 – 3,360
SL: 3,364
TP: 3,354 → 3,350 → 3,346 → 3,340 → 3,330 → 3,320 → 3,300
⚠️ What to Expect Today
All eyes are on the US PPI data, which could shake markets later in the session.
Look for a bullish fake-out during London or New York hours, especially toward 334x–336x zones.
Ideal strategy: wait for H1 candle confirmation before entering, and manage risk with clean TP/SL levels.
💬 Your Take?
Will gold revisit 329x this week, or are we setting up for a bullish reversal?
👇 Drop your thoughts in the comments and follow @MMFlowTrading for high-probability setups and macro insights — daily!
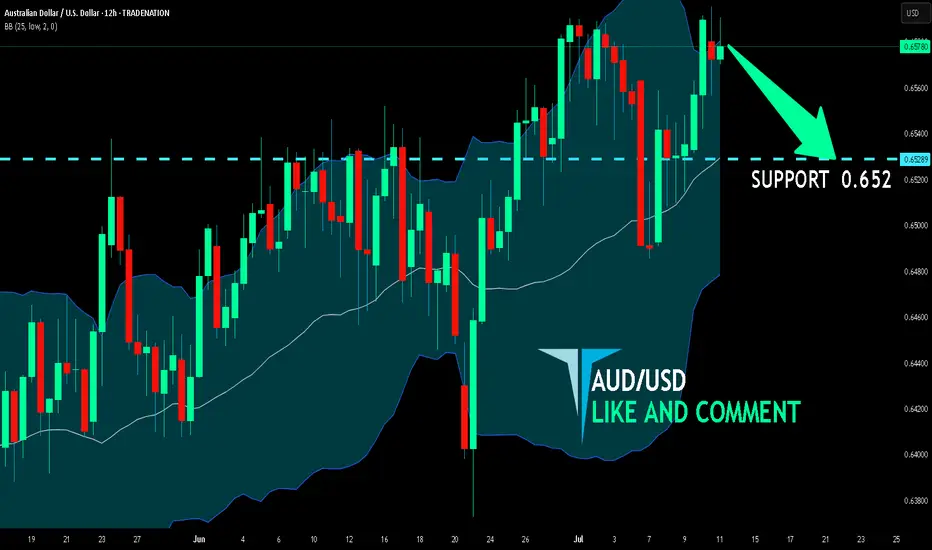
AUD/USD BEARS WILL DOMINATE THE MARKET|SHORT
Hello, Friends!
We are now examining the AUD/USD pair and we can see that the pair is going up locally while also being in a uptrend on the 1W TF. But there is also a powerful signal from the BB upper band being nearby, indicating that the pair is overbought so we can go short from the resistance line above and a target at 0.652 level.
Disclosure: I am part of Trade Nation's Influencer program and receive a monthly fee for using their TradingView charts in my analysis.
✅LIKE AND COMMENT MY IDEAS✅
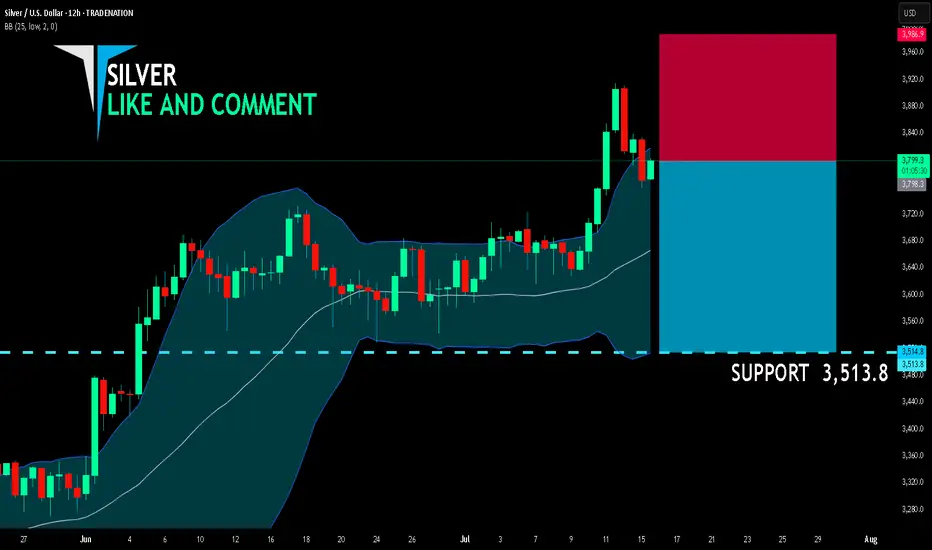
SILVER SELLERS WILL DOMINATE THE MARKET|SHORT
SILVER SIGNAL
Trade Direction: short
Entry Level: 3,798.3
Target Level: 3,513.8
Stop Loss: 3,986.9
RISK PROFILE
Risk level: medium
Suggested risk: 1%
Timeframe: 12h
Disclosure: I am part of Trade Nation's Influencer program and receive a monthly fee for using their TradingView charts in my analysis.
✅LIKE AND COMMENT MY IDEAS✅