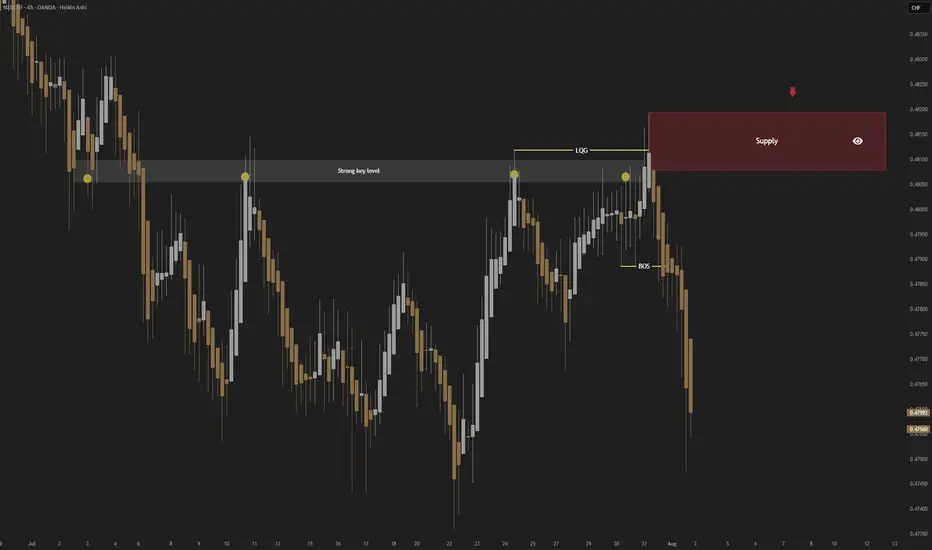
NZDCHF; Heikin Ashi Trade Idea📈 Hey Traders!
Here’s a fresh outlook from my trading desk. If you’ve been following me for a while, you already know my approach:
🧩 I trade Supply & Demand zones using Heikin Ashi chart on the 4H timeframe.
🧠 I keep it mechanical and clean — no messy charts, no guessing games.
❌ No trendlines, no fixed sessions, no patterns, no indicator overload.
❌ No overanalyzing market structure or imbalances.
❌ No scalping, and no need to be glued to the screen.
✅ I trade exclusively with limit orders, so it’s more of a set-and-forget style.
✅ This means more freedom, less screen time, and a focus on quality setups.
✅ Just a simplified, structured plan and a calm mindset.
💬 Let’s Talk:
💡 Do you trade supply & demand too ?
💡What’s your go-to timeframe ?
💡Ever tried Heikin Ashi ?
📩 Got questions about my strategy or setup? Drop them below — ask me anything, I’m here to share.
Let’s grow together and keep it simple. 👊
Forex
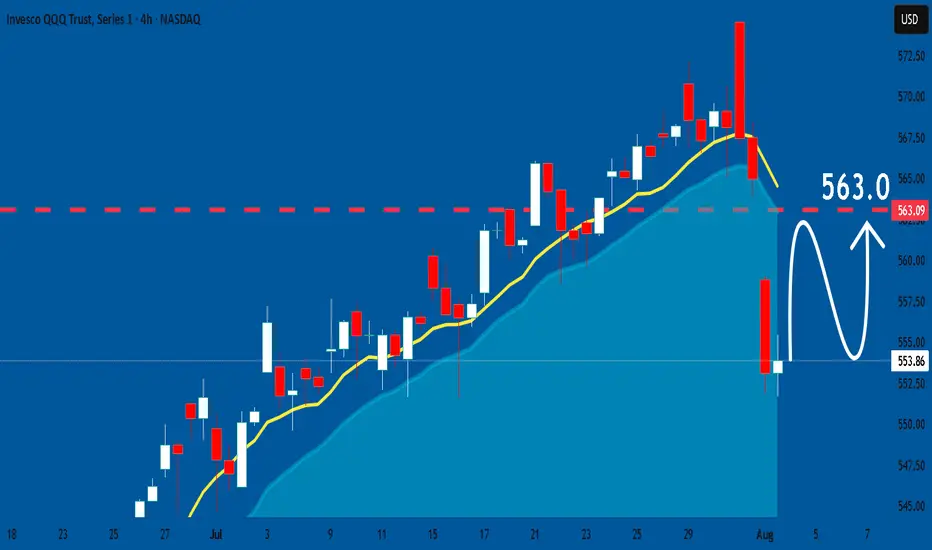
QQQ: Expecting Bullish Continuation! Here is Why:
Our strategy, polished by years of trial and error has helped us identify what seems to be a great trading opportunity and we are here to share it with you as the time is ripe for us to buy QQQ.
Disclosure: I am part of Trade Nation's Influencer program and receive a monthly fee for using their TradingView charts in my analysis.
❤️ Please, support our work with like & comment! ❤️
TESLA: Bullish Continuation & Long Trade
TESLA
- Classic bullish setup
- Our team expects bullish continuation
SUGGESTED TRADE:
Swing Trade
Long TESLA
Entry Point - 302.63
Stop Loss - 296.98
Take Profit - 312.87
Our Risk - 1%
Start protection of your profits from lower levels
Disclosure: I am part of Trade Nation's Influencer program and receive a monthly fee for using their TradingView charts in my analysis.
❤️ Please, support our work with like & comment! ❤️

NZDUSD What Next? SELL!
My dear subscribers,
This is my opinion on the NZDUSD next move:
The instrument tests an important psychological level 0.5920
Bias - Bearish
Technical Indicators: Supper Trend gives a precise Bearish signal, while Pivot Point HL predicts price changes and potential reversals in the market.
Target - 0.5899
My Stop Loss - 0.5932
About Used Indicators:
On the subsequent day, trading above the pivot point is thought to indicate ongoing bullish sentiment, while trading below the pivot point indicates bearish sentiment.
Disclosure: I am part of Trade Nation's Influencer program and receive a monthly fee for using their TradingView charts in my analysis.
———————————
WISH YOU ALL LUCK

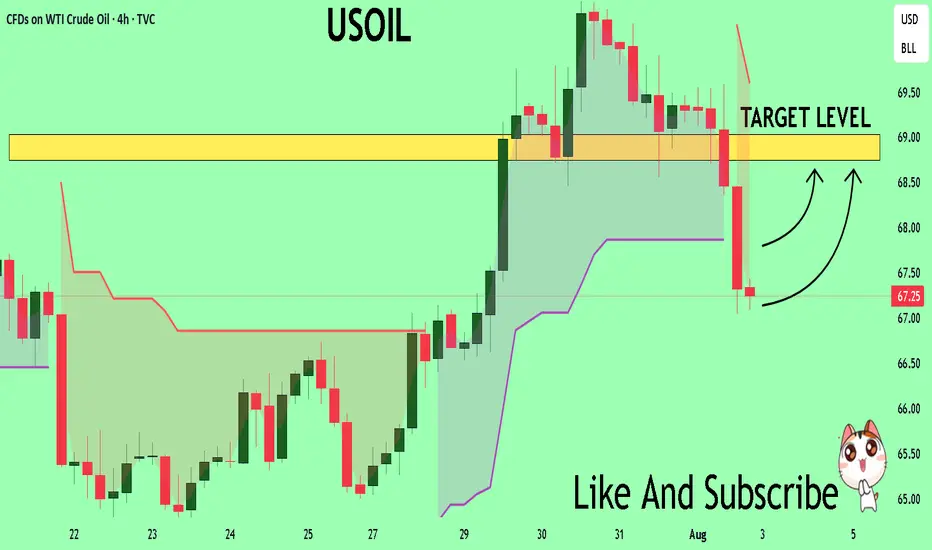
USOIL Technical Analysis! BUY!
My dear followers,
I analysed this chart on USOIL and concluded the following:
The market is trading on 67.25 pivot level.
Bias - Bullish
Technical Indicators: Both Super Trend & Pivot HL indicate a highly probable Bullish continuation.
Target - 68.74
About Used Indicators:
A super-trend indicator is plotted on either above or below the closing price to signal a buy or sell. The indicator changes color, based on whether or not you should be buying. If the super-trend indicator moves below the closing price, the indicator turns green, and it signals an entry point or points to buy.
Disclosure: I am part of Trade Nation's Influencer program and receive a monthly fee for using their TradingView charts in my analysis.
———————————
WISH YOU ALL LUCK
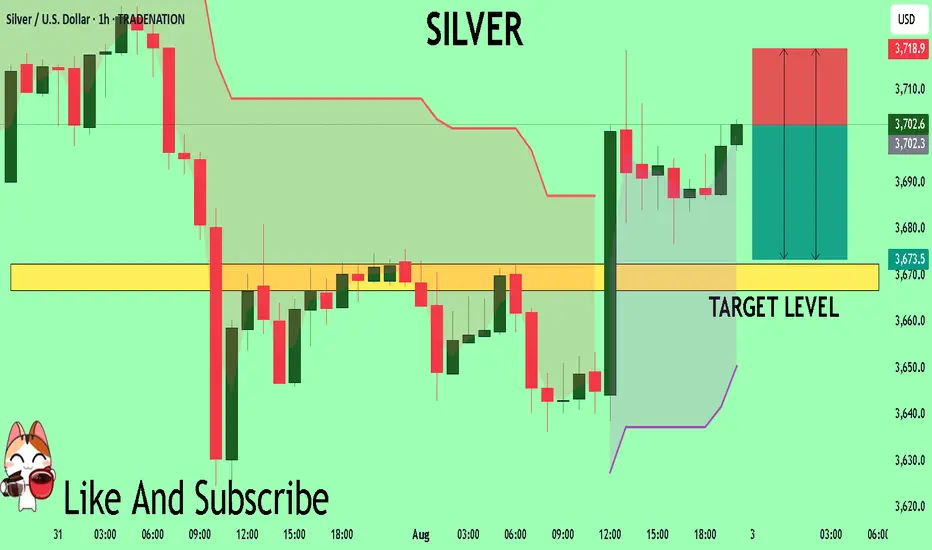
SILVER My Opinion! SELL!
My dear friends,
Please, find my technical outlook for SILVER below:
The price is coiling around a solid key level - 37.026
Bias - Bearish
Technical Indicators: Pivot Points Low anticipates a potential price reversal.
Super trend shows a clear sell, giving a perfect indicators' convergence.
Goal - 36.725
Safe Stop Loss - 37.189
About Used Indicators:
The pivot point itself is simply the average of the high, low and closing prices from the previous trading day.
Disclosure: I am part of Trade Nation's Influencer program and receive a monthly fee for using their TradingView charts in my analysis.
———————————
WISH YOU ALL LUCK
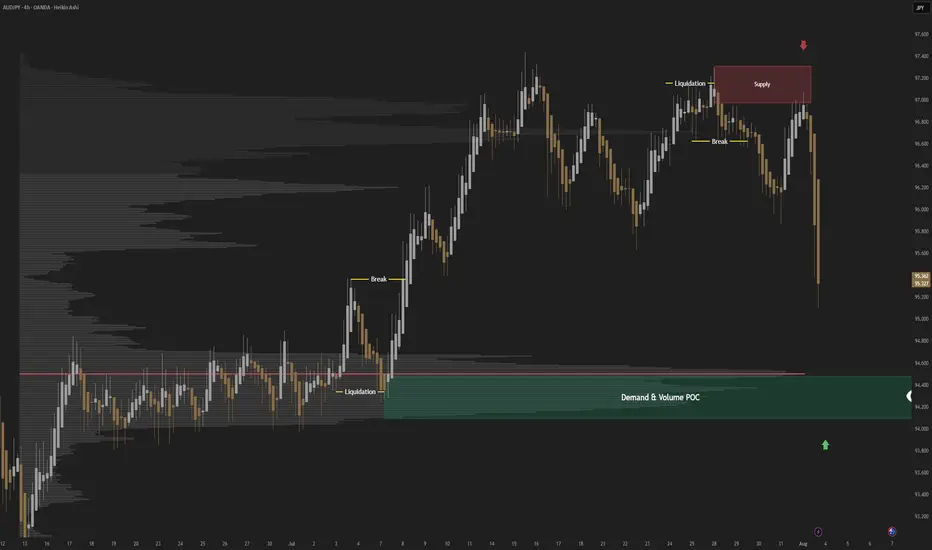
AUDJPY; Heikin Ashi Trade IdeaIn this post, I’ll be sharing my analysis of AUDJPY with my unique Heikin Ashi strategy.Picture tells more than 1000 words, no BS. I highlight key areas where I’m anticipating potential opportunities.
I’m always happy to receive any feedback.
Like, share and comment! ❤️
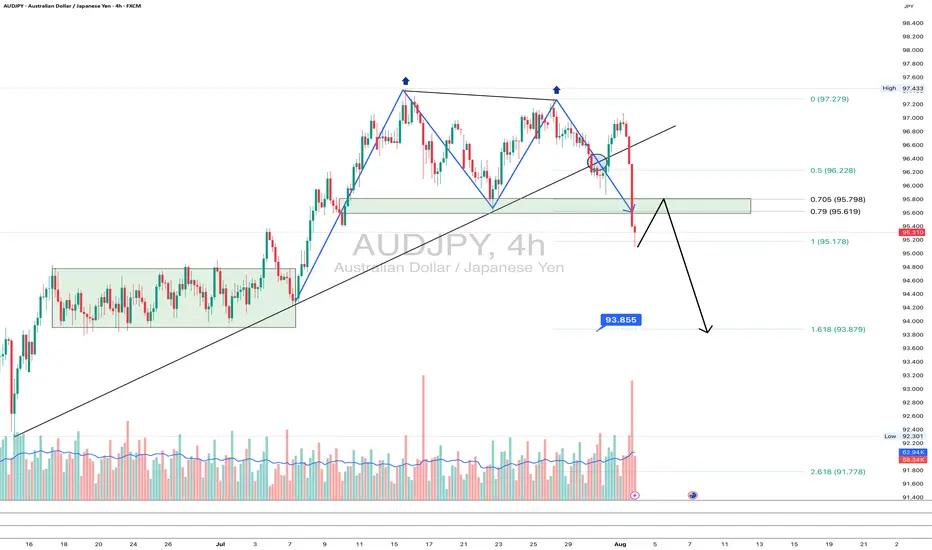
AUDJPY: goodbye uptrend?On the 4H chart, AUDJPY has printed a textbook double top pattern, breaking the rising trendline and diving below the 95.6–95.78 support zone - now acting as resistance. The pair is currently retesting this zone from below, which often provides a clean re-entry point for bears.
This area also aligns with the 0.705–0.79 Fibonacci retracement, reinforcing it as a key resistance. If the price rejects this zone, the next target is 93.85 (1.618 Fibo projection), followed by 93.25 and potentially 91.71 if momentum strengthens.
Fundamentally, the yen gains strength on risk-off flows and diverging rate expectations, while the Australian dollar is pressured by falling commodity prices and a likely pause from the RBA. This widens the rate differential and weakens AUD.
As long as price remains below 95.78, sellers are in control. Watch for a rejection from this retest zone.
USOIL BULLS ARE STRONG HERE|LONG
USOIL SIGNAL
Trade Direction: short
Entry Level: 67.26
Target Level: 68.46
Stop Loss: 66.46
RISK PROFILE
Risk level: medium
Suggested risk: 1%
Timeframe: 1h
Disclosure: I am part of Trade Nation's Influencer program and receive a monthly fee for using their TradingView charts in my analysis.
✅LIKE AND COMMENT MY IDEAS✅

EUR/CHF SHORT FROM RESISTANCE
Hello, Friends!
EUR/CHF pair is in the uptrend because previous week’s candle is green, while the price is obviously rising on the 5H timeframe. And after the retest of the resistance line above I believe we will see a move down towards the target below at 0.926 because the pair overbought due to its proximity to the upper BB band and a bearish correction is likely.
Disclosure: I am part of Trade Nation's Influencer program and receive a monthly fee for using their TradingView charts in my analysis.
✅LIKE AND COMMENT MY IDEAS✅

EUR/NZD BEARS WILL DOMINATE THE MARKET|SHORT
Hello, Friends!
EUR/NZD pair is trading in a local uptrend which we know by looking at the previous 1W candle which is green. On the 12H timeframe the pair is going up too. The pair is overbought because the price is close to the upper band of the BB indicator. So we are looking to sell the pair with the upper BB line acting as resistance. The next target is 1.929 area.
Disclosure: I am part of Trade Nation's Influencer program and receive a monthly fee for using their TradingView charts in my analysis.
✅LIKE AND COMMENT MY IDEAS✅

CAD_JPY BEARISH BREKAOUT|SHORT|
✅CAD_JPY broke the key structure level of 107.400
While trading in an local downtrend
Which makes me bearish
And I think that after the retest of the broken level is complete
A rebound and bearish continuation will follow
SHORT🔥
✅Like and subscribe to never miss a new idea!✅
Disclosure: I am part of Trade Nation's Influencer program and receive a monthly fee for using their TradingView charts in my analysis.

GBP-AUD Growth Ahead! Buy!
Hello,Traders!
GBP-AUD made a retest
Of the horizontal support
Of 2.0420 and we are
Already seeing a bullish
Rebound so we will be
Expecting a further
Bullish move up
Buy!
Comment and subscribe to help us grow!
Check out other forecasts below too!
Disclosure: I am part of Trade Nation's Influencer program and receive a monthly fee for using their TradingView charts in my analysis.

CHF_JPY RISKY LONG|
✅CHF_JPY has retested a key support level of 182.800
And as the pair is already making a bullish rebound
A move up to retest the supply level above at 183.700 is likely
LONG🚀
✅Like and subscribe to never miss a new idea!✅
Disclosure: I am part of Trade Nation's Influencer program and receive a monthly fee for using their TradingView charts in my analysis.

EUR-AUD Bullish Breakout! Buy!
Hello,Traders!
EUR-AUD made a bullish
Breakout of the falling resistance
And the breakout is confirmed
So we are bullish biased
And we will be expecting
A further bullish move up
On Monday!
Buy!
Comment and subscribe to help us grow!
Check out other forecasts below too!
Disclosure: I am part of Trade Nation's Influencer program and receive a monthly fee for using their TradingView charts in my analysis.

CADJPY Expected Growth! BUY!
My dear friends,
CADJPY looks like it will make a good move, and here are the details:
The market is trading on 107.35 pivot level.
Bias - Bullish
Technical Indicators: Supper Trend generates a clear long signal while Pivot Point HL is currently determining the overall Bullish trend of the market.
Goal - 107.90
About Used Indicators:
Pivot points are a great way to identify areas of support and resistance, but they work best when combined with other kinds of technical analysis
Disclosure: I am part of Trade Nation's Influencer program and receive a monthly fee for using their TradingView charts in my analysis.
———————————
WISH YOU ALL LUCK

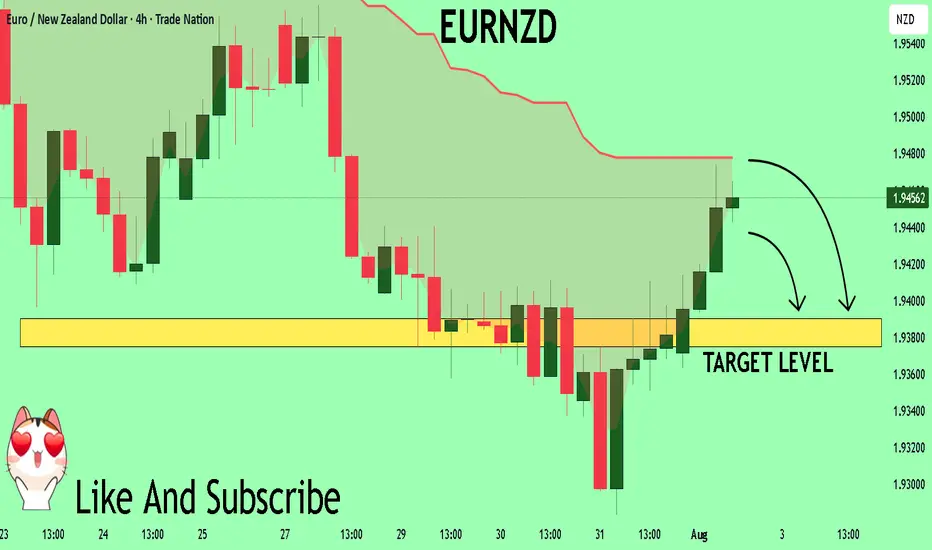
EURNZD Set To Fall! SELL!
My dear subscribers,
This is my opinion on the EURNZD next move:
The instrument tests an important psychological level 1.9459
Bias - Bearish
Technical Indicators: Supper Trend gives a precise Bearish signal, while Pivot Point HL predicts price changes and potential reversals in the market.
Target - 1.9390
About Used Indicators:
On the subsequent day, trading above the pivot point is thought to indicate ongoing bullish sentiment, while trading below the pivot point indicates bearish sentiment.
Disclosure: I am part of Trade Nation's Influencer program and receive a monthly fee for using their TradingView charts in my analysis.
———————————
WISH YOU ALL LUCK
Nonfarm Pay Attention Zone✏️ OANDA:XAUUSD is recovering and increasing towards the resistance zone of yesterday's US session. The 3315 zone is considered a strategic zone for Nonfarm today. A sweep up and then collapse to the liquidity zone of 3250 will be scenario 1 for Nonfarm today. If this important price zone is broken, we will not implement SELL strategies but wait for retests to BUY. It is very possible that when breaking 3315, it will create a DOW wave with the continuation of wave 3 when breaking the peak of wave 1.
📉 Key Levels
SELL trigger: Reject resistance 3315.
Target 3250
BUY Trigger: Break out and retest resistance 3315
Leave your comments on the idea. I am happy to read your views.

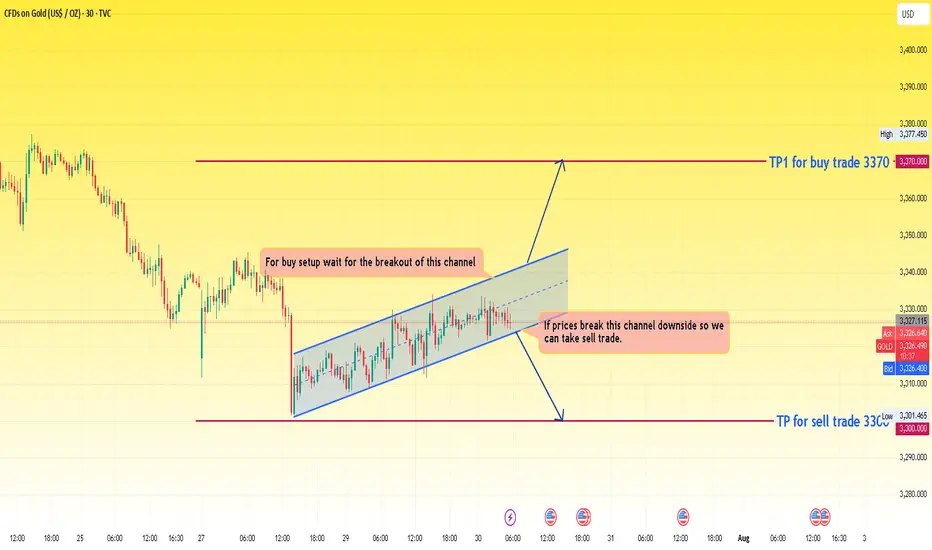
XAUUSD prices current scenario This chart presents a range-bound price action within an ascending channel and offers two potential breakout trade opportunities depending on price direction.
🔍 Chart Summary:
> Current Price: Around 3326-3328
> Pattern: Ascending channel
> Bias: Neutral (waiting for breakout)
📊 Channel Analysis:
> Price is moving inside an ascending channel, marked by two parallel trendlines (support and resistance).
> This suggests gradual bullish pressure, but the price is still within a consolidation/ranging structure.
> Buyers and sellers are currently indecisive, waiting for a clear breakout direction.
🧠 Trade Scenarios:
✅ Buy Setup:
: Condition: Breakout above the upper channel resistance
: Confirmation: Break and close above channel, ideally with strong bullish candles and volume
: Target: 3370 (marked as TP1 for buy trade)
> Reasoning: Breakout confirms buyer dominance and momentum continuation
❌ Sell Setup:
: Condition: Breakdown below the lower channel support
: Confirmation: Break and close below the channel with a bearish engulfing or volume spike
: Target: 3300 (marked as TP for sell trade)
> Reasoning: Break below structure indicates loss of buyer control and return of bearish trend
⚠️ Key Notes:
: The ascending channel suggests short-term bullish strength, but no strong trend has been confirmed yet.
: Avoid entering within the channel—this is a no-trade zone due to market indecision.
: Wait for confirmation of breakout/breakdown before entering trades.
✅ Conclusion:
> The price is currently in a rising consolidation channel.
> Breakout above = buy opportunity toward 3370
> Breakdown below = sell opportunity toward 3300
This is a classic wait-for-breakout setup—ideal for breakout traders looking for defined risk and reward zones.
GBPUSD BUYGBP/USD rebounds from lows, back above 1.3200
GBP/USD now alternates gains with losses in the low-1.3200s, reversing an early pullback to the 1.3180 zone. Meanwhile, Cable's inconclusive tone is accompanied by some renewed selling pressuron on the the US Dollar in the wake of US data releases.
Robust macroeconomic data releases from the United States (US) and the Federal Reserve's (Fed) cautious tone on policy-easing fuelled a bullish rally in the US Dollar (USD) midweek, causing GBP/USD to decline sharply.
The US Bureau of Economic Analysis' (BEA) first estimate showed that the United States' (US) economy staged an impressive comeback following the 0.5% contraction seen in the first quarter. The Gross Domestic Product (GDP) grew at an annual rate of 3% in the second quarter, surpassing the market expectation of 2.4%. Additionally, ADP Employment Change came in at 104,000 in July, beating analysts' estimate of 78,000 by a wide margin.
Later in the day, the Fed announced that it maintained the policy rate at the range of 4.25%-4.5% in a widely expected decision. The policy statement showed that Governor Christopher Waller and Governor Michelle Bowman dissented, preferring a 25 basis points (bps) rate cut, which was also anticipated.
In the post-meeting press conference, Fed Chairman Jerome Powell refrained from confirming a rate cut at the next meeting in September, citing heathy conditions in the labor market and explaining that the current policy stance as being appropriate to guard against inflation risks. Moreover, Powell said that the policy was not holding back the economy despite being still modestly restrictive.
According go the CME FedWatch Tool, the probability of a 25 basis points Fed rate cut in September dropped toward 40% from above-60% before the Fed event. In turn, US Treasury bond yields pushed higher and the USD outperformed its rivals during the American trading hours.
The BEA will release Personal Consumption Expenditures (PCE) Price Index data for June on Thursday. Powell said that they expect the annual PCE inflation and Core PCE inflation to come in at 2.5% and 2.7%, respectively. Weekly Initial Jobless Claims will also be featured in the US economic calendar. Ahead of Friday's critical July employment report, investors could remain hesitant to take large positions based on this data.
It's important to note that month-end flows on the last day of July could ramp up volatility toward the end of the European session and trigger irregular movements in the pair.
SUPPORT 1.33727
SUPPORT 1.33128
SUPPORT 1.32590
RESISTANCE 1.3052
RESISTANCE 1.31567

GBP/USD Professional Analysis – “Trap Trigger at Support”GBP/USD Professional Analysis – “Trap Trigger at Support”
📈 Market Overview:
• Pair: GBP/USD
• Timeframe: Likely 1H or 2H based on candle spacing
• Date: July 28, 2025
• Current Price: 1.33529
⸻
🔍 Technical Breakdown
🔴 Resistance Zone: 1.35800 – 1.36200
• Strong supply area where the last bullish impulse failed.
• Price got rejected hard, initiating a new downtrend.
• Sell-side pressure was confirmed with Supertrend turning red.
🟤 Support Zone: 1.32860 – 1.33400
• Major demand area where price previously reversed sharply.
• Currently being tested again after a clean sweep into the Trap Trigger zone.
⚠ Trap Trigger Zone (Liquidity Sweep Area):
• Price wicked just below support, tapping into a low-volume/high-liquidity area.
• This wick likely cleared sell-side liquidity and trapped breakout sellers.
• Followed by a bullish rejection wick, implying smart money accumulation.
⸻
🛠 Indicators & Tools:
• Supertrend (10,3): Currently red, indicating short-term bearish momentum.
• However, if price closes above 1.34032 (Supertrend level), it could flip bullish.
• Volume Profile (VRVP):
• Low-volume node under support suggests a quick “stop hunt” move, not genuine selling.
• High-volume acceptance area sits higher, near 1.34500–1.35000.
⸻
🎯 Forecast:
🔴 Bearish Invalidations:
• Price closing below 1.32860 with volume would invalidate this setup.
• That could signal continuation to deeper liquidity (1.32500 or below).
⸻
🧠 Smart Money Perspective:
• Liquidity engineered beneath support
• Trap Trigger activated — ideal for institutional reversal setups
• This is a classic “Stop Hunt → Reclaim → Expand” model

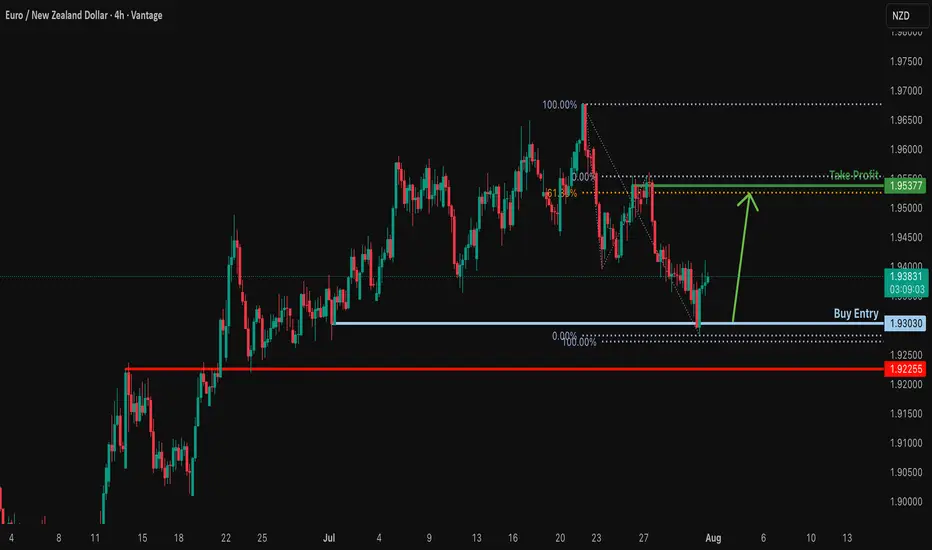
Bullish bounce off pullback support?EUR/NZD has bounced off the support level, which is a pullback support and could rise from this level to our take profit.
Entry: 1.93030
Why we like it:
There is a pullback support.
Stop loss: 1.92255
Why we like it:
There is an overlap support
Take profit: 1.95377
Why we like it:
There is a swing high resistance that lines up with the 61.8% Fibonacci retracement.
Enjoying your TradingView experience? Review us!
Please be advised that the information presented on TradingView is provided to Vantage (‘Vantage Global Limited’, ‘we’) by a third-party provider (‘Everest Fortune Group’). Please be reminded that you are solely responsible for the trading decisions on your account. There is a very high degree of risk involved in trading. Any information and/or content is intended entirely for research, educational and informational purposes only and does not constitute investment or consultation advice or investment strategy. The information is not tailored to the investment needs of any specific person and therefore does not involve a consideration of any of the investment objectives, financial situation or needs of any viewer that may receive it. Kindly also note that past performance is not a reliable indicator of future results. Actual results may differ materially from those anticipated in forward-looking or past performance statements. We assume no liability as to the accuracy or completeness of any of the information and/or content provided herein and the Company cannot be held responsible for any omission, mistake nor for any loss or damage including without limitation to any loss of profit which may arise from reliance on any information supplied by Everest Fortune Group.
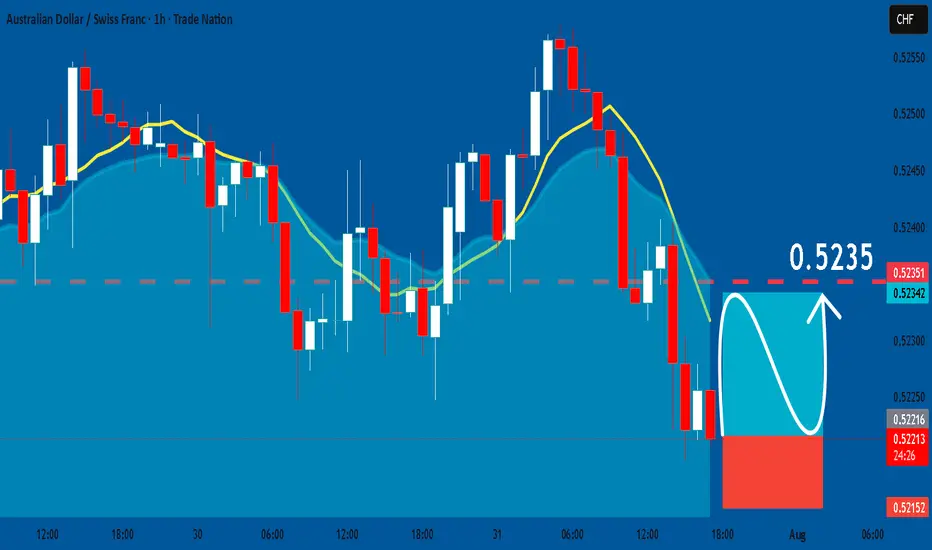
AUDCHF: Bullish Continuation & Long Signal
AUDCHF
- Classic bullish formation
- Our team expects pullback
SUGGESTED TRADE:
Swing Trade
Long AUDCHF
Entry - 0.5221
Sl - 0.5215
Tp - 0.5235
Our Risk - 1%
Start protection of your profits from lower levels
Disclosure: I am part of Trade Nation's Influencer program and receive a monthly fee for using their TradingView charts in my analysis.
❤️ Please, support our work with like & comment! ❤️