GOLD Will Move Lower! Sell!
Here is our detailed technical review for GOLD.
Time Frame: 9h
Current Trend: Bearish
Sentiment: Overbought (based on 7-period RSI)
Forecast: Bearish
The market is testing a major horizontal structure 3,337.68.
Taking into consideration the structure & trend analysis, I believe that the market will reach 3,280.02 level soon.
P.S
The term oversold refers to a condition where an asset has traded lower in price and has the potential for a price bounce.
Overbought refers to market scenarios where the instrument is traded considerably higher than its fair value. Overvaluation is caused by market sentiments when there is positive news.
Disclosure: I am part of Trade Nation's Influencer program and receive a monthly fee for using their TradingView charts in my analysis.
Like and subscribe and comment my ideas if you enjoy them!
Forex

NZDUSD H4 | Bearish drop off 50% Fibonacci resistanceNZD/USD is rising towards the sell entry, which serves as a pullback resistance and could potentially reverse lower.
Sell entry is at 0.5941, which is a pullback resistance.
Stop loss is at 0.5978, which is a pullback resistance that lines up with the 50% Fibonacci retracement.
Take profit is at 0.5896, which is a swing low support.
High Risk Investment Warning
Trading Forex/CFDs on margin carries a high level of risk and may not be suitable for all investors. Leverage can work against you.
Stratos Markets Limited (tradu.com ):
CFDs are complex instruments and come with a high risk of losing money rapidly due to leverage. 65% of retail investor accounts lose money when trading CFDs with this provider. You should consider whether you understand how CFDs work and whether you can afford to take the high risk of losing your money.
Stratos Europe Ltd (tradu.com ):
CFDs are complex instruments and come with a high risk of losing money rapidly due to leverage. 66% of retail investor accounts lose money when trading CFDs with this provider. You should consider whether you understand how CFDs work and whether you can afford to take the high risk of losing your money.
Stratos Global LLC (tradu.com ):
Losses can exceed deposits.
Please be advised that the information presented on TradingView is provided to Tradu (‘Company’, ‘we’) by a third-party provider (‘TFA Global Pte Ltd’). Please be reminded that you are solely responsible for the trading decisions on your account. There is a very high degree of risk involved in trading. Any information and/or content is intended entirely for research, educational and informational purposes only and does not constitute investment or consultation advice or investment strategy. The information is not tailored to the investment needs of any specific person and therefore does not involve a consideration of any of the investment objectives, financial situation or needs of any viewer that may receive it. Kindly also note that past performance is not a reliable indicator of future results. Actual results may differ materially from those anticipated in forward-looking or past performance statements. We assume no liability as to the accuracy or completeness of any of the information and/or content provided herein and the Company cannot be held responsible for any omission, mistake nor for any loss or damage including without limitation to any loss of profit which may arise from reliance on any information supplied by TFA Global Pte Ltd.
The speaker(s) is neither an employee, agent nor representative of Tradu and is therefore acting independently. The opinions given are their own, constitute general market commentary, and do not constitute the opinion or advice of Tradu or any form of personal or investment advice. Tradu neither endorses nor guarantees offerings of third-party speakers, nor is Tradu responsible for the content, veracity or opinions of third-party speakers, presenters or participants.

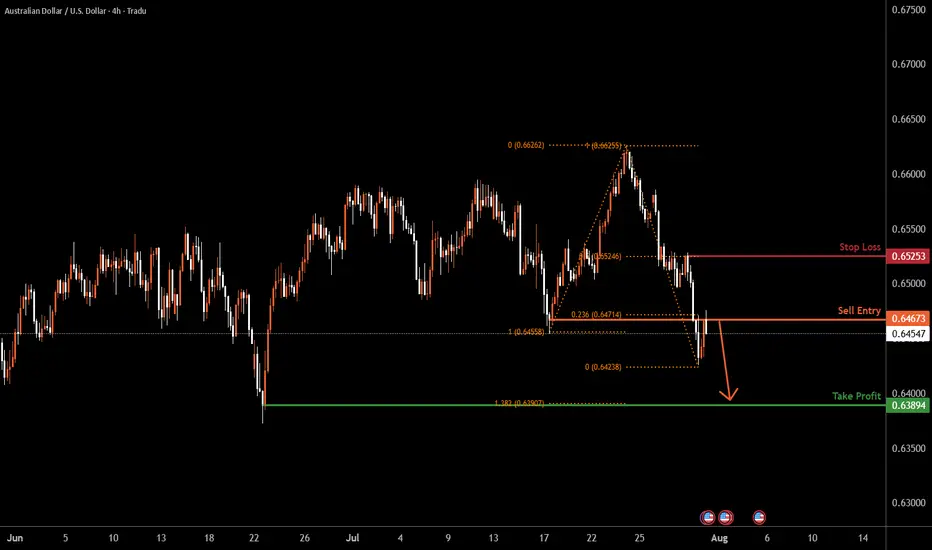
Aussie H4 | Bearish reversal off pullback resistanceBased on the H4 chart analysis, we can see that the price is reacting off the sell entry, which acts as a pullback resistance that aligns with the 23.6% Fibonacci retracement and could drop lower from this level.
Sell entry is at 0.6467, which is a pullback resistance that lines up with the 23.6% Fibonacci retracement.
Stop loss is at 0.6525, which is a pullback resistance that aligns with the 50% Fibonacci retracement.
Take profit is at 0.6389, which is a swing low support that aligns with the 138.2% Fibonacci extension.
High Risk Investment Warning
Trading Forex/CFDs on margin carries a high level of risk and may not be suitable for all investors. Leverage can work against you.
Stratos Markets Limited (tradu.com ):
CFDs are complex instruments and come with a high risk of losing money rapidly due to leverage. 65% of retail investor accounts lose money when trading CFDs with this provider. You should consider whether you understand how CFDs work and whether you can afford to take the high risk of losing your money.
Stratos Europe Ltd (tradu.com ):
CFDs are complex instruments and come with a high risk of losing money rapidly due to leverage. 66% of retail investor accounts lose money when trading CFDs with this provider. You should consider whether you understand how CFDs work and whether you can afford to take the high risk of losing your money.
Stratos Global LLC (tradu.com ):
Losses can exceed deposits.
Please be advised that the information presented on TradingView is provided to Tradu (‘Company’, ‘we’) by a third-party provider (‘TFA Global Pte Ltd’). Please be reminded that you are solely responsible for the trading decisions on your account. There is a very high degree of risk involved in trading. Any information and/or content is intended entirely for research, educational and informational purposes only and does not constitute investment or consultation advice or investment strategy. The information is not tailored to the investment needs of any specific person and therefore does not involve a consideration of any of the investment objectives, financial situation or needs of any viewer that may receive it. Kindly also note that past performance is not a reliable indicator of future results. Actual results may differ materially from those anticipated in forward-looking or past performance statements. We assume no liability as to the accuracy or completeness of any of the information and/or content provided herein and the Company cannot be held responsible for any omission, mistake nor for any loss or damage including without limitation to any loss of profit which may arise from reliance on any information supplied by TFA Global Pte Ltd.
The speaker(s) is neither an employee, agent nor representative of Tradu and is therefore acting independently. The opinions given are their own, constitute general market commentary, and do not constitute the opinion or advice of Tradu or any form of personal or investment advice. Tradu neither endorses nor guarantees offerings of third-party speakers, nor is Tradu responsible for the content, veracity or opinions of third-party speakers, presenters or participants.
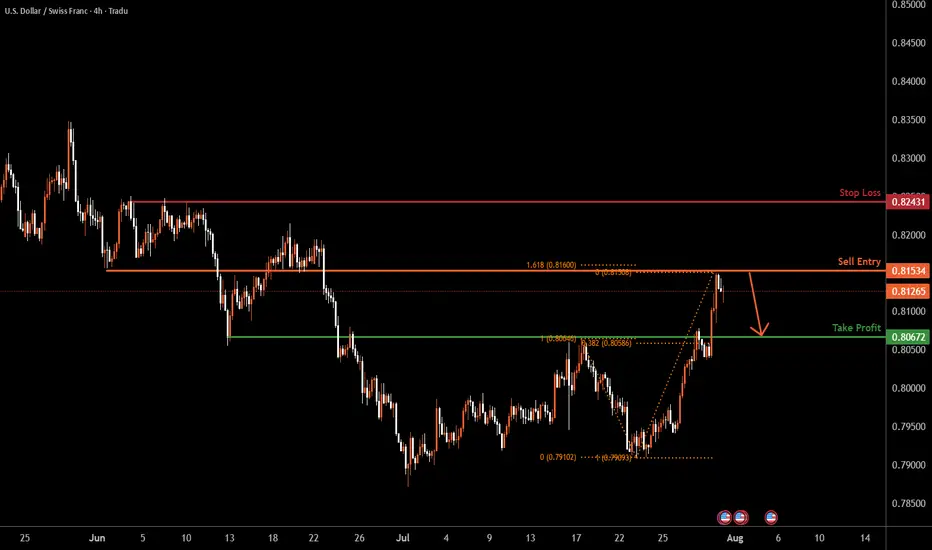
USDCHF H4 | Bearish reversalBased on the H4 chart analysis, we can see that the price has rejected off the sell entry and could drop from this level towards the take profit.
Sell entry is at 0.8153. which is a pullback resistance that lines up with the 161.8% Fibonacci extension.
Stop loss is at 0.8243, which is a swing high resistance.
Take profit is at 0.8067, which is an overlap support that lines up with the 38.2% Fibonacci retracement.
High Risk Investment Warning
Trading Forex/CFDs on margin carries a high level of risk and may not be suitable for all investors. Leverage can work against you.
Stratos Markets Limited (tradu.com ):
CFDs are complex instruments and come with a high risk of losing money rapidly due to leverage. 65% of retail investor accounts lose money when trading CFDs with this provider. You should consider whether you understand how CFDs work and whether you can afford to take the high risk of losing your money.
Stratos Europe Ltd (tradu.com ):
CFDs are complex instruments and come with a high risk of losing money rapidly due to leverage. 66% of retail investor accounts lose money when trading CFDs with this provider. You should consider whether you understand how CFDs work and whether you can afford to take the high risk of losing your money.
Stratos Global LLC (tradu.com ):
Losses can exceed deposits.
Please be advised that the information presented on TradingView is provided to Tradu (‘Company’, ‘we’) by a third-party provider (‘TFA Global Pte Ltd’). Please be reminded that you are solely responsible for the trading decisions on your account. There is a very high degree of risk involved in trading. Any information and/or content is intended entirely for research, educational and informational purposes only and does not constitute investment or consultation advice or investment strategy. The information is not tailored to the investment needs of any specific person and therefore does not involve a consideration of any of the investment objectives, financial situation or needs of any viewer that may receive it. Kindly also note that past performance is not a reliable indicator of future results. Actual results may differ materially from those anticipated in forward-looking or past performance statements. We assume no liability as to the accuracy or completeness of any of the information and/or content provided herein and the Company cannot be held responsible for any omission, mistake nor for any loss or damage including without limitation to any loss of profit which may arise from reliance on any information supplied by TFA Global Pte Ltd.
The speaker(s) is neither an employee, agent nor representative of Tradu and is therefore acting independently. The opinions given are their own, constitute general market commentary, and do not constitute the opinion or advice of Tradu or any form of personal or investment advice. Tradu neither endorses nor guarantees offerings of third-party speakers, nor is Tradu responsible for the content, veracity or opinions of third-party speakers, presenters or participants.
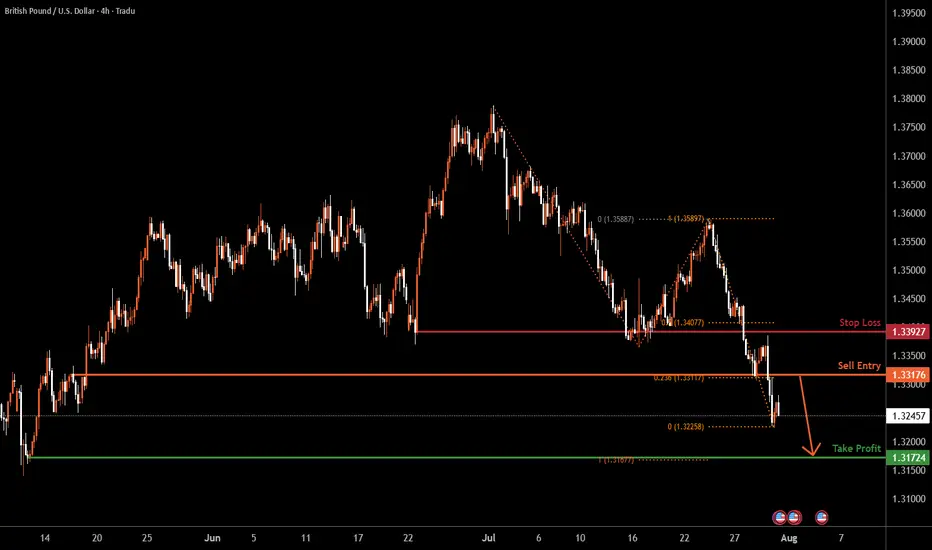
GBPUSD H4 | Bearish continuationThe Cable (GBP/USD) is rising towards the sell entry, which is a pullback resistance that aligns with the 23.6% Fibonacci retracement and could drop lower from this level.
Sell entry is at 1.3317, which is a pullback resistance that lines up with the 23.6% Fibonacci retracement.
Stop loss at 1.3392, which is a pullback resistance that is slightly below the 50% Fibonacci retracement.
Take profit is at 1.3172, which is a swing low support that aligns with the 100% Fibonacci projection.
High Risk Investment Warning
Trading Forex/CFDs on margin carries a high level of risk and may not be suitable for all investors. Leverage can work against you.
Stratos Markets Limited (tradu.com ):
CFDs are complex instruments and come with a high risk of losing money rapidly due to leverage. 65% of retail investor accounts lose money when trading CFDs with this provider. You should consider whether you understand how CFDs work and whether you can afford to take the high risk of losing your money.
Stratos Europe Ltd (tradu.com ):
CFDs are complex instruments and come with a high risk of losing money rapidly due to leverage. 66% of retail investor accounts lose money when trading CFDs with this provider. You should consider whether you understand how CFDs work and whether you can afford to take the high risk of losing your money.
Stratos Global LLC (tradu.com ):
Losses can exceed deposits.
Please be advised that the information presented on TradingView is provided to Tradu (‘Company’, ‘we’) by a third-party provider (‘TFA Global Pte Ltd’). Please be reminded that you are solely responsible for the trading decisions on your account. There is a very high degree of risk involved in trading. Any information and/or content is intended entirely for research, educational and informational purposes only and does not constitute investment or consultation advice or investment strategy. The information is not tailored to the investment needs of any specific person and therefore does not involve a consideration of any of the investment objectives, financial situation or needs of any viewer that may receive it. Kindly also note that past performance is not a reliable indicator of future results. Actual results may differ materially from those anticipated in forward-looking or past performance statements. We assume no liability as to the accuracy or completeness of any of the information and/or content provided herein and the Company cannot be held responsible for any omission, mistake nor for any loss or damage including without limitation to any loss of profit which may arise from reliance on any information supplied by TFA Global Pte Ltd.
The speaker(s) is neither an employee, agent nor representative of Tradu and is therefore acting independently. The opinions given are their own, constitute general market commentary, and do not constitute the opinion or advice of Tradu or any form of personal or investment advice. Tradu neither endorses nor guarantees offerings of third-party speakers, nor is Tradu responsible for the content, veracity or opinions of third-party speakers, presenters or participants.
EUR/GBP BULLS ARE STRONG HERE|LONG
EUR/GBP SIGNAL
Trade Direction: long
Entry Level: 0.863
Target Level: 0.872
Stop Loss: 0.857
RISK PROFILE
Risk level: medium
Suggested risk: 1%
Timeframe: 9h
Disclosure: I am part of Trade Nation's Influencer program and receive a monthly fee for using their TradingView charts in my analysis.
✅LIKE AND COMMENT MY IDEAS✅

#015: USD/CHF SHORT Investment OpportunityHello readers, I'm Forex Trader Andrea Russo, and today I'd like to share this SHORT investment opportunity I've identified in the USD/CHF pair.
In recent days, USD/CHF has exhibited typical technical exhaustion behavior near key dynamic resistance. The area between 0.81300 and 0.81650 represented a significant supply zone, previously tested with an extended spike and immediately rejected.
The price violated the 200 EMA with an apparent breakout, but without real institutional volume to support the move. This was followed by a rapid retracement below the mean and a sideways movement, suggesting ongoing manipulation and liquidity building.
Meanwhile, global retail sentiment shows a significant anomaly: over 70% of retail traders are long. This imbalance increases the likelihood that market makers are preparing a bearish reversal to target the most fragile positions and restore equilibrium.
The 0.81420 level has been identified as a key point for a possible price reversion to the manipulative zone before the actual directional move. If the price reverts to this level, a technical spike is likely to be executed to complete the hunt for stops before the downtrend begins.
The trade targets a decline towards the 0.80000 area, which represents the first significant level of technical support and a realistic target if the reversal is confirmed.

USD/CAD SHORT FROM RESISTANCE
Hello, Friends!
It makes sense for us to go short on USD/CAD right now from the resistance line above with the target of 1.376 because of the confluence of the two strong factors which are the general downtrend on the previous 1W candle and the overbought situation on the lower TF determined by it’s proximity to the upper BB band.
Disclosure: I am part of Trade Nation's Influencer program and receive a monthly fee for using their TradingView charts in my analysis.
✅LIKE AND COMMENT MY IDEAS✅

USD/CHF BEARS WILL DOMINATE THE MARKET|SHORT
Hello, Friends!
Bearish trend on USD/CHF, defined by the red colour of the last week candle combined with the fact the pair is overbought based on the BB upper band proximity, makes me expect a bearish rebound from the resistance line above and a retest of the local target below at 0.804.
Disclosure: I am part of Trade Nation's Influencer program and receive a monthly fee for using their TradingView charts in my analysis.
✅LIKE AND COMMENT MY IDEAS✅

NZD/USD SELLERS WILL DOMINATE THE MARKET|SHORT
Hello, Friends!
NZD-USD uptrend evident from the last 1W green candle makes short trades more risky, but the current set-up targeting 0.594 area still presents a good opportunity for us to sell the pair because the resistance line is nearby and the BB upper band is close which indicates the overbought state of the NZD/USD pair.
Disclosure: I am part of Trade Nation's Influencer program and receive a monthly fee for using their TradingView charts in my analysis.
✅LIKE AND COMMENT MY IDEAS✅

SILVER SENDS CLEAR BEARISH SIGNALS|SHORT
SILVER SIGNAL
Trade Direction: short
Entry Level: 3,820.7
Target Level: 3,794.3
Stop Loss: 3,837.9
RISK PROFILE
Risk level: medium
Suggested risk: 1%
Timeframe: 1h
Disclosure: I am part of Trade Nation's Influencer program and receive a monthly fee for using their TradingView charts in my analysis.
✅LIKE AND COMMENT MY IDEAS✅

Dow Jones Industrial Average (DJI) – 1H Chart Analysis 1. Structure: Broad Range Consolidation
Price remains within a wide horizontal range between 45,137 resistance and 43,792 support. This shows indecision and distribution at highs.
2. Key Rejection Zone
The yellow zone around 45,001–45,137 acted as a strong supply area. Multiple rejections indicate heavy selling interest here.
3. Mid-Zone Compression
Current price is hovering just below 44,765 resistance — acting as a decision point. Break above it may retest the supply zone; rejection could send price lower.
4. Demand Holding at 44,280
The strong bounce from 44,280.25 shows buyers defending this demand zone. It's the key support to watch for bulls.
5. Next Play
Bullish: Break and hold above 44,765 targets 45,001–45,137.
Bearish: Failure leads to 44,280, then 43,973 → 43,792.
Neutral bias unless a clean breakout confirms direction.

Sell the Rip? AUDUSD Retest Zone AlertHello TradingView Family / Fellow Traders. This is Richard, also known as theSignalyst.
📈AUDUSD has been overall bearish , trading within the falling red channel and it is currently retesting the upper bound of the channel.
Moreover, it is rejecting a structure marked in blue.
📚 As per my trading style:
As #AUDUSD approaches the red circle zone, I will be looking for trend-following sell setups on lower timeframes. (like a double top pattern, trendline break , and so on...)
📚 Always follow your trading plan regarding entry, risk management, and trade management.
Good luck!
All Strategies Are Good; If Managed Properly!
~Rich
Disclosure: I am part of Trade Nation's Influencer program and receive a monthly fee for using their TradingView charts in my analysis.

EURUSD breakdown alert – Will the drop accelerate?Hello traders, let’s take a look at how EURUSD is performing today!
Yesterday, EURUSD extended its downward slide after failing to sustain bullish momentum from the 1.1600 zone. The pair is now hovering around 1.1426.
The recent decline is largely attributed to the strength of the US dollar, which continues to benefit from a series of upbeat economic data – including robust job reports, strong consumer spending, and improving sentiment. All of these came in above expectations, pushing the dollar higher. In contrast, the European Central Bank (ECB) maintains a cautious stance, with no clear signals of policy changes – leaving the euro under persistent pressure.
From a technical standpoint, the short-term outlook suggests the beginning of a new bearish wave. Notably, price action is reacting to resistance from the nearby EMA 34 and EMA 89 levels. The break below the recent support zone has added fuel to the ongoing bearish momentum.
If the current support fails to hold, EURUSD could slip further toward the 1.272 Fibonacci extension at 1.1305, and potentially as low as 1.1178 – the 1.618 extension level.
Looking ahead, traders should focus on potential pullback opportunities, targeting SELL entries around 1.1540–1.1580 – a confluence zone of technical interest. However, if price breaks above the 1.1600 threshold and holds, this bearish scenario may be invalidated.
What’s your outlook for EURUSD in the coming days? Share your thoughts in the comments below!

GBPJPY: Important Demand Zone 🇬🇧🇯🇵
GBPJPY is trading within an important demand zone that
is based on a rising trend line and a horizontal support.
We see a false violation of that and a bear trap, followed
by a bullish imbalance candle.
I think that the pair may go up and reach at least 198.08 level.
❤️Please, support my work with like, thank you!❤️
I am part of Trade Nation's Influencer program and receive a monthly fee for using their TradingView charts in my analysis.

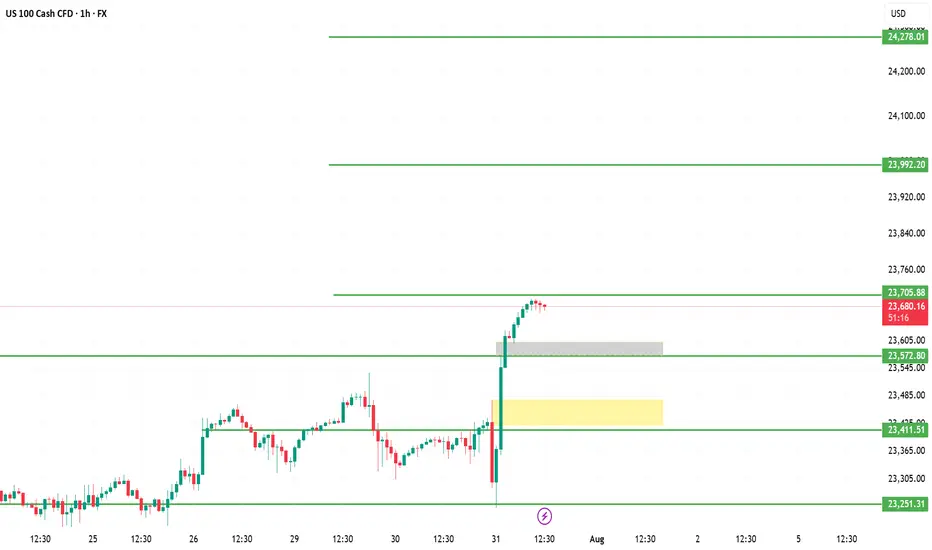
US100 (NASDAQ) Analysis – 1H Chart | July 31, 20251. Vertical Bullish Rally
Price exploded upward from 23,251 to 23,705 with strong bullish momentum and no meaningful retracement, indicating a short-term overbought scenario.
2. Fresh Supply at 23,705
The current candle shows hesitation just below 23,705.88 — forming a possible short-term top or reaction zone where sellers might step in.
3. Imbalance Zone Below
A visible Fair Value Gap (FVG) is left between 23,572–23,600 and the yellow highlighted demand zone (23,411) is untested. Price may revisit to fill that imbalance.
4. Projection: Pullback Possible
If price fails to break and hold above 23,705, we may see a pullback toward 23,600 → 23,411 before the next move.
5. Key Levels
Resistance: 23,705 → 23,992 → 24,278
Support: 23,572 → 23,411 → 23,251
Structure remains bullish unless 23,411 breaks.
USDCHF: Correction Ahead! 🇺🇸🇨🇭
I think that USDCHF is going to retrace after a test
of a major falling trend line on a daily.
As a confirmation, I found an inverted cup & handle pattern
on an hourly time frame.
Closest support - 0.81
❤️Please, support my work with like, thank you!❤️

GBPUSD extends to the downside. Wait for retest to sell✏️ OANDA:GBPUSD confirms the downtrend by breaking the trendline. The downtrend is still extending to lower areas because the GBPUSD bearish wave structure is very beautiful. Some selling momentum appears around the breakout zone of 1.339, which will form a bearish structure towards the support of 1.287 in the near future. Putting faith in the trendline at the moment is reliable.
📉 Key Levels
SELL zone 1.339-1.341
SELL DCA trigger: Break and trading bellow 1.317
Target 1.287
Leave your comments on the idea. I am happy to read your views.

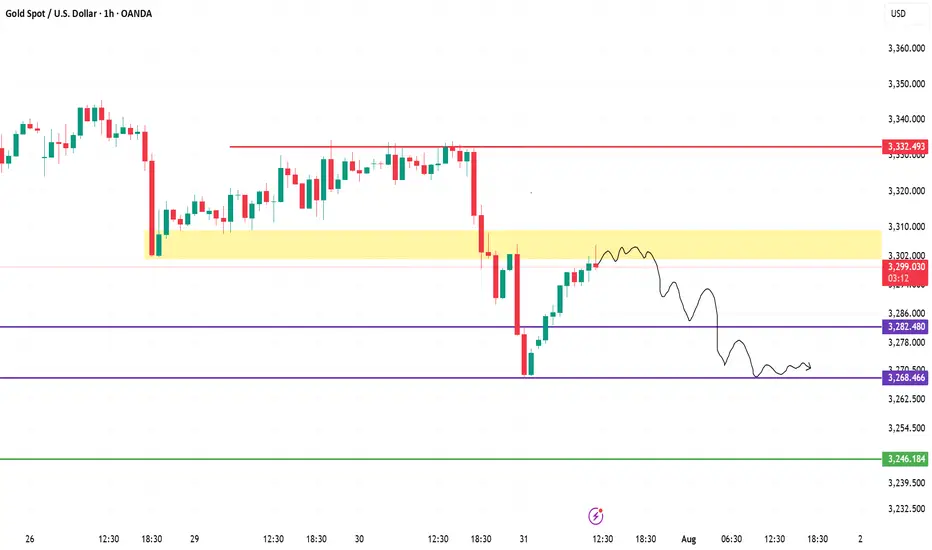
XAUUSD (Gold) Analysis – 1H Chart | July 31, 20251. Fakeout & Rejection from Supply
Price faced sharp rejection near the 3,332 resistance. The strong red candle indicates aggressive selling and liquidity grab.
2. Retest of Broken Demand Zone
Gold is now retesting the **3,298–3,305** yellow zone, which previously acted as demand but may now flip to resistance (supply).
3. Bearish Market Structure
The price formed a **lower high and lower low** pattern — a clear sign of downtrend resumption. Current bounce looks corrective.
4. Projection: Potential Drop Ahead
As per the drawn path, if price fails to reclaim above 3,305, a likely drop toward 3,282, then 3,268 is expected.
5. Key Levels to Watch
Resistance: 3,305 → 3,332
Support: 3,282 → 3,268 → 3,246
Bearish bias remains valid below 3,305.
Gold is Falling Sharply – Will It Keep Falling?Hello dear traders, what’s your view on XAUUSD?
Yesterday, XAUUSD continued its strong downtrend and is now trading around 3,296 USD.
The recent drop in gold is largely due to the strengthening U.S. dollar, following the Federal Reserve’s decision to hold interest rates steady as expected — despite sharp criticism from President Donald Trump.
Technically speaking, after breaking below the rising trendline, gold failed to retest successfully and plunged further, confirming that the bearish trend is now in control. Price is currently moving below key moving averages, and the structure has clearly formed a sequence of lower highs and lower lows — reinforcing the likelihood of continued downside.
If a pullback occurs before the next leg down, the Fibonacci 0.5 and 0.618 retracement zone — which aligns with the EMA 34 and 89 and a major resistance level — will be a key area to watch. This could present a prime opportunity for breakout and trend-following traders.
Looking ahead, the next key support sits near 3,220 USD. If this level breaks, gold may head toward the 3,162 USD zone.
What do you think? Will gold keep falling, or will buyers step in? Drop a comment and hit follow to catch the next big move!

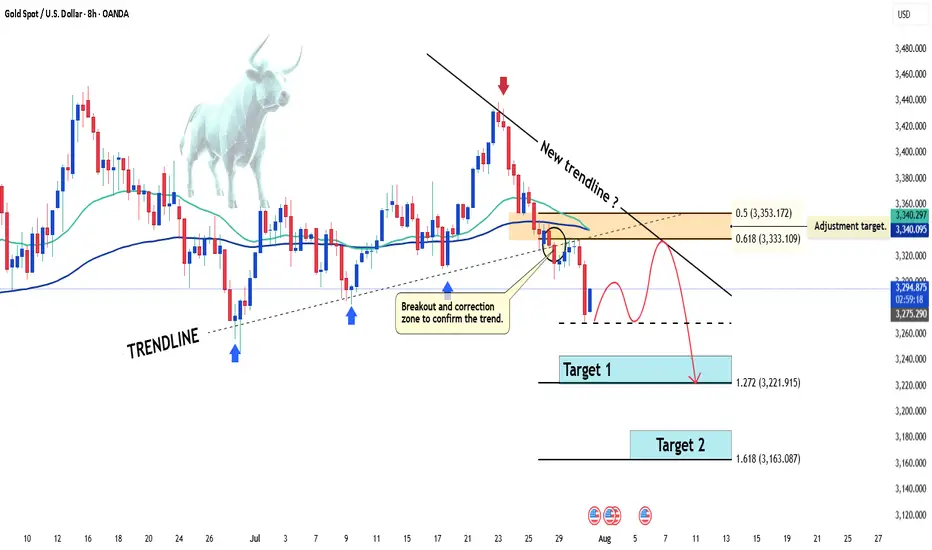
Gold price continues sharp declineHello everyone! Do you think gold will rise or fall? Let’s dive into the latest movements of this precious metal.
Just as we anticipated in yesterday’s strategy , gold has extended its downward move, with the bears firmly in control. The precious metal is currently trading around 3,290 USD, clearly signaling a short-term downtrend after breaking the ascending trendline that started in early July. Although there was a slight bounce, price remains capped below the key resistance zone of 3,333 – 3,350 USD, which coincides with the confluence of the 0.618 – 0.5 Fibonacci retracement and the EMA 34/89 — adding even more downside pressure.
The main reason behind this recent drop lies in the easing of trade tensions following the US-EU tariff agreement, which has significantly weakened gold’s safe-haven appeal. At the same time, the FOMC meeting yesterday failed to provide any bullish catalyst for gold. Even though the Fed is expected to keep rates unchanged, a single hawkish remark from Chair Powell was enough to intensify short-term selling pressure.
From a technical perspective, gold attempted to retest the broken trendline but failed, confirming the bearish structure. A new wave of correction could emerge soon, but the overall outlook remains tilted toward further downside.
My personal view:
Target 1 is at the 1.272 Fibonacci extension.
Target 2 lies at the 1.618 Fibonacci level — which could be the next destination.
And you — what do you think about this trendline break? Let’s discuss in the comments!
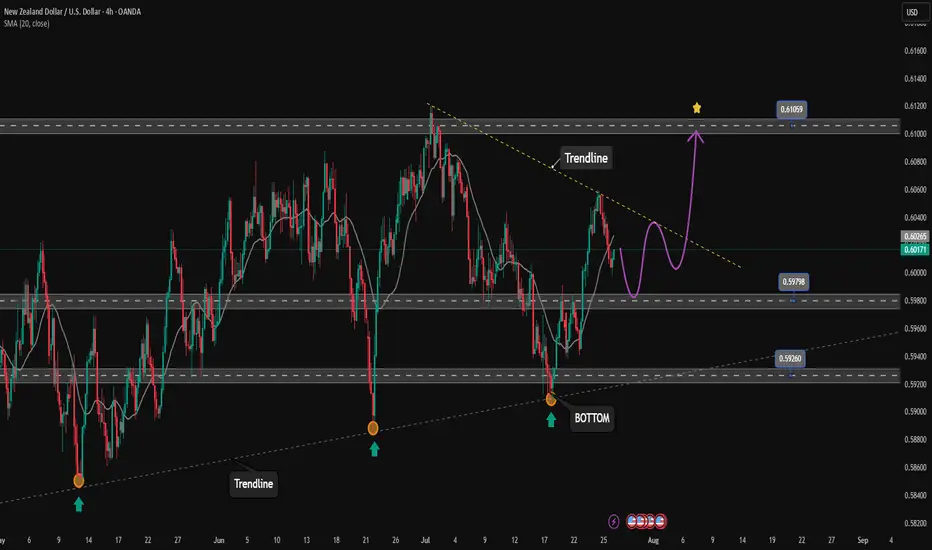
Price is heading towards the upper boundary of the price channel✏️ OANDA:NZDUSD is trading in a bullish wave on H4 chart towards the upper boundary of the ascending price channel. The trendline reaction to the support zone of 0.598 will form a nice corrective wave for the uptrend. If the nearest trendline is broken, the price will soon reach our take profit zone.
📉 Key Levels
Buy trigger: Reject and Trading above 0.598
BUY zone 0.592 ( vùng hỗ trợ biên dưới)
Target: 0.610
Leave your comments on the idea. I am happy to read your views.
Is the gold correction over?✏️Yesterday's D1 candle closed above the Breakout 3363 zone. This shows that the buyers in the US session are still strong. There is a possibility of a liquidity sweep in the Tokyo and London sessions, then in the New York session, Gold will recover and increase again. The uptrend is really broken when Gold confirms a close below 3345. In this case, we have to wait for 3320 to confirm the BUY point. The gold uptrend at this time also needs new momentum to be able to move towards ATH 3500.
📉 Key Levels
Support: 3345-3320
Resistance: 3373-3418
Buy zone: 3345 (bullish wave structure maintained); BUY DCA break 3373
Buy zone: 3320 (Strong support zone)
Target: 3417
Leave your comments on the idea. I am happy to read your views.
