EURUSD at Make-or-Break Zone: Time to Short?EURUSD – Key Data Out Today, Short Setup Confirmed?
Today, several important economic indexes were released for both the Euro(EUR) and the Dollar(USD) . Let’s break them down in a simple way:
Eurozone PMI Data: Mixed to Weak
France:
Manufacturing PMI: 48.4 (slightly lower than forecast)
Services PMI : 49.7 (flat, but below 50 = contraction)
Germany:
Manufacturing PMI: 49.2 (weaker than expected)
Services PMI : 50.1(slightly expansionary)
Eurozone Overall:
Manufacturing PMI: 49.8 (still below 50)
Services PMI : 51.2 (slightly stronger than forecast)
ECB left the Main Refinancing Rate unchanged at 2.15% , which was widely expected.
U.S. Data( TVC:DXY ): Strong and Surprising
Unemployment Claims: 217K (better than expected 227K)
Manufacturing PMI: 49.5 (below forecast of 52.7 – a negative surprise)
Services PMI: 55.2 (well above forecast and previous – bullish for USD)
Interpretation :
The Eurozone's growth remains sluggish, especially in France and Germany.
Despite a drop in U.S. manufacturing, the services sector remains strong, and unemployment data confirms labor market resilience.
This mixed picture slightly tilts the balance in favor of the U.S. dollar, especially as the ECB remains on hold while the Fed may still consider being restrictive.
Bias: Short EURUSD ( FX:EURUSD )
Fundamentals support a Short position in EURUSD, in line with the current technical setup.
---------------------------------
Now let's take a look at the EURUSD chart on the 4-hour time frame to find the best Short position .
EURUSD is currently trading in an Ascending Channel and at a Heavy Resistance zone($1.1845-$1.1602) .
Also, in terms of Elliott wave theory , it seems that EURUSD is completing a microwave 5 of the main wave 5 .
One of the most important supports ahead for EURUSD could be the 100_SMA(4-hour TF) .
If the currently 4-hour candlestick forms a Shooting Star Candlestick Pattern , it is a better sign for EURUSD to fall .
Also, we can see the Regular Divergence(RD-) between Consecutive Peaks .
I expect EURUSD to decline to at least $1.169 AFTER breaking the lower line of the ascending channel .
Second Target: Support zone($1.1642-$1.158) and Monthly Pivot Point.
Note: Stop Loss(SL)= $1.1850
Please respect each other's ideas and express them politely if you agree or disagree.
Euro/U.S. Dollar Analyze (EURUSD), 4-hour time frame.
Be sure to follow the updated ideas.
Do not forget to put a Stop loss for your positions (For every position you want to open).
Please follow your strategy and updates; this is just my Idea, and I will gladly see your ideas in this post.
Please do not forget the ✅' like '✅ button 🙏😊 & Share it with your friends; thanks, and Trade safe.
Forexanalysis

Short Opportunity on GBPUSD – Technical & Fundamentals AlignToday I want to look at the Short position opportunity in GBPUSD ( FX:GBPUSD ). So let's take a look at the GBPUSD pair from a fundamental and technical perspective.
Fundamental Analysis:
The British Pound remains under pressure due to growing expectations of a 25–50 bps rate cut by the Bank of England in early August. Markets are increasingly leaning toward easing as UK inflation hit 3.6% in June, the highest in over a year, while economic growth weakened and consumer confidence dropped to its lowest since early 2024
Ongoing fiscal concerns, including potential tax hikes and budget instability, continue to weigh on the pound. In contrast, the US Dollar( TVC:DXY ) remains relatively robust—supported by strong economic data and a safe-haven preference amid global uncertainty
Summary:
BoE easing becomes more likely due to weak UK data and inflation.
Fiscal risks and low consumer sentiment add downward pressure on GBP.
USD strength from solid data and safe-haven demand supports further GBPUSD downside.
-------------------------
In terms of technical analysis , in the 1-hour timeframe , GBPUSD is approaching the Resistance zone($1.356-$1.350) , the Potential Reversal Zone(PRZ) , and the 50_SMA(Daily) . Meanwhile, this return to Important Support lines could act as a pullback to these lines. Important support lines and 50_SMA(Daily) were broken last week.
In terms of Elliott Wave theory , GBPUSD appears to be completing a main wave 4 . Main wave 4 is likely to have a Zigzag Correction(ABC/5-3-5) .
I expect GBPUSD to start declining from the Potential Reversal Zone(PRZ) and reach the targets I have marked on the chart.
Note: Stop Loss(SL): 1.3575USD = Worst Stop Loss(SL)
Please respect each other's ideas and express them politely if you agree or disagree.
British Pound / U.S Dollar Analysis (GBPUSD), 1-hour time frame.
Be sure to follow the updated ideas.
Do not forget to put a Stop loss for your positions (For every position you want to open).
Please follow your strategy and updates; this is just my Idea, and I will gladly see your ideas in this post.
Please do not forget the ✅' like '✅ button 🙏😊 & Share it with your friends; thanks, and Trade safe.

XAUUSD Technical Analysis – Resistance Turned Support, 📈 XAUUSD Technical Analysis – Resistance Turned Support, Bullish Continuation Expected
Gold (XAUUSD) has shown strong bullish momentum after breaking above the key resistance zone around $3,400, which now appears to be acting as a new support level. This structure shift signals a classic break-and-retest scenario, commonly observed in bullish continuations.
🔍 Key Observations:
Structure Shift: Previous resistance near $3,400 has been broken with strong bullish candles, suggesting buyer dominance. This level is now expected to serve as support.
Bullish Momentum: The move from the $3,320 support zone to above $3,430 was accompanied by clear trend formation and clean market structure, indicating sustained momentum.
Retest in Progress: Price is currently pulling back toward the new support zone ($3,400). If this area holds, a bullish reaction is expected.
Next Target: If support at $3,400 holds as expected, price could rally back toward the next resistance and projected target of $3,460.
📚 Educational Insight:
This setup illustrates the principle of resistance becoming support (RBS)—a foundational concept in technical analysis. After a breakout, a successful retest of former resistance often provides a high-probability entry point for trend continuation trades.

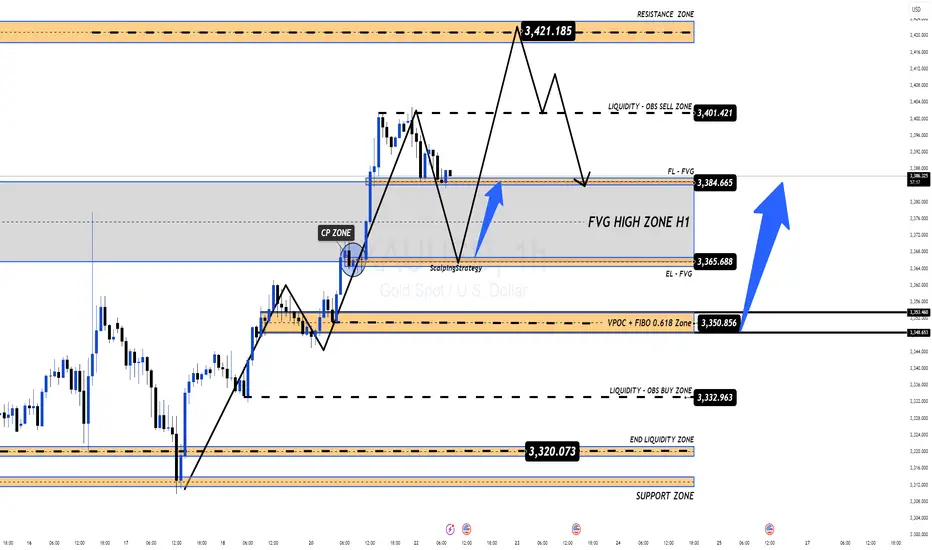
Gold 22/07 – Reversal in Sight After $3400? Watch These Key Zone XAUUSD – Intraday Market Outlook (22/07)
Gold posted a strong rally in the previous session, completing its short-term impulsive wave structure. However, as price approached the psychological resistance at $3400, it began to lose momentum, and a clear reversal candle appeared — a signal that today’s session may favour a pullback or correction.
🔍 Technical Overview
After printing a short-term top, gold is now retracing and has reached a critical support area: the FVG High Zone on the H1 chart. If bearish pressure continues and this level fails to hold, price is likely to drop further in search of deeper liquidity zones.
🔽 Key BUY Zones to Monitor Today
✅ Zone 1 – EL (End Liquidity within FVG): 3367 – 3350
→ A zone with strong potential for short-term rebounds due to previous liquidity sweeps.
✅ Zone 2 – Confluence of FIBO 0.5–0.618 + VPOC (3350 – 3335)
→ A technically significant area where multiple factors align — ideal for medium-to-long term entries.
📌 Trade Setup Ideas
🔸 BUY ZONE: 3351 – 3349
Stop Loss: 3344
Take Profit Targets:
3355 – 3360 – 3365 – 3370 – 3375 – 3380 – 3390 – 3400 – ???
🔸 BUY SCALP ZONE: 3366 – 3364
Stop Loss: 3360
Targets: 3370 – 3375 – 3380 – 3385 – 3390
🔻 SELL ZONE: 3420 – 3422
Stop Loss: 3427
Targets: 3415 – 3410 – 3405 – 3400 – 3390 – 3385
⚠️ Market Risk Reminder
While no major economic data is expected today, that doesn’t mean the market will stay calm. Unexpected volatility can still arise from geopolitical tensions or unscheduled central bank comments. Gold tends to compress and break out aggressively in low-news environments.
📌 Protect your capital with disciplined Stop Loss and Take Profit levels — no forecast is ever 100% certain.
📈 Strategic Outlook
Short-term bias: Market is likely to continue correcting
Medium to long-term plan: A deeper pullback could offer an excellent opportunity to build long positions from key demand zones, especially as markets begin to price in potential Fed rate cuts and gold continues its long-term bullish trend.
💬 Be patient, wait for confirmations, and trade with a clear plan — that’s what separates consistency from chaos.
USDJPY Analysis : Trendline Breakout, Liquidity Trap & MMC Zone🔍 Full Technical Breakdown:
In today’s USDJPY 2H chart, the market is unfolding exactly as per Mirror Market Concepts (MMC). We’ve identified a clean trendline breakout, and now price is reacting between the Central Zone (50%) and the Next Reversal Zone, where liquidity is expected to be filled. Let's break down each zone and movement to understand how price is being manipulated and where we can take action.
🔵 1. Trendline Confirmation – The First Sign of Strength
The trendline was tested multiple times from the top, acting as resistance. But recently, price broke above this line with strength, signaling a potential bullish reversal. You've rightly marked it as "Trendline Confirmation" — this is where structure shifted from bearish to bullish.
This is a classic MMC principle — breakout above manipulated resistance, followed by a pullback for re-entry.
The breakout wasn’t just a wick; it had body strength, indicating real buyer presence.
Now, price is pulling back to retest the trendline from above, a typical MMC behavior before continuing upward.
⚖️ 2. Central Zone – The 50% Trap
This zone represents the midpoint of the last major impulsive move. It's where most traders get confused, and institutions re-balance their entries.
You've highlighted: “It Can Reverse From Its 50% Zone” – and that’s accurate.
According to MMC, this is where smart money traps late sellers, takes liquidity, and initiates the next bullish leg.
If price holds above the 147.200–147.500 zone, we could see buyers stepping in aggressively.
🟩 3. Liquidity Fill – Next Reversal Zone
If price doesn’t hold the Central Zone, we don’t panic — this is where MMC becomes powerful.
Beneath current structure lies liquidity — previous stop hunts and unfilled orders.
That area is your Next Reversal Zone around 146.200–146.400.
It’s a liquidity trap — market might dip there just to manipulate emotional traders, then reverse with force.
This is exactly where you’ve written “Liquidity Will Fill” — meaning smart money might fill orders there before moving up.
🧭 Possible Price Paths:
🔼 Bullish Scenario (High Probability):
Trendline retest holds as support.
Price bounces from the 50% Central Zone.
Targets: 148.800 – 149.200 (previous highs and clean breakout zone).
Confirmation: Bullish engulfing candle or strong wick rejection at Central Zone.
🔽 Bearish Trap Scenario (MMC-Based):
Price dips below Central Zone into liquidity zone.
Traps sellers and triggers stop-losses.
Reverses sharply from Next Reversal Zone (Liquidity Zone).
This is where smart money positions themselves for the real move up.
🧠 MMC Insight:
This structure is textbook MMC – clean manipulation zones, false breakout traps, and a trending bias powered by smart liquidity plays.
Trendline breakout = initial intent
Central zone = confusion zone
Liquidity trap = entry for smart money
📢 The goal is not to predict, but to react with precision when the market reveals its hand.
🕒 Timeframe: 2H
📌 Strategy: Mirror Market Concepts (MMC) | Trendline + Liquidity + Midpoint Trap
📈 Bias: Bullish, but waiting for confirmation at either Central or Liquidity Zone
🔍 Sentiment: Cautiously Optimistic

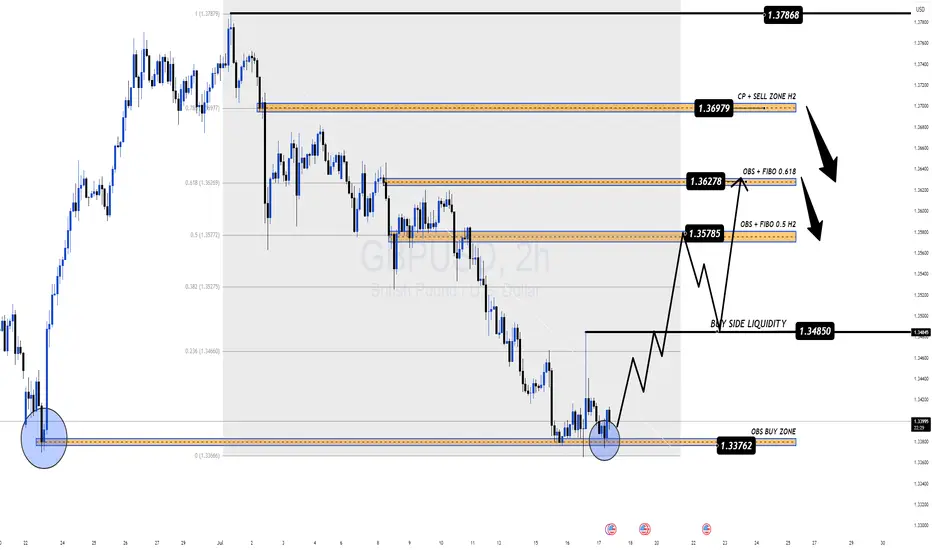
Sterling Rebounds But Faces Heavy Resistance Ahead GBP/USD Outlook – Sterling Rebounds But Faces Heavy Resistance Ahead
🌐 Macro Insight – UK Labour Data Mixed, Trump Headlines Stir Market
The British Pound (GBP) regained some lost ground against the U.S. Dollar after the UK labour market data revealed mixed signals:
Wage growth cooled as expected, suggesting a potential easing in inflationary pressures.
UK ILO Unemployment ticked up to 4.7%, raising concerns about labour market fragility.
Meanwhile, in the U.S., President Trump denied reports about firing Fed Chair Powell, briefly easing tensions and stabilizing USD demand.
With both currencies facing mixed narratives, GBP/USD is set for a pivotal move, and traders should stay alert to key liquidity zones and order blocks.
🔍 Technical Setup – MMF + Smart Money Framework
On the H2 chart, GBP/USD has reacted from the OBS BUY ZONE at 1.3376, bouncing with a bullish structure and forming a potential continuation pattern. Price is now expected to target key zones above, where significant order blocks and Fibonacci confluence reside.
⚙️ Key Resistance Zones:
1.3578 – 0.5 Fibonacci Retracement + OBS
1.3627 – 0.618 Fibonacci + Supply Zone
1.3697 – CP Continuation Pattern + H2 Order Block
These areas represent institutional interest for potential sell setups.
✅ Trade Plan for GBP/USD
🟢 BUY ZONE: 1.3376 – 1.3398
SL: 1.3360
TP: 1.3450 → 1.3485 → 1.3530 → 1.3578 → 1.3627
Look for bullish structure confirmation before entering. Target the next liquidity highs and imbalance zones.
🔴 SELL ZONE: 1.3627 – 1.3697
SL: 1.3735
TP: 1.3580 → 1.3530 → 1.3480
Watch for rejection and bearish divergence at supply areas to time potential swing shorts.
🧠 Strategy Notes
This setup combines MMF zones with institutional volume and price action concepts. The pair is currently reacting to a deep discount zone and may climb toward premium levels where selling pressure awaits. Be cautious during New York session volatility, especially with potential U.S. policy headlines and upcoming global inflation data.
🗨 What’s Next?
Are bulls ready to reclaim control or will resistance zones cap this recovery? Drop your ideas below and don’t forget to follow for more institutional-grade insights powered by MMF methodology.
EURGBP Bullish Setup Analysis – MMC + Volume Absorption + TargetIn today's EUR/GBP 30-minute chart, we can clearly observe a well-structured Market Maker Cycle (MMC) in play, accompanied by Smart Money concepts such as volume absorption, minor BOS (Break of Structure), and reversal zone identification. Let’s walk through the technical story unfolding:
🧠 Step-by-Step Breakdown:
🟣 1. Reversal Zone & QFL (Quasimodo Failed Level) Formation
The price made a sharp decline, which trapped retail sellers chasing the breakout to the downside.
This drop landed into a key reversal zone — a price pocket where Smart Money often steps in for accumulation.
The QFL structure is evident here, showing a previous demand zone break and then recovery — classic stop-loss hunting behavior followed by institutional positioning.
This is often considered the “Spring” or “Manipulation” phase in Wyckoff or MMC theory.
🟩 2. Volume Absorption & Compression Phase
After tapping into the reversal zone, price action entered a tight compression range, forming a wedge/triangle.
During this phase, volume absorption is clearly visible — large players are absorbing selling pressure without letting price drop further.
This is a signal of re-accumulation. Buyers are loading up while keeping the price suppressed to mislead retail traders.
You’ve rightly labeled this phase as “Structure Mapping + Volume Absorption” — a textbook Smart Money behavior prior to breakout.
🔓 3. Minor Breaks of Structure (BOS)
As price consolidates, we begin to see Minor BOS— subtle shifts in structure where previous highs are taken out.
These BOS levels are confirmation that demand is outweighing supply.
Once we break multiple minor highs, it shows that buyers are now in control — hinting at the transition from Accumulation → Expansion.
📈 4. Projected Next Reversal + Breakout Scenario
The marked Next Reversal Zone above (around 0.8680–0.8695) is where we can expect the first true breakout and major expansion.
If price enters this area with increased volume, it validates that Smart Money is pushing into the Markup Phase of the MMC.
After the breakout, we could see price push toward 0.8710 and above.
📊 5. Market Maker Cycle (MMC) Summary
What we’re seeing here is a full-scale MMC pattern unfolding:
Manipulation (QFL trap ) → Accumulation (Volume absorption) → Structure Shift (Minor BOS) → Expansion (Reversal breakout)
This is the kind of setup that offers high-probability entries for those who understand Smart Money dynamics and wait for confirmation.
🎯 Key Levels to Watch:
Reversal Support Zone: 0.86450 – 0.86500
Breakout Target Zone: 0.86800 – 0.86950
Final Target (Swing): 0.87100+
🧠 Final Thoughts:
This EUR/GBP setup shows everything we love to see:
Liquidity taken ✅
Structure forming ✅
Volume building ✅
BOS confirming ✅
Expansion pending 🔜
Be patient. Let Smart Money reveal their hand through price action and volume confirmation.

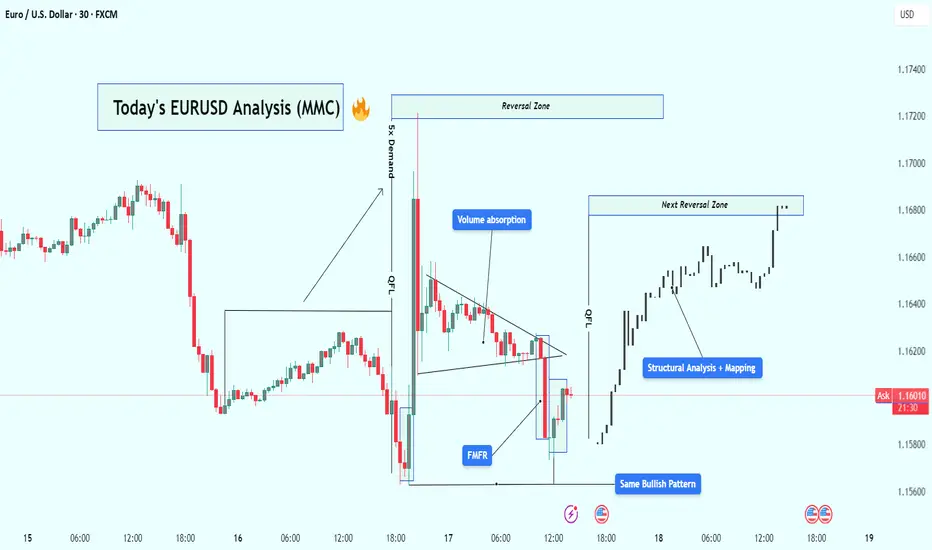
EUR/USD Analysis : Bullish Reversal – Volume Absorption & Target🧠 Market Overview:
EUR/USD has followed a flawless Market Maker Cycle, moving from manipulation to expansion. The chart shows institutional behavior through liquidity grabs, volume absorption, and structural breaks, confirming that big players are in full control.
The current price action signals bullish strength targeting the next high-probability reversal zone, but let’s break this down from the very beginning.
🔍 Key Chart Phases and Insights:
1️⃣ Massive Bearish Impulse – Liquidity Sweep Phase
At first glance, the chart shows an aggressive drop — a strong bearish leg that looks like market weakness.
❗ But in reality, this is the liquidity sweep phase. Here’s what likely happened:
Price ran below key lows
Hit stop losses of early buyers
Created “fake” bearish sentiment
Built sell-side liquidity for institutions to buy from
🔑 This isn’t weakness — it’s a setup.
2️⃣ FMFR (Final Move for Reversal) + Instant Reaction
At the end of that drop, the market printed a sharp bullish engulfing candle from the lows — this is known as the Final Move for Reversal (FMFR).
This marks:
The end of the accumulation phase
Entry of smart money into the market
The beginning of a new bullish cycle
The size and speed of this move indicate high-volume orders were filled — classic sign of institutional presence.
3️⃣ 5x Demand Push – Start of Expansion Phase
After the FMFR, price explodes upward with 5 consecutive bullish candles. This is your expansion phase — the market is moving fast, breaking structure, and flipping direction.
Key takeaways from this leg:
Strong displacement confirms a new trend
High momentum candles reflect institutional interest
Price breaks above previous structure levels
📈 This is no longer random — it’s planned and executed by bigger players.
4️⃣ Volume Absorption in Tight Wedge – Smart Money Re-Accumulation
After the breakout, price doesn’t just continue flying — instead, it compresses in a tight triangle. This is a key phase called volume absorption or re-accumulation.
What’s happening here:
Institutions are absorbing retail orders
Low volume = no resistance = easier breakout
Price is “charging” before the next move
🔋 Think of this like coiling a spring — it’s getting ready to pop again.
5️⃣ Bullish Pattern Repeats – MMC Confirmed
Interestingly, we now see the same bullish pattern forming again on the right side of the chart, similar to the first FMFR.
This is powerful because:
Pattern repetition means consistent order flow
Smart money is using the same blueprint
It gives us confidence to follow the trend
⚠️ When the same bullish setup happens twice — it’s not by chance.
6️⃣ Structural Mapping – Road to Reversal Zone
On the far right, we’ve entered clean bullish structure, making higher highs and higher lows.
We are now targeting:
The next Reversal Zone near 1.16800
This zone could act as resistance or another trap
A strong reaction from this zone can trigger either profit-taking or short-term reversal
Price is currently in the "continuation" part of MMC, heading toward premium levels.
📈 Trading Plan Based on This Setup:
✅ Primary Bullish Plan:
Price respects current structure
Breaks minor highs with strong volume
Entry on retracement to broken structure
Target: 1.16800 reversal zone
⚠️ Alternate Bearish Setup (If Price Rejects Reversal Zone):
Sharp rejection from reversal zone
Break of structure (BOS) on lower timeframe
Entry on lower high retest
Target: Liquidity areas below 1.16200
🧵 Conclusion:
This EUR/USD chart is a blueprint of institutional market flow. From the liquidity sweep, to volume absorption, to repeating bullish patterns, we’re seeing a textbook Market Maker Cycle (MMC) play out.
Here’s what makes this chart powerful:
✔️ Volume confirms structure
✔️ Reversal zones are clearly defined
✔️ Same bullish pattern = smart money roadmap
✔️ Trade setups are clean with defined risk
✅ This is the kind of setup you wait days for — don’t rush, follow structure, and execute with confirmation.
AUDNZD Breakout: Long Opportunity in Ascending ChannelToday I want to share with you a Long position opportunity in AUDNZD ( OANDA:AUDNZD ).
Let's first take a brief look at the AUDNZD fundamentals .
RBNZ kept rates at 3.25% , signaling likely further cuts in August.
RBA paused at 3.60% , but dovish bias remains; markets expect more easing ahead.
As NZD is more pressured by immediate rate cuts than AUD, the fundamental setup favors a bullish AUDNZD.
Now let's find a long position for AUDNZD using technical analysis .
AUDNZD seems to have managed to break through the Heavy Resistance zone(1.0963 NZD-1.0870 NZD) and is moving near the Support zone(1.0964 NZD-1.0954 NZD) on the 1-hour time frame .
AUDNNZD is also moving in an Ascending Channel .
I expect AUDNZD to rise at least to the Resistance lines , the second target is the Resistance zone(1.103 NZD-1.0993 NZD).
Note: Stop Loss(SL): 1.0944 NZD
Please respect each other's ideas and express them politely if you agree or disagree.
Australian Dollar/New Zealand Dollar Analyze (AUDNZD), 1-hour time frame.
Be sure to follow the updated ideas.
Do not forget to put a Stop loss for your positions (For every position you want to open).
Please follow your strategy and updates; this is just my Idea, and I will gladly see your ideas in this post.
Please do not forget the ✅' like '✅ button 🙏😊 & Share it with your friends; thanks, and Trade safe.

EURUSD Under Pressure After Hot CPI – More Downside Ahead?Today, the US released key inflation figures :
Core CPI m/m: 0.2% (vs 0.3% forecast)
CPI m/m: 0.3% (as expected)
CPI y/y: 2.7% (vs 2.6% forecast, up from 2.4%)
Fundamental Analysis ( EURUSD ):
The slightly lower Core CPI suggests some easing in underlying inflation pressures. However, the headline CPI y/y came in hotter than expected at 2.7%, reinforcing the idea that the Fed is not yet ready to ease policy aggressively.
This combination supports the US dollar, as sticky inflation could delay rate cuts.
EURUSD is likely to remain under pressure in the short term unless the ECB signals a more hawkish stance or US data starts showing broader weakness.
Now let's move on to the technical analysis of EURUSD ( FX:EURUSD ) on the 4-hour timeframe .
EURUSD is trading in a Heavy Resistance zone($1.1802-$1.1602) , having simultaneously managed to break the Support lines and the lower line of the Descending Channel , and is also trying to break the Support zone($1.1642-$1.1578) .
I expect EURUSD to continue its downtrend and decline to the Support zone($1.1549-$1.1520) at the first target .
Second target : $1.15043
Third target : $1.1464
Note: Stop Loss(SL)= $1.1660
Please respect each other's ideas and express them politely if you agree or disagree.
Euro/U.S. Dollar Analyze (EURUSD), 1-hour time frame.
Be sure to follow the updated ideas.
Do not forget to put a Stop loss for your positions (For every position you want to open).
Please follow your strategy and updates; this is just my Idea, and I will gladly see your ideas in this post.
Please do not forget the ✅' like '✅ button 🙏😊 & Share it with your friends; thanks, and Trade safe.

GBP/USD – Uptrend Channel Analysis!GBP/USD is trading inside a strong uptrend channel on the 4-hour chart.
Recent price action confirmed a Break of Structure (BOS), signaling solid bullish control.
Buyers have pushed price firmly above previous resistance zones.
Price is now near the upper boundary of the channel.
Signs of short-term exhaustion suggest a likely retracement ahead.
A pullback into the retracement level or channel midline would offer better risk-reward.
Key Levels to Watch:
Channel support for potential bounce.
Retracement zone as a buy opportunity.
Trade Plan:
Wait for a clean retracement toward support.
Look for bullish confirmation before entering long.
Avoid chasing highs – focus on discounted entries.
Bias: Bullish while price holds the uptrend channel structure.
Expect continuation after healthy correction.
Patience is critical – let the market set up a quality entry.
Traders should align with the dominant trend and manage risk carefully.
Like, comment, share, and follow for more trading ideas.

NZDUSD Pullback in Play – Head & Shoulders Signals More DownsideNZDUSD ( OANDA:NZDUSD ) is currently trading near the Resistance zone($0.612-$0.605) and has also managed to break the Support zone($0.604-$0.602) . We consider the Support zone as the neckline of the Head and Shoulders Pattern .
In terms of classic technical analysis , NZDUSD has managed to form a Head and Shoulders Pattern .
I expect NZDUSD to decline towards the Support zone($0.5968-$0.5946) after completing the pullback .
Note: Stop Loss(SL): $0.6062
Please respect each other's ideas and express them politely if you agree or disagree.
New Zealand Dollar/ U.S. Dollar Analyze (NZDUSD), 1-hour time frame.
Be sure to follow the updated ideas.
Do not forget to put a Stop loss for your positions (For every position you want to open).
Please follow your strategy and updates; this is just my Idea, and I will gladly see your ideas in this post.
Please do not forget the ✅' like '✅ button 🙏😊 & Share it with your friends; thanks, and Trade safe.

DXY Weekly Update — July 14, 2025⌛ Timeframe:
.
📆 Analysis Date: July 14, 2025
.
🎯 Weekly Bias: Bearish-to-Neutral (Potential for retracement or reversal)
🔎 Market Overview:
⬇️ Persistent USD Weakness:
DXY has dropped nearly 10% YTD, marking the steepest half-year decline since 1986.
📉 Rate Cut Expectations:
Markets are pricing in a potential 75bps rate cut by the Fed in H2 2025, pushing yields and the dollar lower.
📦 Trade War Fears:
Renewed tariff risks (targeting EU, Japan, Mexico, South Korea) aren't boosting demand for USD — a signal of lost safe-haven appeal.
⚖️ Central Bank Diversification:
Global reserve managers are rotating into gold and away from USD, weakening long-term structural demand.
🌀 Sentiment & Risk Appetite:
💸 Liquidity Demand is Soft:
DXY is retesting a 4H fair value gap (97.10–97.30), suggesting potential short-term consolidation or correction.
🌍 Risk-On Mood Returns:
According to Goldman Sachs, the USD is trading more like a "risk asset" than a haven, aligning with rising equity appetite.
📉 Technical Landscape:
🟠 4H Structure:
If DXY breaks below 97.00, next support lies at 96.37, followed by 95.50–96.00.
Consolidation expected if price remains within the FVG.
🔻 Key Resistance:
97.70–98.20 zone. A break above this area could change the tone to bullish.
📌 Summary:
🔷 Fundamentals show long-term dollar weakening (rates, trade tension, reserve shifts)
🔷 Sentiment aligns with risk-on appetite and reduced USD demand
🔷 Technicals at critical level; break below 97.00 opens room for correction, break above 97.70 shifts bias bullish
.
.
.
.
🟠 Bias: Bearish to Neutral
Watch Levels: 97.00 support, 97.70–98.20 resistance
⚠️ Note: This analysis is for educational purposes only and is not financial advice. Always apply risk management.
✅ If you like this analysis, don't forget to like 👍, follow 🧠, and share your thoughts below 💬!

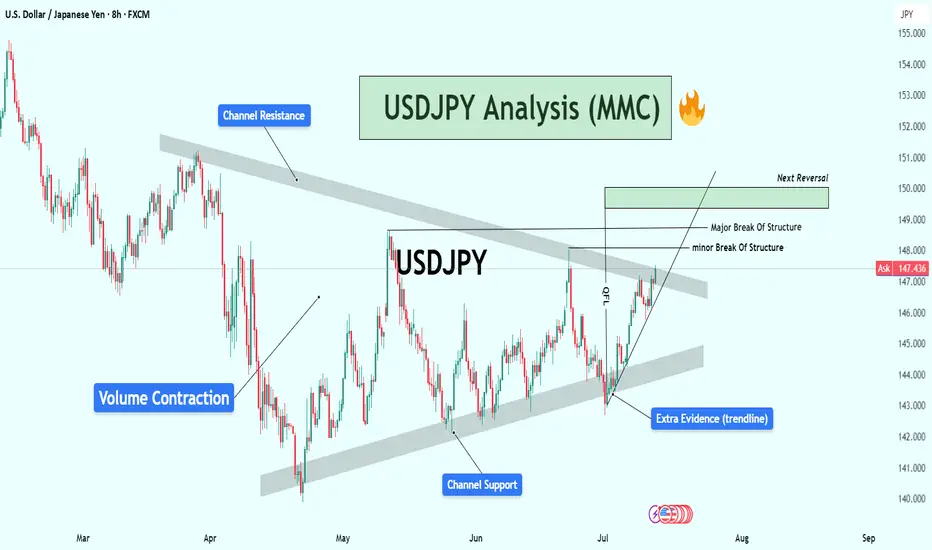
USDJPY Analysis : Major Move Loading Towards Target Zone🕵️♂️ Overview
The USDJPY pair is approaching a critical turning point within a well-established descending channel structure. After several months of corrective movement and internal structure shifts, the market is now displaying multiple layers of confluence pointing toward an impending major reaction or reversal. Let’s break down this chart step by step.
🧱 Market Structure Analysis
🔹 Descending Channel:
The entire chart is governed by a broad descending channel, with price making lower highs and lower lows since early March.
Each touch of the channel support has led to a bounce, and the price is now once again near channel resistance, creating a possible reaction zone.
🔹 Volume Contraction Phase:
In the mid-section of the chart, we observe volume contraction, indicating liquidity drying up and buyers/sellers entering a phase of uncertainty.
This contraction is typical in accumulation or re-accumulation phases, which often precede strong impulsive moves — exactly what followed here.
🧩 Structural Breaks and Trendline Clarity
🔸 Minor Break of Structure:
A recent high was taken out in early July, marking a minor break of structure (BOS), showing the first signs of bulls taking short-term control.
🔸 Major Break of Structure:
A more significant high (marked on the chart) has also been broken, confirming a major BOS — this implies institutional positioning or a shift in market sentiment.
🔸 Trendline Break – Extra Confirmation:
The bullish push came after breaking a clean internal trendline, which acted as diagonal resistance.
Once this trendline broke, price aggressively accelerated upward — this is a classic market maker cycle (MMC) Phase 2 (expansion) move.
📍 Confluence at Next Reversal Zone (149.00 – 150.00)
The green highlighted zone is the next potential area for bearish pressure to return, based on:
Key Supply Zone: Historical area where sellers previously dominated.
Channel Resistance Confluence: Top of the descending channel aligns with this zone.
Psychological Level: 150.00 is a major psychological round number — often attracts profit-taking and institutional activity.
Fibonacci (if plotted): Likely 78.6% – 88.6% retracement from last swing high.
Overextended Rally: Price has rallied strongly since early July with very little correction — it’s approaching exhaustion.
🔄 Market Maker Cycle (MMC) Alignment
This move perfectly reflects the Market Maker Cycle:
Accumulation: During volume contraction phase.
Manipulation: Fakeouts near channel support to trap shorts.
Expansion: Break of structure + trendline, aggressive rally.
Distribution (Next): Likely to occur at the 149–150 zone with a sharp rejection.
🧠 Trader’s Plan – What to Look For
📈 If Bullish:
Targets: 148.80 to 149.80 zone
Hold until rejection signs (bearish candles, volume spikes, divergences)
SL: Below recent swing low/trendline (~146.00)
📉 If Bearish (After Rejection):
Watch for:
Strong bearish engulfing candle or shooting star
RSI/MACD divergence (not shown but suggested)
Break of short-term ascending trendline
Targets: Back toward 145.50 or mid-channel (dynamic)
🔖 Summary
USDJPY is showing clear signs of bullish exhaustion near the upper channel resistance and major structure levels. If price respects this zone (149–150), expect a healthy corrective leg or full reversal. Multiple layers of technical evidence, including structure breaks, trendline breach, and MMC phases, are aligning for a high-probability play.
This is a textbook setup for experienced traders watching key zones with proper confirmations.
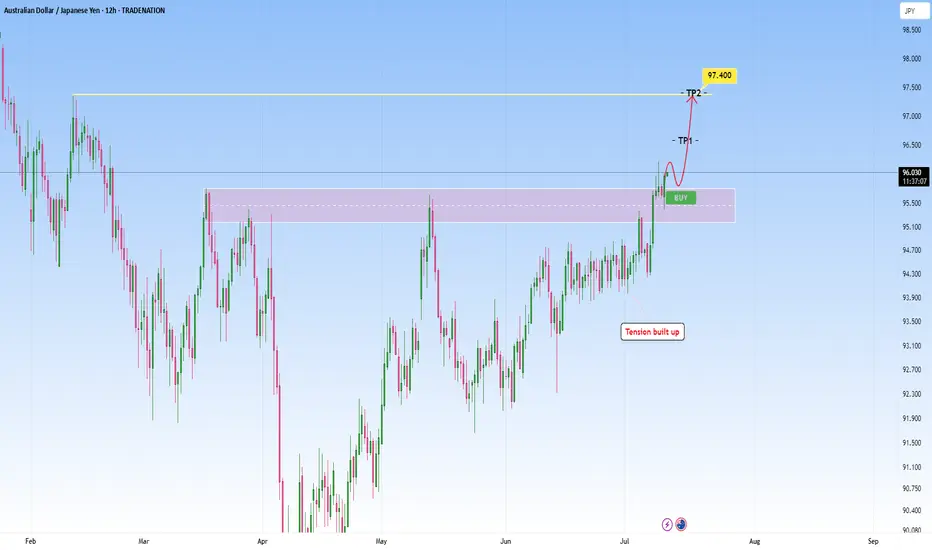
AUDJPY Technical Breakout - Targeting 97.400 Next?TRADENATION:AUDJPY has recently broken decisively above a key resistance zone that had previously capped price for several months. This breakout was preceded by a period of compression and range-bound price action, where bullish momentum steadily built up, indicated by higher lows pressing against the resistance level. This type of structure typically leads to an explosive breakout, which we are now seeing unfold.
After the breakout, price came back for a clean retest of the broken resistance zone, which has now flipped into support. The retest held firmly, suggesting strong buyer interest at this level and confirming the validity of the breakout.
With this structure in place, the bullish momentum is likely to extend further toward the next target zone around 97.400, provided price remains above the current support.
As long as the price holds above the retested zone, the bullish outlook remains intact. A breakdown back below this area, however, would be a warning sign and could open the door to a deeper pullback.
Remember, always wait for confirmation before entering trades, and maintain disciplined risk management.
Bitcoin Breakout Watch – BTC/USD UpdateBTCUSD is currently consolidating above the $112,000 level — a critical price zone that could mark the beginning of a new leg higher.
If this consolidation holds, it signals strong buyer interest and sets the stage for a potential breakout. The next major target lies at $120,000, aligning with the 161.8% Fibonacci extension, a key level often associated with explosive momentum moves.
💡 This setup reflects growing confidence in the crypto space and may attract institutional inflows if confirmed.

USDJPY Structural Analysis : Breakout Demand Play + Target🗺️ Market Structure & Key Technical Zones
On the USDJPY 4-hour timeframe, the market is clearly respecting smart money levels and giving us an ideal case study of institutional demand, trend continuation, and liquidity engineering.
🔰 1. Major Support Zone (142.500 – 143.200):
This zone acted as a high-value area where price consolidated previously before rallying. It has been tested multiple times and each touch has led to a strong bullish reaction, indicating accumulation by large players.
Think of this zone as the market’s base camp — when price visits it, big money steps in to reload longs.
🔰 2. Channel Formation & Breakout:
A clean bullish channel formed mid-June, with price respecting both bounds while gradually climbing. Once the channel was broken with strong volume (noted by the breakout candle), it suggested a shift from controlled bullish flow to an impulsive move — a change in pace that often indicates smart money is active.
🧱 Institutional Concepts in Action
🔵 QFL (Quick Flip Level):
This area marks a prior consolidation or sideways action that gets aggressively broken. In this chart, price dipped to a QFL zone then sharply reversed — suggesting a trap for early shorts and a liquidity grab before moving up. A classic “manipulation → accumulation → expansion” sequence.
🟦 Breaker Demand (BR Demand):
This is where previous resistance has flipped into new support. Breaker blocks are extremely important in identifying where institutions may re-enter positions. Price respected this area before continuing higher — confirming bullish control.
Price tapped into this BR demand, showed low-wick rejections, and moved strongly, signaling confidence from large orders.
📊 Volume Burst Zone (~147.2–147.7):
This zone has historically seen high volume and sudden price acceleration. Price is re-approaching it now. This is where a lot of pending orders and take-profits are likely clustered — expect strong reactions here.
📈 Current Price Action
Price is climbing along a clean bullish trendline, reinforcing current momentum.
Price has broken previous structure highs and is now making higher highs and higher lows — a textbook bullish trend.
Buyers are in control as long as the price continues to respect:
The bullish trendline
The BR demand zone (~145.5)
🔮 Projection & Potential Scenarios
🟢 Bullish Continuation Case:
If current momentum holds, the price is likely to push toward the Next Reversal Zone (148.500–149.000).
This zone aligns with multiple confluences:
Fibonacci extension targets
Previous high liquidity trap zone
Potential institutional profit-taking level
Expect this zone to cause a reversal or deep pullback.
🔴 Bearish Breakdown Case:
If price breaks below the BR Demand Zone and closes under the trendline, expect a drop back toward the Central Zone (~144.8–145.0), or even deeper into the Major Support Zone.
This would shift market structure back to neutral or bearish depending on volume and rejection patterns.
📌 Summary:
✅ Bias: Bullish
🎯 Short-Term Target: 147.5 (volume burst area)
🧱 Key Support: 145.50 (breaker demand)
❗ Trendline Break = Red Flag
🏁 Final Reversal Zone: 148.500–149.000
💬 Final Thoughts
This chart is a brilliant example of smart money accumulation and market engineering. USDJPY continues to respect well-defined zones, presenting high-probability opportunities for traders who understand structure and patience.
This setup is NOT about chasing price — it's about following the footprints of volume, breakout structure, and institutional intent. Stick to the plan and manage risk around key invalidation zones.

EURUSD 4H Structure Analysis | MMC Strategy + Channel + CurveIn this EURUSD 4-hour chart analysis using MMC (Market Mind Concept), we are observing a textbook rising channel structure accompanied by a black mind curve (evidence of psychological support behavior). Let's break it down:
📊 Structure Overview:
Straight Ascending Channel:
Price has been respecting a clean, straight rising channel, forming higher highs and higher lows over the past several weeks. This structure provides a controlled bullish bias, but we are approaching an inflection point.
Black Mind Curve Support (Evidence 2):
A curved trendline (Mind Curve) is providing dynamic support. This curve intersects with the lower boundary of the rising channel—creating a confluence zone, which is likely to act as strong short-term support or the base of a reversal.
Major BOS (Break of Structure):
A significant bullish BOS occurred earlier, confirming momentum strength. This previous break is acting as a reference point for bullish continuation scenarios.
📉 Bearish Scenario:
If the price breaks below the channel and mind curve support, this would invalidate the current bullish channel structure.
A clean breakout + retest below the support zone may invite strong selling pressure, targeting previous support zones around 1.1500 – 1.1350.
📈 Bullish Scenario:
If the price holds above the mind curve and continues upward, we may see a breakout above the top of the channel.
A confirmed breakout could send price toward the 1.1900 – 1.2000 resistance zone.
Patience is key—wait for a confirmed breakout from the channel (either side) before engaging.
⏳ Strategy Outlook:
✅ Wait for channel breakout confirmation (up or down)
⚠️ Watch for fakeouts or liquidity grabs near channel boundaries
🔁 Mind Curve Support adds another layer of decision-making structure
🧠 Trade with the trend, but remain adaptable to shift if channel breaks
🔍 Summary:
The EURUSD pair is in a decision-making zone—either we get a bullish continuation breakout, or the structure fails and we flip into a bearish correction. The confluence of the straight channel and mind curve makes this setup high-quality for both trend traders and breakout traders.

EUR/USD – Consolidation and Uptrend Channel Analysis!Price is holding inside a well-defined uptrend channel on the 1-hour timeframe.
The trend remains bullish as long as price respects the channel structure.
Currently, we see consolidation near the upper zone, showing market indecision.
A breakout above consolidation will confirm bullish continuation.
If this happens, buyers can look for momentum entries to the upside.
However, if price breaks down below channel support and consolidates under it,
the bias will shift to bearish and open the way for deeper corrections.
Target in case of breakdown: 1.1400 – strong support and liquidity area.
Trading Plan:
Stay bullish while price is inside the channel.
Only turn bearish on a clean break and retest below the channel.
Avoid trading inside the middle of consolidation to reduce false signals.
Patience and confirmation are essential before taking any positions.

GBPJPY – Bearish Setup Within Uptrend ChannelGBPJPY is moving inside a larger uptrend channel on the 1-hour chart.
Price had been consolidating in a clear trade zone near the recent highs.
That trade zone support has now broken with strong bearish momentum.
This breakdown signals a potential short-term structure shift.
Sellers are stepping in below the trade zone, rejecting further upside.
Bias turns bearish while price stays under this broken level.
We’re now looking for continuation lower within the channel.
Key downside target identified at 194.00, near channel support.
This aligns with previous reaction levels and demand zones.
Plan:
1.Watch for retests of the broken zone for short opportunities.
2.Manage entries and risk carefully inside the channel.
3.Expect downside flow toward 194.00 if momentum holds.
4.Price action confirms break of support, favoring a move lower.
L ike, comment, share, and follow for more trading ideas.

Symmetrical Triangle in EURCHF —Fundamental & Technical AnalysisToday, I want to examine the EURCHF ( FX:EURCHF ) Short position opportunity from both a Fundamental and Technical perspective.
First, let’s examine the EURCHF pair from a fundamental perspective:
The ECB’s dovish policy stance and weakening Eurozone data contrast sharply with the Swiss Franc’s safe-haven appeal and economic stability. With geopolitical tensions in the background, EURCHF may continue to slide lower, supporting short positions.
In terms of technical analysis , EURCHF is moving near a Heavy Resistance zone(0.967 CHF-0.940 CHF) .
In terms of Classical Technical Analysis , EURCHF is moving inside a Symmetrical Triangle Pattern . The point to note about this example is that every time EURCHF approaches the upper lines of the symmetrical triangle , it starts to decline with a lot of momentum . And considering the previous movement of EURCHF, which was bearish, it is better to look for short positions from inside the symmetrical triangle.
Based on the above explanation , I expect EURCHF to move back towards the lower lines of the symmetrical triangle pattern .
Note: Stop Loss(SL): 0.94120 CHF
Please respect each other's ideas and express them politely if you agree or disagree.
Euro/Swiss Franc Analyze (EURCHF), 4-hour time frame.
Be sure to follow the updated ideas.
Do not forget to put a Stop loss for your positions (For every position you want to open).
Please follow your strategy and updates; this is just my Idea, and I will gladly see your ideas in this post.
Please do not forget the ✅' like '✅ button 🙏😊 & Share it with your friends; thanks, and Trade safe.

AUDCHF: Bullish Flag from PRZ — Rally to 0.54444?AUDCHF ( OANDA:AUDCHF ) bounced from the Potential Reversal Zone (PRZ) , which aligns with the Yearly Support(1) and the 50% Fibonacci level of the previous bullish impulse.
From a Classic Technical Analysis perspective , AUDCHF appears to be breaking out of a Bullish Flag Pattern , which may suggest the continuation of the previous uptrend .
This bullish reaction also confirms the importance of the Support zone(0.51166 CHF-0.49773 CHF) , where buyers stepped in aggressively.
In terms of Elliott Wave theory , it seems that AUDCHF has completed the bearish waves and we should wait for the bullish waves .
I expect AUDCHF to continue rising after a successful breakout from the flag’s upper boundary . If momentum sustains, the target could be around 0.54444 CHF .
Note: Stop Loss (SL) = 0.51972 CHF
Australian Dollar/ Swiss Franc Analyze (4-hour time frame).
Be sure to follow the updated ideas.
Do not forget to put a Stop loss for your positions (For every position you want to open).
Please follow your strategy; this is just my idea, and I will gladly see your ideas in this post.
Please do not forget the ✅ ' like ' ✅ button 🙏😊 & Share it with your friends; thanks, and Trade safe.

GBPUSD ANALYSIS After seeing that the previous candle closed really bullish on the week we could expect that momentum to continue since the daily and the 4hr structure are not showing any signs of reversal
