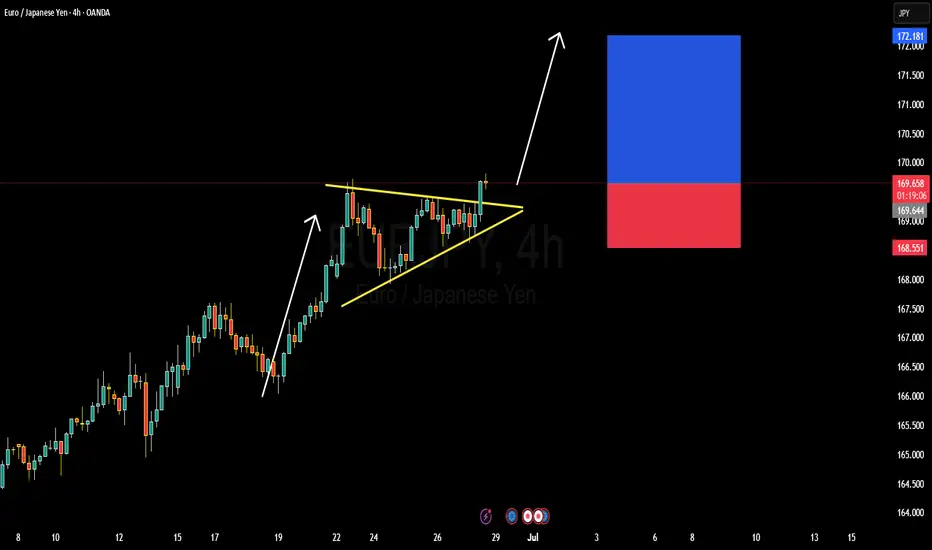
EURJPY BULLISH OR BEARISH DETAILED ANALYSISEURJPY has just broken out of a well-defined bullish pennant pattern on the 4H timeframe, confirming strong continuation potential to the upside. The price is currently hovering around 169.60 after consolidating in a tight structure, respecting both dynamic trendline support and horizontal resistance. This breakout signals renewed bullish momentum, and I'm now targeting the 172.10 zone as the next significant resistance level. The structure is clean, volume supported the breakout, and price action is aligned with the dominant uptrend.
Despite a relatively quiet start to the week—largely influenced by global risk-off sentiment surrounding Middle East tensions—EURJPY has held firm. Now that geopolitical jitters are easing slightly, yen weakness is resurfacing. The Bank of Japan remains firmly dovish, maintaining ultra-loose policy, while the Euro is supported by hawkish commentary from the ECB as inflation in the eurozone remains sticky. This divergence continues to fuel the long-term bullish bias for EURJPY.
Fundamentally, Japanese economic indicators remain soft, and there's still no clarity on when the BoJ will meaningfully shift policy. Meanwhile, EUR zone confidence indicators have stabilized, and speculation is growing around the ECB holding rates higher for longer into Q3. With widening yield differentials and a favorable risk sentiment return, this pair is positioned well for upside movement. Current momentum supports the probability of reaching the 172.00–172.10 area as risk appetite rebuilds across markets.
Technically and fundamentally aligned, EURJPY offers one of the strongest bullish continuation opportunities on the board right now. I will continue to monitor for minor dips as potential add-on areas, aiming for a full extension of the measured move from the pennant formation. Patience pays in setups like this where structure, sentiment, and macro all align.
Forexanalysis
GBPUSD Hits Channel Highs – Watch for Exhaustion or BreakoutGBPUSD continues its impressive rally, tapping into the upper boundary of a clean ascending channel across the 1D and 4H timeframes.
🔹 Daily:
Structure remains bullish with price pressing into long-term channel resistance near 1.3765. This is a key inflection point — bulls may need fresh momentum to break above.
🔹 4H:
Sharp impulsive move has stretched to the upside channel line. RSI likely overextended. Look for signs of exhaustion or bearish divergence here.
🔹 1H / 23m:
Lower timeframes show aggressive bullish control, but price is stalling near the highs. If we break structure or reject this zone, we could see a correction toward 1.3660 or deeper.
📉 If rejection occurs here, short opportunities may present toward mid-range or trendline support.
📈 If we break and close above 1.3780 with volume, continuation toward 1.3850 becomes likely.
💡Key Levels:
• Resistance: 1.3780, 1.3850
• Support: 1.3660, 1.3600

EURNZD Eyes 1.99 — Technical & Fundamental Bulls AlignedToday, I want to analyze EURNZD ( OANDA:EURNZD ) for you, which is in good shape both technically and fundamentally .
Please stay with me.
EURNZD is moving close to the Support zone(1.88750 NZD-1.7970 NZD) and 100_SMA(Daily) and has managed to form a Double Bottom Pattern .
From the perspective of Elliott Wave theory , EURNZD seems to have completed the main wave 4 , and we should wait for the main wave 5 . The main wave 5 could complete at the Heavy Resistance zone(2.120 NZD-1.9927 NZD) .
-----------------------------------
EURNZD – Fundamental Analysis:
The EURNZD pair currently reflects a divergence between two very different economic outlooks.
Eurozone (EUR):
The European Central Bank (ECB) has recently begun cutting interest rates to support slowing economic activity, especially in the industrial and manufacturing sectors. Despite this dovish shift, inflation remains relatively under control, and the euro has held up well against riskier currencies thanks to global uncertainty and safe-haven flows.
New Zealand (NZD):
New Zealand's economy is under pressure. The latest GDP figures confirmed a weak growth outlook, and signs of a technical recession are mounting. While the Reserve Bank of New Zealand (RBNZ) has maintained a relatively hawkish tone, it faces a dilemma: inflation is sticky, but domestic demand and housing remain fragile. The RBNZ may be forced to soften its stance sooner than expected.
Outlook:
This fundamental backdrop supports a bullish bias for EURNZD. The euro’s relative stability versus the increasingly vulnerable New Zealand dollar makes this pair attractive for long positions — especially if upcoming NZ data disappoints or global risk sentiment weakens further.
-----------------------------------
Based on the above explanation, I expect EURNZD to rise to at least 1.9917 NZD .
Note: Stop Loss(SL): 1.8779 NZD
Please respect each other's ideas and express them politely if you agree or disagree.
Euro/New Zealand Dollar Analyze (EURNZD), Daily time frame.
Be sure to follow the updated ideas.
Do not forget to put a Stop loss for your positions (For every position you want to open).
Please follow your strategy and updates; this is just my Idea, and I will gladly see your ideas in this post.
Please do not forget the ✅' like '✅ button 🙏😊 & Share it with your friends; thanks, and Trade safe.

Technical + Fundamental Alignment: GBPUSD Short in PlayGBPUSD ( FX:GBPUSD ) is moving near the Resistance zone($1.354-$1,350) and has managed to break the Support line .
In terms of Elliott Wave theory , it seems that GBPUSD has completed the Zigzag Correction(ABC/5-3-5) , we can expect the next five bearish waves .
--------------------------------------------------------
Fundamental Analysis
1-Weak UK Economic Data:
Recent reports including Retail Sales, Industrial Output, and PMIs have come in below expectations.
Labour market is softening, and wage growth is decelerating.
2-Dovish Expectations for BoE:
With inflation cooling down, the Bank of England is expected to hold or even cut rates soon, reducing support for the pound.
3-Stronger USD Outlook
Despite some weaker U.S. data, the Fed maintains a hawkish stance. U.S. retail sales and inflation still support the dollar overall.
4-UK Political Risk
Upcoming UK elections on July 4 are adding uncertainty and downside risk to GBP.
--------------------------------------------------------
I expect GBPUSD to attack at least the Support lines based on the above explanation.
Targets: 1.3
1)1.3353 USD =>Risk-To-Reward: 1.51
2)1.3315 USD =>Risk-To-Reward: 2.00
Note: Stop Loss(SL): 1.3549 USD
Please respect each other's ideas and express them politely if you agree or disagree.
British Pound / U.S Dollar Analyze (GBPUSD), 1-hour time frame.
Be sure to follow the updated ideas.
Do not forget to put a Stop loss for your positions (For every position you want to open).
Please follow your strategy and updates; this is just my Idea, and I will gladly see your ideas in this post.
Please do not forget the ✅' like '✅ button 🙏😊 & Share it with your friends; thanks, and Trade safe.

Quick Forex Market Overview | USDJPY, GBPUSD, CADJPY, EURUSD...In this video, I give an unstructured but insightful overview of the current market conditions across several major forex pairs. I walk through key price action and technical levels on USDJPY, GBPUSD, CADJPY, EURJPY, EURUSD, and EURAUD — sharing what I’m seeing in the moment and how the setups are developing.
Perfect if you're looking for a raw, real-time perspective without the fluff.

GOLD Price Forecast: Is the Pullback Over? | Weekly OutlookWill XAUUSD resume its bullish trend, or is more downside ahead?
In this video, I break down last week’s gold price movement and the current market reaction to rising geopolitical tensions between Iran and Israel, now with the U.S. joining the conflict. We also assess the impact of the Fed’s recent rate hold, weak retail sales, and upcoming high-impact U.S. economic events like PMI, GDP, and Core PCE.
💡 Here’s what you’ll learn:
✅What caused gold’s pullback last week
✅Why institutional traders shake out retail buyers
✅Key fundamentals driving gold right now
✅How to position yourself smartly for the upcoming trading week
🔔 Don’t forget to like the video in support of this work.
Disclaimer:
Based on experience and what I see on the charts, this is my take. It’s not financial advice—always do your research and consult a licensed advisor before trading.
#goldanalysis, #xauusd, #goldforecast, #goldpriceprediction, #forexanalysis, #fundamentalanalysis, #forextrading, #tradinggold, #goldnews, #federalreserve, #marketpsychology, #tradingstrategy, #geopoliticalrisk, #usdata, #iranisraeltensions, #goldbullish, #goldbearish, #forexmentor, #xauusdforecast, #tradingview

EURUSD Gearing Up for Next Leg Up – DXY Weakens After PPI MissToday, key U.S. economic indexes were released, providing fresh insights into inflationary pressures and the state of the labor market:
Core PPI m/m:
Actual: 0.1% | Forecast: 0.3% | Previous: -0.4%
Lower than expected – suggests weaker underlying producer inflation.
PPI m/m:
Actual: 0.1% | Forecast: 0.2% | Previous: -0.5%
Slight miss – overall inflation at the producer level remains soft.
Unemployment Claims:
Actual: 248K | Forecast: 242K | Previous: 247K
Slightly higher than forecast – signaling some cooling in the labor market.
Market Outlook :
These data releases point toward cooling inflation and softness in job growth, which may strengthen the dovish narrative around the Fed’s next move.
DXY Index ( TVC:DXY ) is under pressure, and EURUSD ( FX:EURUSD ) is showing signs of bullish momentum .
-----------------------------------------------------------
Now let's take a look at the EURUSD chart on the 1-hour time frame .
EURUSD is trading near the Heavy Resistance zone($1.182-$1.160) and Monthly Resistance(2) .
In terms of Elliott Wave theory , EURUSD appears to be completing microwave 4 . Microwave 4 could be completed at one of the Fibonacci levels .
I expect EURUSD to attack the Heavy Resistance zone($1.182-$1.160) at least once more after completing microwave 4 and could even rise to the Potential Reversal Zone(PRZ) .
Note: If EURUSD touches $1.1446 , we can expect more dump.
Please respect each other's ideas and express them politely if you agree or disagree.
Euro/U.S. Dollar Analyze (EURUSD), 1-hour time frame.
Be sure to follow the updated ideas.
Do not forget to put a Stop loss for your positions (For every position you want to open).
Please follow your strategy and updates; this is just my Idea, and I will gladly see your ideas in this post.
Please do not forget the ✅' like '✅ button 🙏😊 & Share it with your friends; thanks, and Trade safe.

What to Watch For Next!💡 GBPUSD Bearish Trade Outlook – Detailed Analysis
The GBPUSD pair has recently shown a clear Market Structure Shift (MSS) to the downside — a strong sign that bearish momentum may be taking control. Alongside this shift, we’ve also seen the formation of a Bearish Fair Value Gap (FVG) on the 4-hour timeframe, which adds further confluence to the potential for continued downside.
📍 What This Means:
The break in structure combined with the FVG suggests that institutional activity may be driving price lower, possibly targeting areas of untapped liquidity beneath previous lows. These are often high-probability setups when traded with confirmation.
🔎 What to Watch For Next:
At this point, it's best to wait patiently for the price to retrace into the 4H FVG zone. Once price taps this area, we should closely monitor lower timeframes (such as 15M or 5M) for bearish confirmation entries — like a bearish engulfing pattern, change in character (ChoCH), or internal MSS.
📉 Potential Trade Idea:
If confirmation occurs, we can look to enter a sell position, targeting downside liquidity levels, such as previous swing lows or equal lows — where the market often hunts liquidity.
⚠️ Risk Reminder:
As always, avoid entering blindly. Let the market give you a clear sign. Use proper risk management, and stick to your strategy.
📚 DYOR – Do Your Own Research!
The market doesn’t guarantee outcomes. Your own analysis, patience, and discipline are your best tools.

Forex Weekly Portfolio Selection – Top Trade SetupsWeekly Forex Portfolio Selection – H1 Chart Analysis
Using the Weekly & Daily Currency Strength Index, we’ve identified the strongest and weakest currencies to build a focused trading portfolio for the week.
📊 Currency Strength Ranking (1 = Weakest, 8 = Strongest):
EUR: 8
CHF: 7
CAD: 6
GBP: 5
AUD: 4
NZD: 3
USD: 2
JPY: 1
➡️ The Euro (EUR) is currently the strongest, while the Japanese Yen (JPY) is the weakest.
🔍 Analysed Pairs (H1 Timeframe):
EURJPY
EURUSD
CADJPY
GBPUSD
This selection focuses on high-probability setups aligned with trend and strength analysis.

USDCAD Hits Support as Fed-Hawkish & BoC Cuts! Big Bounce ComingUSDCAD ( OANDA:USDCAD ) is trading at the Potential Reversal Zone(PRZ) and near the important Support line and Support lines .
In terms of Elliott Wave theory , it seems that USDCAD has managed to complete 5 main down waves and we can expect more up waves .
Also, we can see the Regular Divergence(RD+) between Consecutive Valleys .
I expect USDCAD to rise to at least 1.37860 CAD.
Fundamental View:
The Bank of Canada initiated its rate-cutting cycle , while the Federal Reserve remains firm with no immediate plans to ease.
Strong NFP data on Friday reinforced USD ( TVC:DXY ) strength .
Oil prices( BLACKBULL:BRENT ) may offer temporary support to CAD , but macro divergences clearly favor the dollar .
Note: Stop Loss(SL)= 1.36110 CAD
U.S Dollar/Canadian Dollar Analyze (USDCAD), 4-hour time frame.
Be sure to follow the updated ideas.
Do not forget to put a Stop loss for your positions (For every position you want to open).
Please follow your strategy; this is just my idea, and I will gladly see your ideas in this post.
Please do not forget the ✅' like '✅ button 🙏😊 & Share it with your friends; thanks, and Trade safe.

EURUSD Outlook – Long, Medium & Short-Term Analysis🔹 Weekly Chart:
The broader structure remains technically bearish. We've recently seen a trend reset, which could mark the beginning of a fresh downside leg.
🔹 Daily Chart:
A clear bearish trend reversal pattern has formed, accompanied by a manipulation phase. A confirmed break structure is now in place. As long as price remains below 1.15734, short positions remain valid.
🔹 4H Chart:
Currently in a range-bound phase. A confirmed break below 1.1371 will be a key bearish trigger for potential selling opportunities.
🔹 1H Chart:
Still ranging, but a valid Lower Low (LL) has already printed. A second LL below 1.1371 would confirm a short-term bearish continuation.
On the flip side, a break above 1.1495 would open the door for a bullish move in the short term.
📌 Key Levels to Watch:
Bullish above: 1.1495
Bearish below: 1.1371
Critical invalidation: 1.15734
Trade safe and stay disciplined.

Inverse H&S Breakout! EURGBP Eyes Resistance Zone Amid Eurozone EURGBP ( OANDA:EURGBP ) is moving between two Support zone(0.83870 GBP-0.83500 GBP) and Resistance zone(0.8511 GBP-0.8470 GBP) .
In terms of Classic Technical Analysis , EURGBP has managed to break the Neckline of the Inverse Head and Shoulders Pattern .
I expect EURGBP to rise to at least 0.84911 GBP and attack the Resistance zone(0.8511 GBP- 0.8470 GBP) .
-----------------------------------------------------------
EURGBP Fundamental Analysis:
1. Eurozone (EUR) Overview :
The Eurozone economy has shown moderate recovery signs after pandemic disruptions.
Inflation remains a concern, but the European Central Bank (ECB) is expected to maintain or even tighten monetary policy gradually to combat inflation.
Economic data such as GDP growth and industrial production are mixed but generally indicate slow growth.
Political stability in the Eurozone is relatively steady compared to the UK.
The ECB’s forward guidance leans towards cautious optimism, supporting EUR strength over time.
2. United Kingdom (GBP) Overview :
The UK economy faces several challenges, including slower growth prospects compared to the Eurozone.
Inflation has been high but the Bank of England (BoE) has been raising interest rates aggressively to control it.
Political uncertainties related to Brexit aftermath, trade deals, and fiscal policies have created some volatility.
Consumer confidence and retail sales have shown signs of weakness in recent months.
Overall, the BoE’s hawkish stance is strong, but economic fundamentals are less robust compared to the Eurozone.
3. Comparative Factors Favoring EUR Long :
The Eurozone's relatively better economic stability and growth prospects support EUR strength.
UK economic challenges and political uncertainties weaken GBP.
ECB’s more gradual tightening approach may prevent shocks, making EUR attractive.
Brexit-related trade issues continue to pose risks for GBP.
4. Risks to Consider :
Unexpected ECB dovish moves could weaken EUR.
Positive UK economic surprises or faster-than-expected BoE tightening might strengthen GBP.
External shocks like geopolitical tensions can affect risk sentiment, impacting both currencies.
-----------------------------------------------------------
Note: Stop Loss(SL)= 0.84221 GBP
Euro/British Pound Analyze (EURGBP), 4-hour time frame.
Be sure to follow the updated ideas.
Do not forget to put a Stop loss for your positions (For every position you want to open).
Please follow your strategy; this is just my idea, and I will gladly see your ideas in this post.
Please do not forget the ✅' like '✅ button 🙏😊 & Share it with your friends; thanks, and Trade safe.

Will the U.S. Dollar Bear go out to lunch and take a break?In this video I go over the case for the U.S. Dollar bear taking a break and price action getting a pullback across the EUR/USD, GBP/USD and USD/JPY.
I took a 42% profit on EUR/USD longs and currently keeping an eye on a short opportunity if weakness starts to creep in on the price action.
Long term, I remain U.S. Dollar bearish across the board however pullbacks are always expected during a macro price move.
If we trade higher, so be it and I will evaluate what the next position will be.
As always, Good Luck & Trade Safe.

JPYUSD Smart Money VIP Analysis – Eyeing High-Probability Target📈 Market Context:
The JPYUSD (Japanese Yen vs. US Dollar) is currently navigating through a critical structure phase where price is reacting to previously established institutional zones. Recent price movements reveal a clean and structured setup — one that aligns perfectly with Smart Money Concepts (SMC) and CHoCH (Change of Character) theory.
This 2H chart provides a roadmap for anticipating the next high-probability reversal, giving traders an edge in both short-term scalps and mid-term swing trades.
🔍 In-Depth Chart Analysis:
🧱 Resistance Zone (0.007020–0.007040):
This area has been tested multiple times in the past and acted as a strong supply zone. Institutional orders have previously caused significant bearish pressure from this level. Unless a strong bullish breakout occurs with volume, this zone is likely to hold again.
🔁 Next Reversal Zone (0.006975–0.006985):
Price is currently climbing from the SR Interchange Zone, heading toward this marked reversal area. Here's why this zone matters:
Confluence of past resistance and imbalance
Potential liquidity sweep above minor highs
Perfect setup for a bearish reaction to form a lower high
Traders should watch for signs of weak bullish candles, wicks, or a bearish engulfing here.
🔄 SR Interchange (Support-Resistance Flip):
This level held firm, showing buyer interest after a previous structure break. It signals a healthy correction phase — a typical SMC signature before larger moves occur. The market is offering a retracement opportunity.
🟡 CHoCH Zones:
Minor CHoCH (0.006900): A break and close below this level would invalidate bullish correction and confirm the shift in momentum.
Major CHoCH (0.006840): The final confirmation of bearish dominance. A breach here opens the door for new lows, targeting long-term support areas.
⚔️ Smart Money Playbook:
Current Move: Price is in bullish retracement from previous demand zone
Watch Zone: 0.006975–0.006985 (Potential Smart Money sell zone)
Reaction Setup:
Bearish structure forms (e.g., M pattern, liquidity sweep, bearish engulfing)
Price breaks minor CHoCH
Sell Entry: After confirmation, with stops above reversal zone
TP1: SR Interchange level
TP2: Major CHoCH zone
📅 Fundamental Triggers Ahead:
Watch for upcoming USD economic data (CPI, PPI, interest rate decisions) between June 11–14, which could act as catalysts for volatility and confirm technical setups.
🧠 Educational Note:
This setup is a classic example of market structure shift, liquidity engineering, and order block theory — concepts used by banks and smart money traders. Retail traders often get trapped on the wrong side of these zones. Your edge lies in anticipating the trap, not reacting to it.
🎯 Conclusion:
JPYUSD is offering a textbook Smart Money setup. The current retracement gives an opportunity to position early into a likely bearish continuation, provided structure confirms at the next reversal zone. Patience, discipline, and precise timing will be key to capitalizing on this move.

XAUUSD Analysis – From Bullish Momentum to Target🔍 Overview:
Gold has officially broken its ascending trendline, signaling a shift in market structure from bullish to bearish. This trendline acted as dynamic support for days, but its breakdown has opened the doors to potential downside movement. We're now in a phase where lower highs and lower lows are forming — a classic bearish signal.
📌 Key Levels & Price Zones:
🔻 Trendline Breakdown
A strong upward trendline was broken, confirming that bullish momentum has weakened. The trendline break was followed by aggressive bearish candles, signaling that sellers are gaining strength.
🔄 SR Interchange Zone (~3,322 – 3,330)
This area once acted as strong support and has now flipped to resistance. It’s a key level to watch for rejections or false breakouts. As long as the price stays below it, the bias remains bearish.
🔽 Mini Support Zone (~3,345 – 3,350)
A weak support area that could be retested. If price fails to hold above it, sellers will likely take over again.
⚠️ Minor CHoCH (~3,290)
This level marks the short-term structure shift. A breakdown here will confirm continuation to the downside. A short opportunity might present itself below this zone.
🌀 Next Reversal Zone (~3,275 – 3,280)
A potential demand area. Watch how the price reacts — this is where bulls might step in temporarily for a bounce or consolidation.
🚨 Major CHoCH (~3,265)
This is a critical support level. If it breaks, the entire bullish structure from early June is invalidated, opening the door to deeper retracement.
📈 Forecast Path:
Based on the price projection:
Expect lower highs to form.
If bearish momentum continues, we could see a breakdown below Minor CHoCH, targeting the Next Reversal Zone.
A clean break below 3,265 would signal a major trend change, confirming bearish control.
📊 Trade Ideas:
🔻 Short-Term Bearish Scenario:
Look for price to reject the SR Interchange or Mini Support zones.
Entry: After confirmation below 3,330
Targets: 3,290 → 3,275 → 3,265
SL: Above 3,350
🔼 Bullish Bounce Scenario:
If price reaches 3,275 and forms bullish confirmation (engulfing candle, divergence), we might see a short-term reversal.
Entry: On bullish candle close from support zone
Target: Back to 3,322 or higher
📅 Upcoming Events to Watch:
There are several U.S. economic data releases coming this week (marked on the chart). These can create sharp moves in XAUUSD, so manage your risk wisely.
✅ Final Thoughts:
Gold is at a key turning point. The breakdown from the trendline is significant, and structure now favors sellers — unless bulls reclaim critical levels. Wait for confirmation before entering, and always trade with proper risk management.
📌 Follow for more clean chart breakdowns, updates, and trade setups!

NOKJPY – Detailed Macro Analysis & Trade IdeaMacro Bias: LONG NOK / SHORT JPY
Why NOKJPY?
1. Fundamental Macro (ENDO):
Norway (NOK):
Strong inflationary pressure, positive PMI, robust M2 growth.
Massive fiscal surplus driven by energy exports – best debt/GDP ratio in the G10.
Norges Bank still maintaining relatively high interest rates.
Positive Terms of Trade, central bank balance sheet (CBBS) is shrinking (long-term bullish for NOK).
Japan (JPY):
Economic stagnation and deflationary risks, weak PMI and consumer spending.
Negative real yields, central bank remains ultra-accommodative, extreme debt/GDP ratio.
Persistent deflationary sentiment – classic “funding currency” for global carry trades.
2. COT Positioning (Commitments of Traders):
JPY is the most crowded short in the entire G10: hedge funds and leveraged funds are aggressively short JPY.
NOK positioning is neutral to slightly long – no overcrowding risk on the long side.
3. EXO & Sentiment Signals:
Terms-of-trade and projected GDP/CPI all favor NOK.
Sentiment, macro “score,” and risk/reward models consistently generate a long NOKJPY signal.
Exogenous indicators (futures, commodity impulse, sentiment, parity) all support NOK strength.
4. Technicals & Carry Edge:
NOKJPY remains in a strong multi-month uptrend.
Major carry advantage: NOK rates are much higher than JPY, yielding significant positive swap.
Every recent pullback has been bought, and momentum remains bullish.
Key Reasons for the Trade:
Multi-model consensus: No contradiction between macro, COT, exo, and technicals.
NOK is “king of G10” by every fundamental measure; JPY is the weakest currency this cycle.
Textbook carry trade for 2025.
Risks:
Only a sudden global “risk-off” or a central bank policy shock could temporarily disrupt the trend.
Currently, there is no crowding risk on NOK longs.
SUMMARY:
LONG NOKJPY is the cleanest, highest-conviction swing trade for this cycle – every model (macro, COT, exo, sentiment, carry) is in agreement.
Every meaningful pullback is a buying opportunity.

Is This the Optimal Entry After a PDL Sweep and FVG Retest?A clean structural development on CHFJPY (1H TF)
After sweeping the Previous Day’s Low (PDL), price created a bullish Break of Structure (BOS) to the upside , shifting short-term sentiment. This BOS was followed by a precise retest into a Fair Value Gap (FVG), suggesting possible continuation as liquidity shifts from weak hands to strong.
🧠 Educational Notes :
CRT Sweep Logic: Market often sweeps the previous day's high or low before making its true move. In this case, a clean PDL sweep was followed by a strong bullish reaction.
Break of Structure (BOS): Confirmed bullish intent after the sweep, validating a shift in order flow.
FVG Retest: Institutional pricing inefficiency filled — a classic SMC continuation behavior.
Entry Thesis: Based on reaction from FVG + BOS confirmation, with invalidation below the swept low and TP near the previous swing high.
This setup is not financial advice, but a clear visual case study for traders applying SMC + CRT logic.

USDJPY Tests Channel Support After ADP Shock — Rebound Ahead?In the last hour's candle after the ADP Non-Farm Employment Change Index was released, USDJPY ( FX:USDJPY ) started to fall, but considering the position of this pair, I think we can have a good Risk-To-Reward even if the Stop Loss (SL) is touched.
USDJPY is trading near the lower line of the ascending channel and the Support zone(143.870 JPY-143.430 JPY) .
From an Elliott Wave perspective , USDJPY appears to be completing a corrective pattern .
I expect USDJPY to rise at least to the Potential Reversal Zone(PRZ) .
Note: Stop Loss = 143.220 JPY
Please respect each other's ideas and express them politely if you agree or disagree.
U.S. Dollar/Japanese Yen Analyze (USDJPY), 1-hour time frame.
Be sure to follow the updated ideas.
Do not forget to put a Stop loss for your positions (For every position you want to open).
Please follow your strategy and updates; this is just my Idea, and I will gladly see your ideas in this post.
Please do not forget the ✅' like '✅ button 🙏😊 & Share it with your friends; thanks, and Trade safe.

Stronger U.S. JOLTS Data Pressures EURUSD!!!EURUSD ( FX:EURUSD ) failed to break the Resistance zone($1.1487-$1.1424) and started to fall again , breaking the Support lines .
In terms of Elliott Wave theory , it seems that EURUSD has managed to complete the main wave X of the Double Three Correction(WXY) structure .
Just moments ago, the U.S. JOLTS Job Openings data was released.
-------------------------------
Actual: 7.39M
Forecast: 7.11M
Previous: 7.19M
The stronger-than-expected JOLTS figure at 7.39 million signals a resilient labor market. This reduces recession fears and increases the likelihood that the Federal Reserve may keep interest rates elevated for longer.
Bullish for the U.S. Dollar( TVC:DXY )
Bearish pressure could hit EURUSD, especially if it's approaching the key resistance zone.
-------------------------------
I expect EURUSD to start to fall again after the pullback to the Support lines and to fall to the targets I have specified on the chart.
Note: If EURUSD touches $1.14580(Stop Loss(SL)), we can expect a failure of the Resistance zone($1.1487-$1.1424).
Please respect each other's ideas and express them politely if you agree or disagree.
Euro/U.S. Dollar Analyze (EURUSD), 1-hour time frame.
Be sure to follow the updated ideas.
Do not forget to put a Stop loss for your positions (For every position you want to open).
Please follow your strategy and updates; this is just my Idea, and I will gladly see your ideas in this post.
Please do not forget the ✅' like '✅ button 🙏😊 & Share it with your friends; thanks, and Trade safe.

JPYUSD Technical Breakdown | Inverse Head & Shoulders + Target🔍 Pattern Breakdown: Inverse Head & Shoulders (H&S)
We’ve identified a textbook Inverse Head & Shoulders pattern, a classic bullish reversal formation that often appears at the end of a downtrend. Here's how the structure played out:
Left Shoulder:
The initial drop formed a local low, followed by a short recovery, creating the first "shoulder" on the left.
Head:
A deeper push down formed the lowest point of the pattern, indicating a possible trap for sellers or exhaustion in bearish momentum. This is the "head" and the key anchor of the pattern.
Right Shoulder:
A higher low forms, showing buyers stepping in earlier and with more strength. This symmetry confirms the structure and signals a potential reversal in trend.
Neckline:
Drawn across the highs between the shoulders, this key resistance line was broken decisively, confirming the bullish pattern and triggering an upward breakout.
📌 Trendline + Retest Zone = Confluence Support
After the breakout above the neckline:
Price surged strongly, showing confidence in the reversal.
It pulled back gently to retest the neckline, which now acts as support.
This retest also aligns with the upward trendline, adding confluence — a strong signal in technical trading that increases the probability of a successful continuation move.
This zone is labeled on the chart as:
🟦 “Like a Retesting Zone After Boom” — a perfect description of what’s occurring.
🎯 Target and Resistance Zones
The price is now moving toward a major resistance zone marked between 0.007020 – 0.007060, with a target zone slightly above at 0.007080.
These zones represent historical selling pressure or supply areas. A breakout above this region would open doors to even higher levels, signaling strong bullish continuation.
📈 Why This Setup Matters (MMC Strategy Applied)
Using the Market Mapping Concept (MMC) approach, this trade idea combines:
Market structure (Inverse H&S pattern)
Momentum confirmation (strong bullish move after breakout)
Zone mapping (support/resistance confluence)
Trendline validation (clean structure with pullback respect)
This creates a well-defined trade setup with clear entry and exit logic, excellent risk-to-reward potential, and technical confirmation.
✅ Summary: Bullish Outlook With Managed Risk
Bias: Bullish continuation as long as price holds above the neckline/trendline zone.
Confirmation: Inverse H&S pattern + successful retest.
Target: 0.007060–0.007080 resistance zone.
Invalidation: Break below 0.006980 and close under trendline support.
💬 Minds Post Caption (Extended)
🔥 JPYUSD Ready to Fly? Inverse Head & Shoulders Breakout Spotted!
Clean reversal pattern (H&S) just completed with a strong neckline breakout and a perfect retest at trendline confluence. MMC analysis suggests bullish continuation toward the 0.007060+ resistance zone. Classic "retest after boom" move. Watching price action closely! 🚀📊

XAGUSD Analysis – Market Mapping Concept (MMC) + Target🧭 Overview:
Today's Silver price action presents a textbook example of how MMC can guide traders through:
Identifying the smart money accumulation phase.
Anticipating breakout momentum .
Locating key reversal areas based on previous liquidity maps and structural shifts.
We are currently observing Silver in the early stages of a structural retest after a breakout from consolidation. This gives rise to two powerful scenarios: either a bullish continuation after structure confirmation or a deeper retracement if the structure fails.
🔍 Detailed Chart Explanation:
🔷 1. Volume Contraction Phase
The market spent multiple sessions forming a symmetrical wedge, visible by narrowing price movement and consistent lower highs and higher lows.
This was accompanied by declining volume, signaling accumulation/distribution by institutional players.
The wedge served as a liquidity trap, drawing in both early shorts and longs before the true direction was revealed.
✅ MMC Principle: Volume contraction often precedes major breakouts as market makers build positions quietly.
🔷 2. SR Interchange – Breakout Confirmation
Price finally broke above the upper trendline, triggering a bullish impulse and confirming SR interchange (resistance turned support).
This move was backed by a strong bullish candle, showing aggressive participation and institutional involvement.
📌 This breakout candle set the tone for a structural shift—transforming from sideways to upward momentum.
🔷 3. Rapid Expansion Toward Previous Target Zone
After the breakout, price accelerated directly into a previous high (target) zone marked in blue.
According to MMC, this zone often acts as a liquidity magnet, where late buyers enter and professional traders take profits.
A rejection wick formed right after touching this zone—classic smart money behavior, catching retail traders chasing the move.
✅ MMC Principle: Prior highs/lows are not just resistance—they're engineered targets for liquidity collection.
🔷 4. Target + Reversal Area
After the rejection, price declined back into the Target + Reversal Zone. This area aligns with MMC’s ideal structure for potential buy-side re-accumulation.
This zone is where previous volume imbalances occurred, meaning it is likely to act as support if the bullish trend is to continue.
📊 Current price is consolidating within this zone, suggesting a possible bullish continuation if structure holds.
🔷 5. Structure Mapping – The Key to MMC
The most recent price reaction highlights the importance of structure mapping: identifying areas where market logic aligns with trader behavior.
The bearish pullback into the structure zone may complete a retest, and traders are watching closely for bullish confirmation.
⚙️ Technical Summary:
Key Zone Description
Volume Contraction Signals accumulation before breakout.
SR Interchange Breakout level where resistance turned to support.
Previous Target Zone Liquidity pool, ideal for institutional exits or reversal.
Target + Reversal Zone Demand zone where the trend may resume if confirmed.
Structure Mapping Current phase; price is aligning into new bullish structure or preparing for drop.
🧭 What to Watch Next:
🔹 Scenario A – Bullish Case:
Price holds within the Target + Reversal Zone.
Confirmation via bullish engulfing candle or breakout of lower high.
Target: retest of 34.80+, then potential extension to 35.20.
🔹 Scenario B – Bearish Case:
Breakdown below structure base at 33.85–34.00.
Could lead to a deeper correction toward 33.40 or 32.80 (previous volume node).
📌 Volume + Structure = Decision Point. Next few candles are crucial for validating direction.
🛠 Strategy & Execution:
Approach: Wait for confirmation candles before entering. Avoid reacting impulsively within the structure zone.
Entry Idea:
Buy on bullish confirmation in the reversal zone.
Place stop below structure invalidation.
Target the top of the previous target zone or higher.
Risk Management: Use tight SLs below 33.85 and scale in only on confirmation.
📅 Timeframe: 1H
🔭 Sentiment: Cautiously Bullish
🎯 Technique: MMC Structure Mapping + Volume-Based Targeting
🧠 Final Thoughts:
This XAGUSD chart showcases the predictive power of MMC when applied correctly. By understanding where smart money operates, traders can improve accuracy, timing, and risk control.
📌 If you found this analysis helpful, like and follow for daily insights. Drop your thoughts in the comments—do you trade MMC-style setups?

GOLD Price Analysis: Key Insights for Next Week Trading DecisionIn this video, we dissect how gold traded last week (May 26–30), why the price hovered near the top of a descending channel, and what’s driving market indecision. From geopolitical tensions to Federal Reserve interest rate uncertainty, we connect the dots between fundamentals and technical structure, enabling you to make better-informed trading decisions.
📅 Key Events to Watch This Week:
✅ISM Manufacturing PMI
✅ADP Employment Change
✅ISM Services PMI
✅Average Hourly Earnings
✅Non-Farm Payroll (NFP)
🎯 In this analysis, I walk you through:
🔸My technical blueprint (key zones for buyers & sellers)
🔸My bullish and bearish scenarios based on the structure on the chart
🔔 Don’t forget to like the video in support of my work.
Disclaimer:
Based on experience and what I see on the charts, this is my take. It’s not financial advice—always do your research and consult a licensed advisor before trading.
#GoldAnalysis #XAUUSD #GoldPriceForecast #GoldTrading #ForexAnalysis #MarketOutlook #NFP #FOMC #TechnicalAnalysis #FundamentalAnalysis #GoldBulls #GoldBears #TradingStrategy #Darcsherry #XAUUSDAnalysis #GoldOutlook #GoldPricePrediction

EURJPY Weekly Analysis – Major Structural Breakout & Target🧱 1. Consolidation Zone: The Dual Directional Area
From around August 2024 to May 2025, EURJPY traded inside a well-defined consolidation range, marked between approximately 155.00 to 165.00. This phase can be categorized as a Dual Directional Zone, meaning both buyers and sellers had tactical entries, but the market was in accumulation/distribution mode.
This phase often traps breakout traders and builds liquidity on both sides.
Price repeatedly swept highs and lows inside this zone but lacked any commitment, signaling that larger players were building positions.
The flat structure over months hinted that a major move was imminent.
⚠️ 2. Major CHoCH (Change of Character)
The first clue of shifting momentum was the CHoCH, which signaled a change in direction and flow of control.
The lower highs and lower lows began to shift into higher lows, showing buying strength beneath the surface.
This change didn’t immediately lead to breakout, but it marked the early intention of bullish dominance.
🚀 3. Major BOS (Break of Structure): Confirming the Bullish Bias
The clean break above the range high was the confirmation of a major bullish BOS.
This wasn’t just a minor pop — it was an aggressive breakout, validating that institutional liquidity had been accumulated and was now being deployed.
The price ran swiftly toward the Bullish Target Zone (~177.50–180.00) with very little pullback, suggesting urgency from buyers or short-covering from trapped sellers.
🎯 4. Bullish Target Reached – What's Next?
Price has hit the projected Bullish Target Area — a region of prior imbalance and psychological round numbers.
Traders who caught the breakout now face a critical decision point: Will price continue higher into price discovery mode, or is this the exhaustion phase?
If price holds above the BOS level (~165.00), there’s still room for continuation. But signs of rejection or slowing momentum here could lead to a correction.
🔻 5. Bearish Alternative: Trap and Reversal Scenario
The bearish path is not out of play — in fact, this move upward could potentially be a liquidity sweep.
If price fails to stay above the BOS and rapidly closes back into the consolidation range, it would suggest a bull trap.
This would confirm a deviation, which often leads to violent reversals.
The projected Bearish Target Zone (~145.00–147.50) aligns with prior unmitigated zones and imbalance that may attract price if sentiment flips.
🧭 6. Trading Strategy & Risk Planning
For Bulls: Watch for consolidation above 165.00. Breakout + Retest entries toward 180.00 or beyond offer high R/R.
For Bears : Look for exhaustion or fakeout patterns (like a Quasimodo or supply engulfing) near current highs. A breakdown and close below 165.00 signals short entries targeting 150s and potentially 147s.
💬 Final Thoughts:
This chart is a prime example of how patience during a range and reaction after breakout pays off. Smart traders don’t chase — they prepare.
A bullish continuation may still be in play.
However, if this move was only a liquidity purge, the reversal could be deep and fast.
Stay alert, mark your key levels, and trade what you see — not what you feel.
