EURUSD Mirror Market Concept – Retest Before Bullish Expansion 🔍 Analysis Summary:
This EUR/USD setup is constructed using the Mirror Market Concept (MMC), which identifies price behavior patterns that tend to "mirror" across central zones or key support/resistance levels. The chart highlights multiple "Ellipse + Central Zone" regions that represent strong consolidation and price decision areas, reflecting symmetry in market reactions.
📈 Key Technical Insights:
Central Zones & Ellipses: These are repeated zones where price action has shown symmetry in both accumulation and distribution phases. Watch how these ellipses mirror prior moves, indicating likely zones of reaction.
Previous Target & Reversal Area : The market completed a leg to the previous target (around 1.1410), followed by a rejection from a major resistance zone, initiating a reversal. This aligns with the Mirror Market structure, where the move downward reflects the previous bullish leg.
Support Level: A significant support zone has been marked near the 1.1275 level. Price action reversed from here, respecting this base and forming a reversal zone.
Retesting Phase: After bouncing from support, the price is entering a retesting phase around the 1.1330 level (identified ellipse). This retest is critical—if held, it could trigger bullish continuation.
Major BOS (Break of Structure): Once price breaks and sustains above the 1.1360–1.1380 region, it will confirm the BOS and pave the way toward the final Target Zone at 1.1450–1.1470.
🎯 Trade Plan Overview:
Bullish Scenario: Look for confirmation of support near 1.1320–1.1330 during the retest. If price holds and forms bullish structure (e.g., higher lows, bullish engulfing), consider long setups targeting 1.1450.
Bearish Invalidator: A breakdown and close below the support level at 1.1275 would invalidate the bullish bias and call for reevaluation of the setup.
🧠 Final Thoughts:
This analysis reflects the mirror behavior of price and the market psychology around equilibrium zones. MMC provides a structured way to anticipate future price action by understanding how historical reactions unfold. Watch key zones and wait for confirmation before engaging.
Forexanalysis

JPY/USD Deep Analysis Using MMC – Curve Zone + Volume Burst Zone📌 Overview:
Today’s chart setup on JPY/USD demonstrates a classic Mirror Market Concept scenario, where price mimics past structure and behavior to create high-probability trade setups. We are looking at a textbook reversal with a rounded bottom forming right above a key Support Zone—signaling a strong potential move upward.
This is not just a basic support bounce. It’s a multi-layered confluence where structure, volume, and price action come together to build a strong bullish narrative.
🌀 Phase 1: The Curve Zone Support (Accumulation)
The Curve Zone Support (marked clearly on the chart) sits right above 0.006890–0.006910.
Price touched this zone multiple times without breaking it, forming higher lows—a typical sign of accumulation.
This pattern resembles a “rounded bottom” or cup shape, indicating that sellers are getting exhausted and buyers are slowly stepping in.
💡 Market Psychology: This is where smart money begins to accumulate positions, absorbing panic sellers while price coils up.
🧱 Phase 2: SR Interchange + Central Zone Reaction
Notice the SR Interchange Zone around 0.006950. Previously it acted as a resistance, but price broke above and now respects it as support.
This is a textbook SR flip, confirming that this level holds weight.
The Central Zone, formed earlier, is where a battle between bulls and bears took place. Now price is creeping back toward it.
🧠 Mirror Market Concept Insight: Market tends to repeat structure. The earlier bullish rally from the same base level is a mirrored version of what’s forming now. That’s why this concept gives us confidence in projecting future price moves.
🔊 Phase 3: Volume Burst Area – The Target Zone
We’ve marked a Volume Burst Area around 0.007040. This is where heavy buying occurred before a sharp decline.
According to MMC, these areas often act like magnets—price gravitates back toward them once demand builds up below.
If price clears the midpoint (50% retracement) around 0.006960, it opens the door for a bullish breakout toward the volume cluster.
🎯 Trade Plan Based on This Setup:
Component Details
Entry Zone 0.006920 – 0.006930 (buy zone)
Stop Loss Below 0.006890
First Target 0.006980 (mid-level reaction)
Final Target 0.007000 – 0.007040 (Volume Zone)
🧬 MMC Confluences That Make This Setup Powerful:
✅ Curve Zone Support – Foundational base for entry.
✅ SR Flip (Interchange) – Old resistance turned support.
✅ Volume Burst Area – Target based on prior aggressive moves.
✅ Structure Break – Bullish structure shift as price forms higher lows.
✅ Psychology – Accumulation turning into expansion.
🏁 Final Thoughts:
This chart is a great example of how Mirror Market Concepts can unlock the hidden patterns of the market. It’s not just technicals, it’s also about understanding how traders think and how price reflects those emotions.
When you combine curve structures, SR interchanges, and volume dynamics, you’re not guessing—you’re anticipating. If price respects this structure, this could be a clean move toward 0.007000+, offering a great risk-to-reward ratio.

JPY/USD – Clean Rejection from Mini Resistance | Bearish Move🔻 1. Major & Mini Resistance Zones
Mini Resistance Zone: This is a key supply area that aligns with previous highs and recent structure points. As the price approaches this level, it tends to react due to unfilled sell orders and trapped buyers.
The chart shows a rejection from this mini resistance zone — visible through strong bearish candles. This suggests institutional selling pressure has entered the market.
Major Resistance is still untouched above, which becomes a clear invalidation level for any short bias. If price breaks and sustains above it, the bearish idea would be invalidated.
🔄 2. MMC (Mirror Market Concepts) at Work
The MMC idea is clearly illustrated. The price movement after the last major drop is mirrored on the right side:
Strong rally > Formation of lower highs > Resistance retest > Sharp decline
These mirrored behaviors often hint at psychological repetition in the market, driven by trader memory and order placement.
The bearish movement after retesting the mini resistance looks nearly identical to the previous leg on the left — reinforcing the idea that we may see a similar downside structure repeat.
🌀 3. Central Zone Area – Liquidity Trap and Reaction Point
The Central Zone Area is labeled where a previous sharp bounce occurred. This zone is critical for several reasons:
It acted as support multiple times.
It’s also where a liquidity grab occurred — shown with a long wick — before a reversal rally.
In current price action, this zone may again act as a magnet for price, as institutions seek liquidity to fuel further moves. Once price reaches it, expect a temporary bounce or reaction.
📐 4. 50% Fibonacci Retracement Confluence
The projected target sits right on the 50% retracement level of the previous bullish leg.
Institutions frequently target the 50%–61.8% Fibonacci zones to rebalance orders and create continuation moves.
This target zone is marked in purple and is aligned with historical support, adding confluence.
📉 5. Sharp Bearish Reversal from Structure
You can observe a very clear shift in momentum:
The uptrend was broken with a strong bearish engulfing candle.
That move wiped out several minor bullish structures — a sign of structure collapse.
This breakdown, combined with the resistance rejection and MMC mirroring, strongly supports a bearish continuation bias.
📊 6. Previous Targets and Structure Memory
The previous targets and historical swing points are not just annotations — they represent real zones of order flow memory.
When price revisits these levels, you often see reactions (reversals, consolidations, or continuation).
🎯 Trade Plan (Based on Chart):
Bias: Bearish
Entry Zone: After rejection confirmation at mini resistance
Target Zone: 0.00675 area (50% retracement)
Invalidation: Close above 0.00715 (Major Resistance)
✅ Conclusion:
This JPY/USD 4H chart beautifully showcases the power of technical structure, Mirror Market Concepts, and liquidity-focused trading. With a clean rejection from mini resistance, a history of mirrored bearish setups, and a confluence target at the 50% zone, this chart suggests a high-probability short opportunity for disciplined traders.

USDJPY Just Flipped — Liquidity Has a New Target🧠 Smart Money Breakdown: USDJPY | 15-Min Chart
We’ve got a textbook bearish reversal setup forming right now on USDJPY, and Smart Money traders are paying close attention.
🔄 1. Change of Character (ChoCh)
The first key sign was a ChoCh, which flipped the internal structure from bullish to bearish. This signals a potential shift in market control from buyers to sellers — Smart Money often initiates big moves after such a flip.
🟫 2. Bearish Order Block + Rejection Wick
Price pulled back right into a fresh bearish Order Block (OB) around the 148.056–148.337 zone. This OB lines up perfectly with the upper trendline + internal liquidity area.
Price is now rejecting hard from this level, signaling Smart Money sell-side pressure.
🕳 3. Fair Value Gap (FVG) Below
Below current price lies a clean FVG, serving as a magnet for price. Smart Money often targets these imbalances to rebalance the market.
The gap extends from around 146.200 to 147.400 — with Sell Side Liquidity resting right below at 145.872. That’s the likely kill zone. 💀
📐 4. Trade Setup (R:R Approx. 3.5:1)
🔼 Entry Zone: 147.980–148.050 (inside OB)
❌ Stop Loss: Just above OB: 148.400
✅ Target: 145.872 (Sell Side Liquidity sweep)
Perfect for swing traders and intraday SMC setups.
📊 Strategy:
Look for:
Bearish engulfing candle confirmation
Break of minor internal low (lower TF BOS)
Entry on OB rejection with tight SL above high
Bonus: Enter partials on FVG fill, hold runner to liquidity.
📎 Confluences:
✅ ChoCh confirmed
✅ Bearish OB
✅ Price rejecting from premium zone
✅ FVG below = imbalance magnet
✅ Sell-side liquidity clearly marked
⚠️ Risk Reminder:
Let price show intent before jumping in
Use confirmation, not assumption
Trade what the chart says, not what you hope
🔚 Summary:
Smart Money has flipped the script. With a strong ChoCh, OB rejection, and an FVG inviting price lower, this setup screams bearish continuation.
🔻 Expecting a clean run into liquidity. Stay sharp. 🧠
💬 Drop a “💀” if you’re eyeing the same setup.
📈 Follow for more clean SMC plays weekly.

EUR/GBP – Bearish Triangle Breakdown in Play (Long-Term Setup)This EUR/GBP weekly chart is flashing a long-term bearish triangle pattern that has finally broken down, signaling potential for a major move to the downside. This setup is packed with high-confluence signals that traders should not ignore.
🔍 Pattern Breakdown:
📐 Bearish Triangle Pattern
The pair has been forming lower highs while maintaining a relatively flat support base, forming a descending triangle, a classically bearish continuation pattern.
The pressure has been building for over 6 years, with buyers failing to make new highs while sellers stepped in aggressively at lower levels.
The triangle support has now been broken, and price is entering a retest phase, which is critical for confirming the breakdown.
🟧 Black Mind Curve Resistance
A unique visual tool here is the Black Mind Curve — a curved trendline that mirrors the psychology of long-term resistance.
This curve has consistently capped price action since the 2009 peak, reinforcing the dominance of sellers in this zone.
Every time price reached this curve, it reversed — confirming it as a dynamic resistance.
🧱 Major Horizontal Resistance Zone
The shaded blue zone around 0.92–0.93 represents a long-term resistance area, which has repeatedly rejected price for over a decade.
This zone also aligns with the Black Mind Curve, adding to the confluence.
The most recent swing high failed to break this area, and the pair rolled over again.
🔄 Retesting in Progress
After the recent breakdown of triangle support, price is currently retesting the underside of the broken support line (now acting as resistance).
This is a textbook setup: break → retest → continuation.
If this retest fails (which is likely based on history), the bearish move should resume.
🎯 Bearish Target Projection
The projected move from the triangle breakdown points to the 0.64330 area, which aligns with a major support level from early 2007 and 2008.
This level is a high-probability magnet if the pattern plays out in full — giving a long-term swing trade or position-trading opportunity.
🧠 Why This Matters (Pro Insights)
This chart is powerful because:
It’s on the weekly timeframe – high conviction and larger moves.
It shows a long-term squeeze finally breaking.
Resistance is reinforced by multiple layers (curve + horizontal zone).
Retest confirms possible continuation sell setup.
This isn’t a short-term scalp — it’s a position trade idea that could develop over months or even a couple years, with a massive risk-reward potential.
⚠️ Trade Plan Summary
Bias: Bearish
Pattern: Descending Triangle (broken)
Current Action: Retesting broken support
Entry Zone: On bearish rejection near 0.8400–0.8450
Stop Loss: Above resistance zone (around 0.9285)
Target: 0.64330
Risk/Reward: Potentially >4:1 on a swing basis

EUR/USD Rising Wedge Breakdown – Bearish Opportunity in Sight🔍 Technical Breakdown
🟦 1. Rising Wedge Pattern (Bearish)
The price has been moving within a tightening upward channel — forming higher highs and higher lows, but with decreasing momentum. This is a typical Rising Wedge, a pattern that signals exhaustion in an uptrend and typically resolves to the downside.
The pattern formed over several days.
Volume has been declining as the price pushed higher — a classic sign of weakening trend strength.
🚨 2. Major Resistance Zone
The wedge culminated near a major historical resistance zone (around 1.1400), which price failed to break multiple times — showing strong seller presence. This adds confluence to the bearish breakdown.
📉 3. Breakdown & Retest
Price broke below the lower wedge trendline, confirming the bearish reversal. After the breakdown, the pair appears to be retesting the previous support line — now acting as new resistance.
This retest is crucial — a successful rejection here typically confirms the breakdown and provides an ideal entry point for short positions.
⚡ Volume Clues
Note the "Volume Burst" earlier in the chart, followed by a sharp move up. But that rally was unsustainable — buyers couldn’t hold above resistance, and volume has since faded. This volume exhaustion is further evidence that bullish momentum is weakening.
🔄 Key Support Zones Below
Around 1.1200: A strong SR flip zone (support-turned-resistance), which could act as temporary support.
Final Bearish Target: Around 1.1070, a strong demand zone where price previously consolidated before the last bullish run.
This is the measured move target from the wedge height applied to the breakdown point.
🧠 Why This Matters (Trader Insight)
This setup combines:
A reliable bearish pattern (rising wedge)
Key horizontal resistance
A volume drop
A clean retest structure
That makes it a high-confluence short trade idea. These patterns don't always play out immediately, but when they do, they often drop hard.
📌 Trade Setup Summary
Bias: Bearish
Pattern : Rising Wedge (broken)
Current Action: Retesting the broken wedge
Entry Zone: 1.135–1.138 (retest confirmation)
First Target: 1.1200 (SR Flip)
Final Target: 1.1070 (Demand Zone)
Invalidation: Break and hold above 1.1410

USD/CAD Rate Drops Towards Yearly LowsUSD/CAD Rate Drops Towards Yearly Lows
The USD/CAD chart is currently showing clear signs of a bearish trend, characterised by a sequence of lower highs and lower lows (A→B→C→D→E→F→G).
This week’s decline suggests the downward structure may continue to develop, putting the current yearly low around the 1.3770 level at risk.
Why Is USD/CAD Falling?
On one hand, the US dollar remains under pressure:
→ Following last week’s downgrade of US debt ratings by Moody’s, investor attention has shifted to the country’s $36 trillion debt burden.
→ A tax bill backed by Donald Trump — recently passed in the Republican-controlled House of Representatives — could add trillions more to the national debt. Market participants may be increasingly concerned about the US’s fiscal outlook, prompting a shift towards safe-haven assets.
On the other hand, the Canadian dollar has strengthened this week relative to other major currencies. Tuesday’s CPI figures from Canada came in above analysts’ expectations and may be seen as a sign that the inflation surge could delay any potential rate cuts by the Bank of Canada.
USD/CAD Technical Analysis
In early May, we outlined a descending channel on the USD/CAD chart — a structure that remains relevant today.
The current price is hovering near the channel’s median line, which could indicate a temporary balance between supply and demand. However, with Canadian retail sales data due at 15:30 GMT+3 today, the risk of increased volatility remains high. A new weekly low cannot be ruled out.
This article represents the opinion of the Companies operating under the FXOpen brand only. It is not to be construed as an offer, solicitation, or recommendation with respect to products and services provided by the Companies operating under the FXOpen brand, nor is it to be considered financial advice.

EURUSD Pullback in Play – Next Stop: $1.1337EURUSD ( FX:EURUSD ) is moving in the Resistance zone($1.1310-$1.1162) while the upper line of the descending channel has been broken.
According to Elliott Wave theory , a breakout of the descending channel can at least confirm the end of a corrective wave . The corrective wave structure was a Double Three Correction(WXY) .
I expect EURUSD to rise to at least $1.1337 after completing a pullback to the upper line of the descending channel .
Note: If EURUSD touches $1.11590, we can expect further declines.
Please respect each other's ideas and express them politely if you agree or disagree.
Euro/U.S. Dollar Analyze (EURUSD), 4-hour time frame.
Be sure to follow the updated ideas.
Do not forget to put a Stop loss for your positions (For every position you want to open).
Please follow your strategy and updates; this is just my Idea, and I will gladly see your ideas in this post.
Please do not forget the ✅' like '✅ button 🙏😊 & Share it with your friends; thanks, and Trade safe.

AUDJPY at Key Resistance Level: Will it Drop To 92.850?OANDA:AUDJPY is approaching a key resistance level that has previously acted as a strong barrier, triggering bearish momentum in the past. Given its historical significance, how price reacts here could set the tone for the next move.
If bearish signals emerge, such as rejection wicks, bearish candlestick patterns, or signs of weakening bullish pressure, I anticipate a move toward the 92.850 level. However, a clear breakout above this resistance could challenge the bearish outlook and open the door for further upside. It's a pivotal area where price action will likely provide clearer clues on the next direction.
Just my take on support and resistance zones, not financial advice. Always confirm your setups and trade with a proper risk management.
Best of luck!

EUR/USD Short Opportunity – Rising Wedge + Retest + TargetThis technical setup on EUR/USD (1H timeframe) highlights a potential high-probability short opportunity based on a combination of price action, chart patterns, and key structural levels. The pair is showing signs of weakening bullish momentum and preparing for a bearish continuation.
🔎 1. Pattern Analysis: Rising Wedge Formation
The primary pattern visible is a Rising Wedge, which is traditionally a bearish reversal formation. It’s defined by:
Higher highs and higher lows, but both trendlines are converging, suggesting weakening bullish control.
Volume (not shown here) typically decreases within a rising wedge, further confirming a potential breakout.
This wedge formed after a previous sharp bullish recovery, acting as a continuation structure that often reverses.
In this case, the price formed multiple touches on both wedge boundaries, enhancing the reliability of the pattern.
🧱 2. Key Structural Zones:
Minor Resistance Zone (~1.1270–1.1285):
Clearly marked on the chart with a blue shaded zone.
Price has reacted from this level multiple times, validating it as a supply area.
The most recent attempt to break above this level failed, further confirming seller dominance.
Consolidation Zone (highlighted in yellow):
Prior to the wedge’s formation, price entered a consolidation phase.
Consolidation often precedes a breakout or a trend reversal. In this case, it provided a base for the rally that formed the wedge.
🔁 3. Breakout and Retest:
Price has broken below the lower support line of the rising wedge.
This breakout is a bearish signal and suggests the pair may now be ready for a stronger downside move.
The price appears to be retesting the broken wedge support, which is a classic confirmation move before continuation.
Retests of broken structures often offer low-risk, high-reward entry opportunities.
🎯 4. Trade Plan and Setup:
Entry Zone: Watch for bearish rejection or candle confirmation on the retest of the wedge support turned resistance.
Stop Loss (SL): Positioned just above the resistance zone, at 1.12887, protecting the trade against false breakouts or reversals.
Take Profit Levels:
TP1 – 1.10649: This level is a strong support zone based on previous price action and structural significance.
TP2 – 1.09670: The full measured move from the height of the wedge. This also aligns with historical support and psychological round number proximity (1.10).
🧠 5. Confluence Factors:
Technical Pattern: Rising wedge = bearish.
Support/Resistance: Multiple reactions to both the resistance zone and wedge trendlines confirm market memory.
Price Action: Break + retest = ideal entry confirmation.
Risk-Reward Ratio: Favorable, especially with conservative TP1 and aggressive TP2 levels.
Macro Context (optional): If posted during news week – potential USD strength based on rate expectations, NFP, or inflation.
⚠️ 6. Risk Management Tips:
Use a position size that aligns with your account risk tolerance (1–2% rule).
Wait for confirmation (bearish engulfing candle or rejection wick) before entering.
Always be prepared for invalidation. If price closes above the resistance zone, this idea is voided.

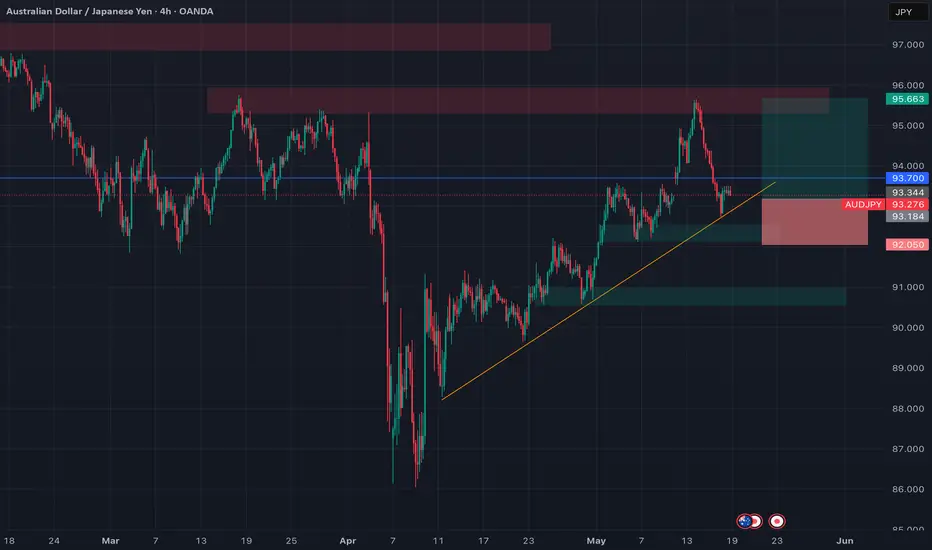
AUDJPY Long: Buy the Dip into Trendline + Seasonal AUD Surge🔹 Pair: AUD/JPY
🔹 Timeframe: 4H
🔹 Direction: Long
🔹 Status: Retesting Trendline Support
🔹 Entry Zone: 93.20–93.40 (Live Entry Area)
⸻
📊 Macro & Fundamental Confluence
🇦🇺 AUD – Bullish
• Strong Seasonality: Historically bullish May 19 – June 10.
• Conditional Score Rise: From 21 → 24 = Positive momentum shift.
• Dovish CB, But Risk-On: Supports carry trade flows into AUD.
• Macro View: Rebalancing inflation & trend recovery, AUD outperforming.
🇯🇵 JPY – Bearish
• BoJ Hawkish Talk, Dovish Action: Delayed inflation targets (to 2027).
• Score Flat: Minor rise (11 → 12), showing underperformance.
• Risk-On Mood: With VIX under 20, safe-haven demand fading.
• Macro Lag: JPY weakest G7 performer year-to-date.
🧠 Confluences Supporting the Trade
✅ Seasonal AUD strength
✅ Fundamental divergence: AUD strong, JPY weak
✅ Risk-on regime (favoring carry trades like AUDJPY)
✅ Trendline respected since April (bullish market structure)
✅ Support zone at 93.00–93.30 area
⸻
📈 Technical Setup
• Entry Zone: 93.20–93.40
• Stop Loss: 92.08 (below structure and ascending trendline)
• Take Profit:
• TP1: 95.40 (resistance zone)
• TP2: 96.00 (supply zone retest)
• Risk:Reward: ~1.8 – 2.2 depending on final entry
📌 Execution Notes
Watching for candle closure confirmation above 93.50.
Break below 92.08 invalidates the bullish bias.
This setup combines macro divergence, seasonal strength, and clean 4H market structure.
⸻
💬 Are you trading AUDJPY this week?
Drop your thoughts below ⬇️
GBP/USD 4H Analysis – Bearish Bias in PlayThe market never lies, it simply reflects behaviour. And right now, the behaviour around GBP/USD suggests one thing: bearish momentum.
As seen in this clean 4H chart, price failed to hold above the key horizontal resistance zone and now showing signs of weakness after a retest. I’ve marked a potential bearish projection (red arrow) based on:
Key Technical Factors:
Rejection from a prior structure zone
Clean lower highs forming
Breakdown and retest of minor support
Room below toward - near 1.30300 (next yellow line)
This setup aligns with a potential swing move down toward the next area. If price follows through, we could see a solid continuation to the downside in the coming sessions.
Patience and discipline over prediction. Let price confirm the story it’s telling.

Silver Retreats on Semiconductor TensionsSilver pulled back to around $32.50 in Friday’s Asian session, giving up part of its recent gains following reports that the U.S. plans to blacklist several Chinese semiconductor firms. Given silver’s integral role in electronics and chip manufacturing, the news weighed on sentiment.
Demand for precious metals has also weakened with easing trade tensions, as the U.S. and China agreed to reduce tariffs, cutting U.S. duties from 145% to 30% and China’s from 125% to 10%. Despite this, silver found support from a weakening U.S. dollar, which followed soft economic data reinforcing expectations for Federal Reserve rate cuts. Powell, however, warned that persistent supply shocks could complicate inflation control moving forward.
Resistance begins at $32.50, with further levels at $33.80 and $34.20. Support is seen at $31.40, followed by $30.20 and $29.80.

Yen Strengthens Despite Japan’s Q1 ContractionThe Japanese yen strengthened toward 145 per dollar, extending its rally for a fourth straight day, despite Japan’s economy shrinking by 0.2% in the first quarter, worse than forecasts. While the Bank of Japan acknowledged the risks posed by U.S. trade policies, it remains confident that rising wages and prices will support eventual policy normalization. Investors are closely watching U.S.-Japan trade negotiations, with Japan insisting that any deal must include the auto sector and that the 25% U.S. tariff on Japanese cars be removed.
Resistance is noted at 148.60, with further barriers at 149.80 and 151.20. Major support levels lie at 139.70, 137.00, and 135.00.

US Dollar Index (DXY) – Bullish Setup in PlayThe market has spoken and it’s whispering a potential bullish breakout .
As seen in the chart, the US Dollar Index (DXY) recently broke out from a short-term consolidation zone after forming a solid base near the 99.00 region. Currently, it's retesting a minor support level (highlighted by the yellow horizontal line).
Key Observation:
Price is holding above this support zone with strength. If this level holds, I anticipate a continuation to the upside as marked by the white arrow.
Target: The next major resistance zone lies near the 103.00 area, where price previously reversed. This becomes the logical next stop if the bullish momentum continues.
What I’m Watching:
Reaction from the current support zone
Strength of buyers stepping in
Any fundamental catalysts from USD-related news/events
In trading, it's not about predicting, it's about preparing. This chart reflects a classic "break-and-retest" scenario often seen before major moves.
Let’s see how this plays out over the coming days.

DXY Dual Perspective: Smart Money OB Short vs. Mid-Term LongThis chart presents two perspectives:
My Perspective (Dipanshu - GreenFireForex):
Expecting a bearish reversal from the current Order Block (OB) between 101.9 – 103.2, possibly due to inefficiency and early liquidity sweep.
ChatGPT’s Refined Perspective:
OB refined to 102.4 – 103.0 zone, aligning with imbalance and previous H4 structure break. A rejection from there is more probable.
Target:
Both views expect a drop toward the Demand Zone at 96.4 – 96.3, with bullish reversal expected from that key support.
Let’s observe whether the DXY respects early inefficiency or reaches full OB.
Comment your bias below!
---

Week of 5/11/25: EURUSD AnalysisEU has clean structure with Daily, 4h, and 1h bearish.
1h internal structure is bullish at the moment and we're waiting for that to break bearish before looking for any shorts.
We're going to be patient and wait for internal before looking for high probability trades.
Major news:
China trade talks - Monday
CPI - Tuesday
PPI/Unemployment - Thursday

EURUSD Is Ready to Break Resistance LinesEURUSD ( FX:EURUSD ) is trying to break the Resistance lines , it has tried several times in the past few days but failed. Will EURUSD succeed this time?
In terms of Elliott wave theory , it seems that EURUSD has completed the main wave 4 near the Support zone($1.1300-$1.1160) and Support line , and we should wait for impulsive waves . Breaking the Resistance zone($1.1480-$1.1420) can confirm the end of the main wave 4 . Otherwise , the main wave 4 can have other forms.
I expect EURUSD to break the Resistance lines in this attack and rise to at least $1.1384 , and the next target can be around $1.1437 .
Note: If EURUSD can break below $1.1272(the worst Stop Loss(SL)), we can expect more dumps.
Please respect each other's ideas and express them politely if you agree or disagree.
Euro/U.S. Dollar Analyze (EURUSD), 1-hour time frame.
Be sure to follow the updated ideas.
Do not forget to put a Stop loss for your positions (For every position you want to open).
Please follow your strategy and updates; this is just my Idea, and I will gladly see your ideas in this post.
Please do not forget the ✅' like '✅ button 🙏😊 & Share it with your friends; thanks, and Trade safe.

Week of 5/4/25: EURUSD AnalysisEurusd has been consolidating internally, but has made a final push bearish from Friday NFP. We're looking for a short at the flip zone of the 1h POI, but if it goes past that to the extreme of the internal structure, we will be cautious and wait for a break to switch bullish.
Thanks for stopping by!
Major News:
FOMC - Wednesday
Unemployment - Thursday

NZDCAD at Key Resistance Level: Will it Drop To 0.81608?OANDA:NZDCAD is approaching a key resistance level that has previously acted as a strong barrier, triggering bearish momentum in the past. This zone also aligns with prior supply areas where sellers have stepped in, making it a potential point of interest for those looking for short opportunities. Given its historical significance, how price reacts here could set the tone for the next move.
If bearish signals emerge, such as rejection wicks, bearish candlestick patterns, or signs of weakening bullish pressure, I anticipate a move toward the 0.81608 level. However, a clear breakout above this resistance could challenge the bearish outlook and open the door for further upside. It's a pivotal area where price action will likely provide clearer clues on the next direction.
Just my take on support and resistance zones, not financial advice. Always confirm your setups and trade with a proper risk management.
Best of luck!

CAD/JPY Rally Could Fade Near Resistance – Watch for ShortsThe CAD/JPY pair is currently trading within a well-defined descending trendline. Multiple rejections are visible around the 108.300, 105.864, 105.434, and 105.044 levels, confirming strong bearish control over the medium term.
Price has recently bounced from a critical horizontal support near 101.246, forming a short-term bullish move toward the descending trendline. We are now approaching a confluence zone near the 103.800–104.000 area, where the downtrend line intersects. This zone is a potential supply area and could act as a strong resistance.
Trade Idea: Sell Setup Near Trendline (103.800–104.000)
Target: 102.532, 101.250
Invalidation: Break and close above 104.200

USDCHF road map !!!I believe that if we look at the past prices, we will realize that the price may form a head and shoulders pattern and reach the desired supports.
Give me some energy !!
✨We spend hours finding potential opportunities and writing useful ideas, we would be happy if you support us.
Best regards CobraVanguard.💚
_ _ _ _ __ _ _ _ _ _ _ _ _ _ _ _ _ _ _ _ _ _ _ _ _ _ _ _ _ _ _ _
✅Thank you, and for more ideas, hit ❤️Like❤️ and 🌟Follow🌟!
⚠️Things can change...
The markets are always changing and even with all these signals, the market changes tend to be strong and fast!!

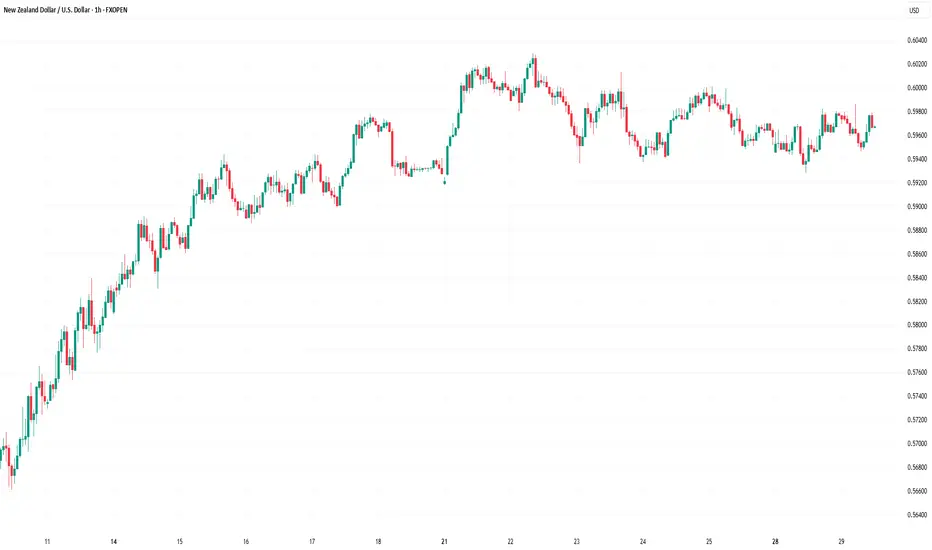
Market Analysis: NZD/USD DipsMarket Analysis: NZD/USD Dips
NZD/USD is trimming gains and struggling to stay above the 0.5945 pivot zone.
Important Takeaways for NZD/USD Analysis Today
- NZD/USD is declining from the 0.6030 resistance zone.
- There is a major bearish trend line forming with resistance near 0.5970 on the hourly chart of NZD/USD at FXOpen.
NZD/USD Technical Analysis
On the hourly chart of NZD/USD on FXOpen, the pair attempted another wave above the 0.6000 zone but failed. The New Zealand Dollar started another downward move from 0.6000 and dipped below 0.5980 against the US Dollar.
The pair settled below the 0.5970 level and the 50-hour simple moving average. It tested the 0.5930 zone and is currently consolidating losses near the 50% Fib retracement level of the downward move from the 0.6000 swing high to the 0.5928 low.
The NZD/USD chart suggests that the RSI is now well below 50 and signaling more downsides. On the downside, there is major support forming near 0.5945.
The next major support is near the 0.5920 level. If there is a downside break below the 0.5920 support, the pair might slide toward the 0.5880 support. Any more losses could lead NZD/USD in a bearish zone to 0.5840.
On the upside, the pair might struggle near 0.5970 and the 61.8% Fib retracement level of the downward move from the 0.6000 swing high to the 0.5928 low.
There is also a major bearish trend line forming with resistance near 0.5970. The next major resistance is near the 0.5985 level. A clear move above the 0.5985 level might even push the pair toward the 0.6000 level. Any more gains might clear the path for a move toward the 0.6030 resistance zone in the coming days.
This article represents the opinion of the Companies operating under the FXOpen brand only. It is not to be construed as an offer, solicitation, or recommendation with respect to products and services provided by the Companies operating under the FXOpen brand, nor is it to be considered financial advice.