USD/CAD ConsolidatesUSD/CAD Consolidates
In the second half of April, the USD/CAD chart has shown a decline in volatility following significant spikes observed since February.
The Canadian dollar has stabilised against the US dollar within the 1.390–1.380 range over the past week, as market participants assess what a fair USD/CAD rate might be, given the evolving news backdrop:
→ The US dollar gained upward momentum on hopes of easing trade tensions between the US and China, although the information remains conflicting — Trump claims negotiations are ongoing, while Beijing denies this.
→ Oil prices — a key Canadian export — have recovered by more than 10% from their April lows, providing support for the Canadian dollar.
→ Economic data published this week suggests a cooling in the Canadian economy: employment is declining, and the pace of average wage growth has slowed to 5.4%.
→ Although an important political event — the Canadian Parliamentary elections — is set to take place this weekend, it appears to have had little impact on the USD/CAD exchange rate so far. Trade tariffs between the US and Canada likely remain the dominant concern.
Technical Analysis of the USD/CAD Chart
Price fluctuations have formed a descending channel that originated in March.
From a bearish perspective, resistance may be encountered at:
→ the median line of the channel;
→ the psychological level of 1.400.
From a bullish perspective:
→ the price has formed a rounding bottom pattern near the 1.380 level;
→ the lower boundary of the channel is acting as significant support.
It is possible that the weekend will bring key developments that could act as catalysts, breaking the established range between 1.390 and 1.380.
This article represents the opinion of the Companies operating under the FXOpen brand only. It is not to be construed as an offer, solicitation, or recommendation with respect to products and services provided by the Companies operating under the FXOpen brand, nor is it to be considered financial advice.
Forexanalysis

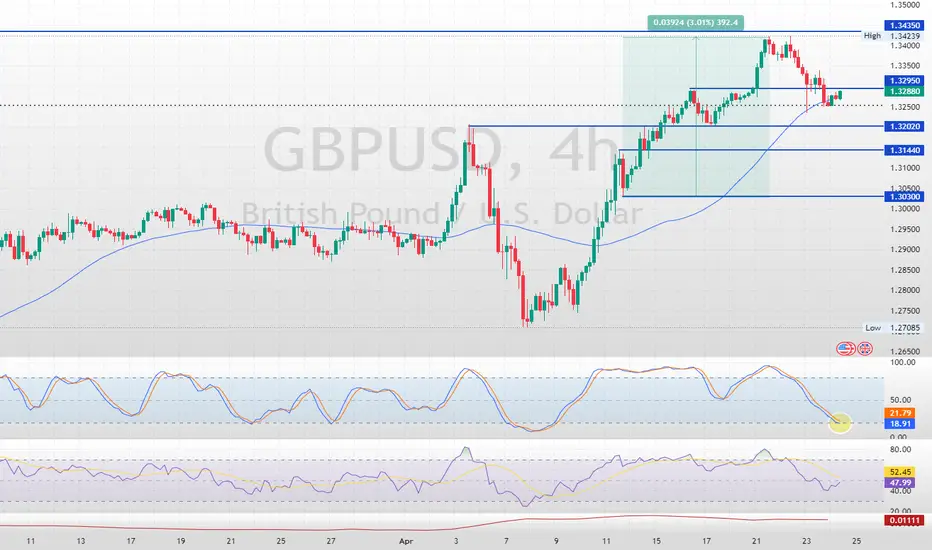
GBP/USD is Bullish: This Breakout Triggers the UptrendFenzoFx—GBP/USD fell from $1.3435, testing the 50-period simple moving average near $1.3276. The Stochastic Oscillator is nearing the 20 level, suggesting the US dollar is overbought in the short term.
Support lies at $1.3202. The outlook remains bullish while above this level, though a close above $1.3295 is needed to confirm upward momentum. A retest of $1.3435 could follow.
Bearish Scenario: A drop below $1.3202 would invalidate the bullish view, potentially extending the decline to $1.3144 or even $1.3030 under sustained selling pressure.
EUR/USD Consolidates: What's Next? FenzoFx—EUR/USD declined from $1.1571, as anticipated, due to overbought signals from the Stochastic and RSI 14 indicators. The pair now trades below the 50-period simple moving average, near $1.1350.
The Stochastic Oscillator has dropped below 20, suggesting the U.S. dollar is overvalued short-term. As long as the price remains above the $1.1259 support, the bullish outlook holds. Potential upside targets include $1.147 and $1.1571.
Bearish Scenario: If the price falls below $1.1259, bearish momentum may drive EUR/USD toward the next support at $1.1146.
>>> No Deposit Bonus
>>> %100 Deposit Bonus
>>> Forex Analysis Contest
All at FenzoFx Decentralized Forex Broker

GBP/USD is Overbought at Critical Resistance LevelFenzoFx—GBP/USD climbed to $1.3435, a key resistance near the September 2024 high. While the trend remains bullish, overbought signals from Stochastic and RSI-14 suggest limited upside.
If the pair stays below $1.3435, it may retreat to 1.3295 or even 1.3202.
>>> No Deposit Bonus
>>> %100 Deposit Bonus
>>> Forex Analysis Contest
All at FenzoFx Decentralized Forex Broker

USD/JPY Analysis: Exchange Rate Falls Below 140 Yen per DollarUSD/JPY Analysis: Exchange Rate Falls Below 140 Yen per Dollar Today
As shown on the USD/JPY chart today, the exchange rate between the US dollar and Japanese yen has fallen below 140 yen per dollar – marking the first time this has occurred in 2025. Since the beginning of the year, the rate has dropped by approximately 11%.
Among the main driving factors is the White House's tariff policy, which has triggered a sell-off in US government bonds and a weakening of the dollar. One of the more recent developments includes the release of the Consumer Price Index report by the Bank of Japan, which revealed that the CPI remained steady at 2.2%, despite analysts (according to ForexFactory) forecasting a rise to 2.4%.
It’s possible that, due to the lack of inflationary pressure in Japan, the yen is in a relatively stronger position compared to the US currency, where concerns persist that trade wars and Trump’s push for lower interest rates may lead to a spike in inflation and a devaluation of the dollar.
Technical Analysis of the USD/JPY Chart
It’s worth noting that the psychological level of 140 yen per dollar has acted as key support since late 2023. On the rare occasions when the rate has dipped below this mark, the bulls have soon regained confidence, prompting a reversal.
It’s quite possible we may witness a similar attempt on the USD/JPY chart in the coming weeks or even days. However, the current outlook remains bearish, as the price has broken below the Descending Wedge pattern (marked with black lines), indicating that supply is outweighing demand.
This article represents the opinion of the Companies operating under the FXOpen brand only. It is not to be construed as an offer, solicitation, or recommendation with respect to products and services provided by the Companies operating under the FXOpen brand, nor is it to be considered financial advice.

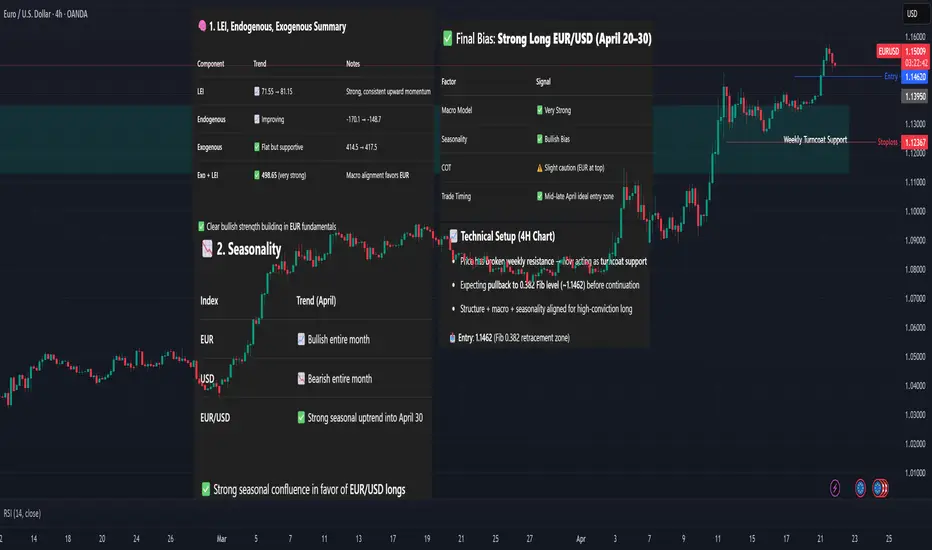
EUR/USD – Pullback Entry After Weekly Breakout🧠 Macro View
LEI rising steadily: 71.5 → 81.15
Endogenous strength improving each month
Exo+LEI composite score: 498.65 → one of the strongest major FX models
USD: Fundamentally weak with dovish Fed, neutral COT
📅 Seasonality
📈 EUR Index bullish throughout April
📉 USD Index bearish all month
🔥 EUR/USD seasonality = strong long bias into April 30
📈 Technical Setup (4H Chart)
Price has broken weekly resistance → now acting as turncoat support
Expecting pullback to 0.382 Fib level (~1.1462) before continuation
Structure + macro + seasonality aligned for high-conviction long
📥 Entry: 1.1462 (Fib 0.382 retracement zone)
⛔ Stop Loss: Below (1.12424)
🎯 Take Profit: Retest high or 1.1583 and beyond (extension optional)
🧮 R:R ≈ 1:2.2+
Crude Oil Stabilizes Above Key Fibonacci LevelFenzoFx—Crude Oil is consolidating after testing $63.9 resistance, trading near $62.23, supported by the 50.0% Fibonacci retracement.
While the bullish trend persists above the 50-period simple moving average, the Stochastic Oscillator shows an oversold condition, hinting at a rebound.
A bullish wave may target $64.00 if Oil holds above $62.00. However, if it dips below this level, momentum could extend down to $60.77, near the 78.6% Fibonacci retracement.
>>> No Deposit Bonus
>>> %100 Deposit Bonus
>>> Forex Analysis Contest
All at FenzoFx Decentralized Forex Broker

AUD/USD Secures Bullish Momentum Above $0.6407FenzoFx—AUD/USD closed above $0.6407 and remains stable, signaling a bullish trend supported by the 50-period simple moving average.
However, indicators like Stochastic and RSI 14 suggest an overbought condition, hinting at a possible correction. Key support lies at $0.6395, with traders watching for bullish signals such as candlestick patterns.
The outlook stays bullish above $0.6276, while dips below this level could trigger extended consolidation.
>>> No Deposit Bonus
>>> %100 Deposit Bonus
>>> Forex Analysis Contest
All at FenzoFx Decentralized Forex Broker

USD remains weak across the board. EUR, GBP & JPY Bullish.Not much action due to the extended market break and Easter weekend but I expect more USD selling across the board in the coming weeks ahead.
Long positions are sitting tight but two areas I am keeping an eye on are 1.1200 as a base support and 1.1500 as the resistance hurdle we need to clear in order to open up the gates to 1.2000+
GBP/USD is still a bullish case for me as the short term resistance may be cracking and I'm still expecting for the JPY to advance against the USD.
It's good to get a break from the market volatility but I surely expect it to resume in the coming week!
Good Luck & Trade Safe!

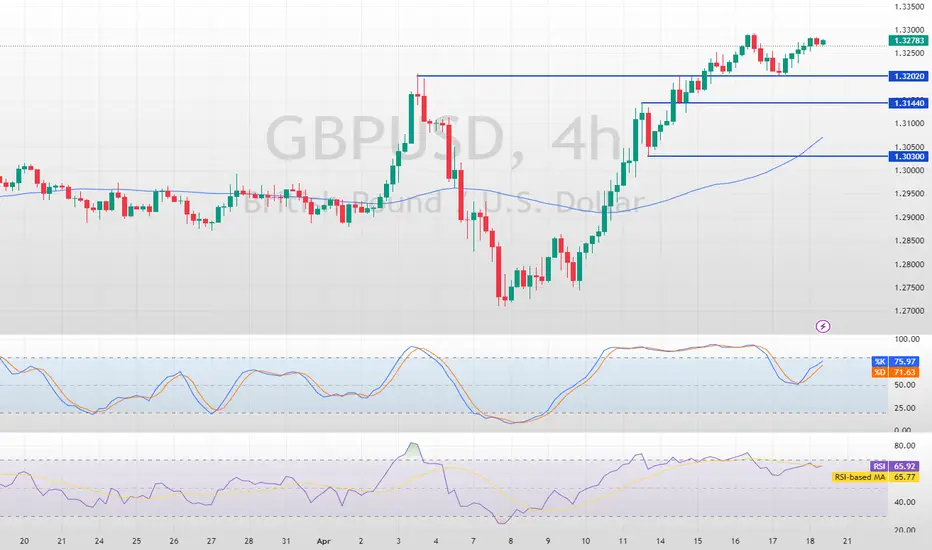
GBP/USD AnalysisFenzoFx—The GBP/USD pair rebounded from $1.3202 support, currently trading around $1.3277 and continuing its bullish trend.
As long as it stays above $1.3144, the next target could be $1.3435. On the flip side, a break below $1.3144 may trigger a bearish move towards $1.3030.
>>> No Deposit Bonus
>>> %100 Deposit Bonus
>>> Forex Analysis Contest
All at F enzo F x Decentralized Forex Broker
XAU/USD Enters Fourth Wave ConsolidationCurrently, XAU/USD appears to have completed the third wave, and the beginning of the fourth wave seems to be underway, indicating the start of a corrective phase. This correction can potentially extend down to the 3118.486 level. In terms of targets, the key levels to watch are 3166.464 and 3117.451 . Following this correction, there is a possibility that the fifth wave may commence.

Week of 4/13/25: EURUSD AnalysisAll structure is bullish so our bias remains bullish until the MTF (1H) breaks bearish. I have a bullish daily bias that is looking for the Daily supply level above this local high.
Major News: Unemployment Claims - Thursday

Expecting more USD selling overall: Weekly Market PreviewIn this video I go over last week's epic volatility and what I am looking for going forward.
Long positions on EUR/USD at 1.0980 will remain in tact and still eyeing a target of 1.2000 out of the falling wedge displayed on both the monthly and quarterly charts.
I do expect some pullback after a massive move to the upside to end the week however, the bull can become relentless and continue it's strength due to the U.S. Dollar weakness across the board.
USD/JPY is another one I am watching and initiated a short position at 143.31 with a target at 133. If the large weekly broadening pattern runs it's course, I expect for that target to get hit.
Tech may get relief after Trump announced over the weekend that there will be exemptions but the market can remain irrational and continue overall weakness especially since the U.S. economy as a whole is not well.
Hope you enjoy the video and we'll see what we get this upcoming week, especially with Federal Reserve Powell set to speak on Wednesday.
As always, Good Luck & Trade Safe.

Market Analysis: USD/CHF DivesMarket Analysis: USD/CHF Dives
USD/CHF declined and is now struggling below the 0.8615 resistance.
Important Takeaways for USD/CHF Analysis Today
- USD/CHF declined below the 0.8675 and 0.8615 support levels.
- There is a short-term bearish trend line forming with resistance near 0.8550 on the hourly chart at FXOpen.
USD/CHF Technical Analysis
On the hourly chart of USD/CHF at FXOpen, the pair started a fresh decline from well above the 0.8800 zone. The US Dollar dropped below the 0.8675 support to move into a negative zone against the Swiss Franc.
The bears pushed the pair below the 50-hour simple moving average and 0.8615. Finally, the bulls appeared near the 0.8420 level. A low was formed near 0.8421 and the pair is now consolidating losses.
On the upside, the pair could face resistance near the 0.8480 level. It is near the 23.6% Fib retracement level of the downward move from the 0.8674 swing high to the 0.8421 low. The next major resistance is near the 0.8550 level.
There is also a short-term bearish trend line forming with resistance near 0.8550. It coincides with the 50% Fib retracement level of the downward move from the 0.8674 swing high to the 0.8421 low, above which the pair could test the 0.8615 level.
If there is a clear break above the 0.8615 resistance zone, the pair could start another increase. In the stated case, it could even surpass 0.8675.
On the downside, immediate support on the USD/CHF chart is 0.8420. The first major support is near the 0.8400 level. The next major support is near 0.8350. Any more losses may possibly open the doors for a move toward the 0.8220 level in the coming days.
This article represents the opinion of the Companies operating under the FXOpen brand only. It is not to be construed as an offer, solicitation, or recommendation with respect to products and services provided by the Companies operating under the FXOpen brand, nor is it to be considered financial advice.

Market Analysis: EUR/USD Resumes IncreaseMarket Analysis: EUR/USD Resumes Increase
EUR/USD started a fresh increase above the 1.0950 resistance.
Important Takeaways for EUR/USD Analysis Today
- The Euro started a decent upward move from the 1.0880 zone against the US Dollar.
- There was a break above a key bearish trend line with resistance at 1.0955 on the hourly chart of EUR/USD at FXOpen.
EUR/USD Technical Analysis
On the hourly chart of EUR/USD at FXOpen, the pair started a fresh increase from the 1.0775 zone. The Euro cleared the 1.0950 resistance to move into a bullish zone against the US Dollar, as mentioned in the last analysis.
The bulls pushed the pair above the 50-hour simple moving average and 1.1000. Finally, the pair tested the 1.1150 resistance. A high was formed near 1.1146 before the pair corrected gains. It dipped below 1.1000 and tested 1.0880.
The pair is again rising from the 1.0880 zone. There was a break above a key bearish trend line with resistance at 1.0955. The pair climbed above the 50% Fib retracement level of the downward move from the 1.1146 swing high to the 1.0880 low.
Immediate resistance on the EUR/USD chart is near the 1.1045 zone and the 61.8% Fib retracement level of the downward move from the 1.1146 swing high to the 1.0880 low.
The first major resistance is near the 1.1080 level. An upside break above the 1.1080 level might send the pair toward the 1.1145 resistance. The next major resistance is near the 1.1165 level. Any more gains might open the doors for a move toward the 1.1200 level.
Immediate support on the downside is near the 1.0955 level. The next major support is the 1.0880 level. A downside break below the 1.0880 support could send the pair toward the 1.0830 level. Any more losses might send the pair into a bearish zone toward 1.0775.
This article represents the opinion of the Companies operating under the FXOpen brand only. It is not to be construed as an offer, solicitation, or recommendation with respect to products and services provided by the Companies operating under the FXOpen brand, nor is it to be considered financial advice.

NZD/USD Analysis: Exchange Rate Nears 2025 LowNZD/USD Analysis: Exchange Rate Nears 2025 Low
Less than a month ago, we analysed the NZD/USD chart and:
→ highlighted the key resistance level at 0.5800;
→ outlined a potential scenario involving a decline from that zone.
Now, the NZD/USD pair is trading close to its lowest level of 2025, recorded on 3 February near 0.5525. The latest surge in volatility appears to be driven by President Trump’s widely discussed decision to impose substantial tariffs on trade with multiple countries.
For context, the Australian dollar has fallen to a five-year low amid concerns that retaliatory trade measures could trigger a global recession. The New Zealand dollar, however, has remained somewhat more stable — possibly because traders are anticipating Wednesday’s Reserve Bank of New Zealand (RBNZ) meeting, where the central bank may signal efforts to stabilise the currency. According to Forex Factory, a rate cut from 3.75% to 3.50% is expected.
Technical analysis of NZD/USD chart
Price movements in 2025 have formed an ascending channel (marked in blue), but bears broke through the lower boundary late last week near the 0.5666 level.
This suggests that even if NZD/USD sees a short-term rebound, it may face resistance around that same level — a classic “break-and-retest” pattern often watched by traders.
This article represents the opinion of the Companies operating under the FXOpen brand only. It is not to be construed as an offer, solicitation, or recommendation with respect to products and services provided by the Companies operating under the FXOpen brand, nor is it to be considered financial advice.

USD Bear is here: Important Analysis on FX Pairs, Stock MarketIn this video I got over some important outlooks on the EUR/USD, GBP/USD and USD/JPY along with outlook on the stock market.
The U.S. Dollar has been getting absolutely crushed along with the stock market which usually has the opposite effect. Considering we may be into a stagflation scenario, this is not surprising.
Tariffs have spiked volatility and puts the Federal Reserve in a very tight spot of Interest Rate Policy. Interesting times ahead to say the least.
From a pure technical analysis point of view, the USD may be set for much further losses as monthly patterns suggest a big move may be on the horizon. Will be keeping a very close eye on these as we move forward in these stormy waters of the U.S. economy.
As always, Good Luck & Trade Safe.

USD/CHF Falls to Its Lowest Level in Nearly Five MonthsUSD/CHF Falls to Its Lowest Level in Nearly Five Months
Today, the exchange rate of one US dollar against the Swiss franc dropped below 0.87000 francs—its lowest level since early November 2024.
Since the start of 2025, the USD/CHF pair has declined by more than 4%.
Why Is USD/CHF Falling Today?
On one hand, the US dollar is weakening against other currencies due to Trump’s decision to implement the previously announced tariffs on international trade, as mentioned in our previous post.
On the other hand, the Swiss franc is gaining strength due to its appeal as a safe-haven asset. Furthermore, this morning’s release of the Consumer Price Index (CPI) showed that inflation in Switzerland remains at zero, increasing the franc’s value at a time when tariff conflicts pose risks to the global economy.
Technical Analysis of the USD/CHF Chart
Since the start of 2025, the USD/CHF pair has been following a downward trajectory, highlighted by a declining channel (marked in red), with the following key points:
→ The median line has shifted from support to resistance, as indicated by the arrows.
→ The price broke through the March support level around 0.8757, accelerating the decline.
→ The lower boundary of the channel provided support this morning, slowing bearish momentum.
It is possible that the 0.8757 level will act as resistance in April 2025. However, the future direction of USD/CHF will largely depend on news developments, particularly statements from global leaders regarding tariffs in international trade.
This article represents the opinion of the Companies operating under the FXOpen brand only. It is not to be construed as an offer, solicitation, or recommendation with respect to products and services provided by the Companies operating under the FXOpen brand, nor is it to be considered financial advice.

XAUUSD 1H, 03/04/2025, 11:20AM.XAUUSD this trade is going good, almost 60% target done. Still holding this trade with breakeven.

XAUUSD 1H, 03/04/2025, 07:00AM.I believe it's a great opportunity to capitalize on the recent upward movement in XAUUSD and to take advantage of a favorable selling setup in the near future.

XAUUSD 1H, 02/04/2025, 11:00 AM.Because the market hasn't reached our entry point, we can't enter into this trade, but the market is still on our side, so we can recite a failed with no profit and no loss for this trade.

GBPJPY | 15M | SCALPING TIME | LIMIT ORDER Hey There;
SIGNAL ALERT
BUY LIMIT GBPJPY / 192,900 , 193,740
🟢TP1: 193,200
🟢TP2: 193,550
🟢TP3: 194,400
🔴SL: 192,257
RISK REWARD - 2,41
Please don't forget to like 🙏🏻💙

NZDJPY Approaching Key Resistance — Potential Sell SetupOANDA:NZDJPY is approaching a key resistance zone, a level where sellers have consistently stepped in, leading to notable bearish reversals in the past. This area is marked by strong selling pressure, increasing the likelihood of a bearish move if sellers regain control.
The current price action suggests that if the pair confirms resistance through signals like bearish engulfing candles, long upper wicks, or increased selling volume, we could see a downward move toward 86.100, which represents a logical target based on previous price behavior and market structure.
However, if the price breaks above this zone and sustains, the bearish outlook may be invalidated, opening the door for further upside.
Just my take on support and resistance zones—not financial advice. Always confirm your setups and trade with solid risk management.
Best of luck!
