Market Analysis: NZD/USD Rebound: Signs of Trend Shift?Market Analysis: NZD/USD Rebound: Signs of Trend Shift?
NZD/USD is also rising and might aim for more gains above 0.5700.
Important Takeaways for NZD USD Analysis Today
- NZD/USD is consolidating gains above the 0.5600 zone.
- There is a key declining channel forming with resistance at 0.5680 on the hourly chart of NZD/USD at FXOpen.
NZD/USD Technical Analysis
On the hourly chart of NZD/USD on FXOpen, the pair started a steady increase from the 0.5515 zone. The New Zealand Dollar broke the 0.5600 resistance to start the recent increase against the US Dollar.
The pair settled above 0.5630 and the 50-hour simple moving average. It tested the 0.5700 zone and is currently correcting gains. The pair corrected lower below the 0.5660 level. However, the bulls are active above the 0.5630 level.
The NZD/USD chart suggests that the RSI is now moving higher toward 50. On the upside, the pair might struggle near 0.5660. The next major resistance is near the 0.5680 level. There is also a key declining channel forming with resistance at 0.5680.
A clear move above the 0.5680 level might even push the pair toward the 0.5700 level. Any more gains might clear the path for a move toward the 0.5750 resistance zone in the coming days.
On the downside, immediate support is near the 0.5630 level. The first key support is near the 50% Fib retracement level of the upward move from the 0.5516 swing low to the 0.5702 high. The next major support is near the 0.5560 level.
If there is a downside break below the 0.5560 support, the pair might slide toward the 0.5515 support. Any more losses could lead NZD/USD in a bearish zone to 0.5440.
Trade on TradingView with FXOpen. Consider opening an account and access over 700 markets with tight spreads from 0.0 pips and low commissions from $1.50 per lot.
This article represents the opinion of the Companies operating under the FXOpen brand only. It is not to be construed as an offer, solicitation, or recommendation with respect to products and services provided by the Companies operating under the FXOpen brand, nor is it to be considered financial advice.
Forexanalysis

Market Analysis: AUD/USD Rebound: Signs of Trend Shift?Market Analysis: AUD/USD Rebound: Signs of Trend Shift?
AUD/USD started a decent increase above the 0.6200 and 0.6240 levels.
Important Takeaways for AUD USD Analysis Today
- The Aussie Dollar rebounded after forming a base above the 0.6100 level against the US Dollar.
- There was a break below a connecting bullish trend line with support at 0.6255 on the hourly chart of AUD/USD at FXOpen.
AUD/USD Technical Analysis
On the hourly chart of AUD/USD at FXOpen, the pair started a fresh increase from the 0.6090 support. The Aussie Dollar was able to clear the 0.6170 resistance to move into a positive zone against the US Dollar.
There was a close above the 0.6240 resistance and the 50-hour simple moving average. Finally, the pair tested the 0.6300 zone. A high was formed near 0.6301 and the pair recently saw a minor pullback.
There was a move below the 0.6300 level. The pair declined below the 23.6% Fib retracement level of the upward move from the 0.6088 swing low to the 0.6301 high. Besides, there was a break below a connecting bullish trend line with support at 0.6255.
On the downside, initial support is near the 0.6240 level. The next major support is near the 0.6195 zone or the 50% Fib retracement level of the upward move from the 0.6088 swing low to the 0.6301 high.
If there is a downside break below the 0.6195 support, the pair could extend its decline toward the 0.6170 level. Any more losses might signal a move toward 0.6090.
On the upside, the AUD/USD chart indicates that the pair is now facing resistance near 0.6270. The first major resistance might be 0.6300. An upside break above the 0.6300 resistance might send the pair further higher.
The next major resistance is near the 0.6335 level. Any more gains could clear the path for a move toward the 0.6380 resistance zone.
Trade on TradingView with FXOpen. Consider opening an account and access over 700 markets with tight spreads from 0.0 pips and low commissions from $1.50 per lot.
This article represents the opinion of the Companies operating under the FXOpen brand only. It is not to be construed as an offer, solicitation, or recommendation with respect to products and services provided by the Companies operating under the FXOpen brand, nor is it to be considered financial advice.

GBPUSD Sell signal has been triggered!Hey Guys,
Based on the chart price rejected from and resistance area that is displayed on the chart.
So based on this scenario and with considering the bearish movement in previous days, we can consider this as another sell opportunity with good risk/reward ratio (1/5).
I will update this post based on market movements in close future.
Good luck & Have fun! 😊

USD/CAD Exchange Rate StabilisesUSD/CAD Exchange Rate Stabilises
As we reported on 3 February, the decision by the US president to impose 25% tariffs on goods imported from Canada sent the USD/CAD rate soaring to a 22-year high.
However, after a round of negotiations between Donald Trump and Justin Trudeau, the tariff implementation was postponed by a month, which was reflected in the USD/CAD exchange rate chart.
Current USD/CAD Chart Analysis:
→ The price has retreated from the upper boundary of the ascending channel identified three days ago and has now dropped below its lower boundary.
→ The price has returned to and remains within the broad 1.4270 – 1.4460 range.
→ The ATR indicator has reversed from its peak and is trending downward.
Given these factors, it is reasonable to say that USD/CAD is stabilising after recent volatility. But what lies ahead?
The exchange rate may fluctuate within the 1.4270 – 1.4460 range, reacting sensitively to any news on Trump’s tariff policies and his startling suggestion of making Canada the 51st US state.
Trade on TradingView with FXOpen. Consider opening an account and access over 700 markets with tight spreads from 0.0 pips and low commissions from $1.50 per lot.
This article represents the opinion of the Companies operating under the FXOpen brand only. It is not to be construed as an offer, solicitation, or recommendation with respect to products and services provided by the Companies operating under the FXOpen brand, nor is it to be considered financial advice.

Market Analysis: USD/CHF Takes HitMarket Analysis: USD/CHF Takes Hit
USD/CHF declined and now struggling below the 0.9120 resistance.
Important Takeaways for USD/CHF Analysis Today
- USD/CHF declined below the 0.9160 and 0.9120 support levels.
- There was a break below a major bullish trend line with support
USD/CHF Technical Analysis
On the hourly chart of USD/CHF at FXOpen, the pair started a fresh decline from well above the 0.9180 zone. The US Dollar dropped below the 0.9160 support to move into a negative zone against the Swiss Franc.
The bears pushed the pair below the 50-hour simple moving average and 0.9075. Finally, the bulls appeared near the 0.9040 level. A low was formed near 0.9039 and the pair is now consolidating losses.
On the upside, the pair could face resistance near the 0.9075 level and the 23.6% Fib retracement level of the downward move from the 0.9196 swing high to the 0.9039 low. The next major resistance is near the 0.9120 level.
The 50% Fib retracement level of the downward move from the 0.9196 swing high to the 0.9039 low is also near 0.9120, above which the pair could test the 0.9160 zone.
If there is a clear break above the 0.9160 resistance zone, the pair could start another increase. In the stated case, it could even surpass 0.9200.
On the downside, immediate support on the USD/CHF chart is 0.9040. The first major support is near the 0.9020 level. The next major support is near 0.9000. Any more losses may possibly open the doors for a move toward the 0.8880 level in the coming days.
Trade on TradingView with FXOpen. Consider opening an account and access over 700 markets with tight spreads from 0.0 pips and low commissions from $1.50 per lot.
This article represents the opinion of the Companies operating under the FXOpen brand only. It is not to be construed as an offer, solicitation, or recommendation with respect to products and services provided by the Companies operating under the FXOpen brand, nor is it to be considered financial advice.

Market Analysis: EUR/USD RecoversMarket Analysis: EUR/USD Recovers
EUR/USD started a fresh increase above the 1.0310 resistance.
Important Takeaways for EUR/USD Analysis Today
- The Euro started a decent recovery wave from the 1.0210 zone against the US Dollar.
- There was a break above a connecting bearish trend line with resistance at 1.0340 on the hourly chart of EUR/USD at FXOpen.
EUR/USD Technical Analysis
On the hourly chart of EUR/USD at FXOpen, the pair started a recovery wave after a major decline, as mentioned in the last analysis. The Euro cleared the 1.02700 resistance to move into a short-term bullish zone against the US Dollar
The bulls pushed the pair above the 50-hour simple moving average and 1.0310. The pair cleared the 50% Fib retracement level of the downward move from the 1.0467 swing high to the 1.0210 low.
Besides, there was a break above a connecting bearish trend line with resistance at 1.0340. Immediate resistance on the EUR/USD chartis near the 1.0390 zone. The first major resistance is near the 1.0410 level and the 76.4% Fib retracement level of the downward move from the 1.0467 swing high to the 1.0210 low.
An upside break above the 1.0410 level might send the pair toward the 1.0465 resistance. The next major resistance is near the 1.0500 level. Any more gains might open the doors for a move toward the 1.0550 level.
Immediate support on the downside is near the 1.0340 level. The next major support is the 1.0310 level. A downside break below the 1.0310 support could send the pair toward the 1.0270 level. Any more losses might send the pair into a bearish zone toward 1.0210.
Trade on TradingView with FXOpen. Consider opening an account and access over 700 markets with tight spreads from 0.0 pips and low commissions from $1.50 per lot.
This article represents the opinion of the Companies operating under the FXOpen brand only. It is not to be construed as an offer, solicitation, or recommendation with respect to products and services provided by the Companies operating under the FXOpen brand, nor is it to be considered financial advice.

NZD/USD Analysis: Recovery from 27-Month LowNZD/USD Analysis: Recovery from 27-Month Low
This morning, New Zealand’s labour market data was released, showing unfavourable results. The unemployment rate rose to 5.1% in Q4, the highest since Q3 2020, signalling economic slowdown and reinforcing expectations of a rate cut by the Reserve Bank of New Zealand at its meeting in late February.
However, the weak labour market figures were widely anticipated and already priced in. A greater source of uncertainty is the ongoing trade war between the US and China, a key trading partner for both Australia and New Zealand.
Donald Trump stated that he is "in no rush" to speak with Xi Jinping after China retaliated against the 10% US tariffs on Chinese imports.
Technical analysis of the NZD/USD chart shows that:
→ The pair remains in a downward trend (marked in red), driven by a strengthening US dollar. The price is currently near the upper boundary of this trend.
→ The 0.555 level acted as support twice in 2025, as indicated by arrows. Notably, the price also reversed upwards from this area in 2022.
It is possible that buyers will gain confidence and attempt to break the upper boundary of the channel. The future trajectory of NZD/USD will largely depend on news related not only to central bank interest rate decisions but also to government actions on tariffs.
Trade on TradingView with FXOpen. Consider opening an account and access over 700 markets with tight spreads from 0.0 pips and low commissions from $1.50 per lot.
This article represents the opinion of the Companies operating under the FXOpen brand only. It is not to be construed as an offer, solicitation, or recommendation with respect to products and services provided by the Companies operating under the FXOpen brand, nor is it to be considered financial advice.

USD/CNH Chart Sees Spike in Volatility Due to TariffsUSD/CNH Chart Sees Spike in Volatility Due to Tariffs
In response to the Trump administration's 10% tariff on Chinese goods, Beijing vowed to challenge the decision at the World Trade Organization.
Moreover, Chinese authorities have:
→ imposed retaliatory tariffs of 15% on US coal and liquefied gas, and 10% tariffs on oil and agricultural machinery;
→ launched an investigation into Google for potential anti-competitive practices.
These recent developments have triggered a spike in volatility for the Chinese yuan against the US dollar. As the USD/CNH chart shows today, the ATR indicator is at its highest level since early November, when Trump celebrated his election victory.
On 9 January, in our analysis of the USD/CNH exchange rate, we noted:
→ the importance of the 7.35 level, which had acted as resistance for several months;
→ according to Wang Tao, chief economist at UBS China, the yuan may weaken to 7.6 per dollar by the end of 2025 if the Trump administration imposes higher tariffs.
Today's technical analysis of the USD/CNH chart shows:
→ the rate is supported by the lower boundary of an expanded ascending channel (shown in blue);
→ the 7.35 level continues to act as resistance (as indicated by the red arrow).
Thus, at the beginning of February 2025, we may witness the formation of a narrowing triangle (shown by the black lines), and a breakout could lead to a significant trend movement. How realistic this assumption is largely depends on how the ongoing tariff conflict between the US and China develops.
Trade on TradingView with FXOpen. Consider opening an account and access over 700 markets with tight spreads from 0.0 pips and low commissions from $1.50 per lot.
This article represents the opinion of the Companies operating under the FXOpen brand only. It is not to be construed as an offer, solicitation, or recommendation with respect to products and services provided by the Companies operating under the FXOpen brand, nor is it to be considered financial advice.

EUR/SGD LongInto higher timeframe support.
The take profit is the moving average so will come slightly lower over time.


Market Analysis: EUR/GBP Falls Into The RedMarket Analysis: EUR/GBP Falls Into The Red
EUR/GBP is declining and trading below the 0.8400 support level.
Important Takeaways for EUR/GBP Analysis Today
- EUR/GBP is declining and showing bearish signs below 0.8400.
- There is a key bearish trend line forming with resistance at 0.8370 on the hourly chart at FXOpen.
EUR/GBP Technical Analysis
On the hourly chart of EUR/GBP at FXOpen, the pair struggled to gain pace for a move above 0.8420. The Euro settled below 0.8400 and started a fresh decline against the British Pound.
There was a clear move below the 0.8350 pivot level. The EUR/GBP chart suggests that the pair settled below the 50-hour simple moving average and 0.8340. A low is formed near 0.8307 and the pair is now consolidating losses.
Immediate resistance is near the 50% Fib retracement level of the downward move from the 0.8389 swing high to the 0.8307 low at 0.8350.
The next major resistance could be near the 50-hour simple moving average and the 61.8% Fib retracement level of the downward move from the 0.8389 swing high to the 0.8307 low at 0.8370. There is also a key bearish trend line forming with resistance at 0.8370.
A close above the 0.8370 level might accelerate gains. In the stated case, the bulls may perhaps aim for a test of 0.8420. Any more gains might send the pair toward the 0.8450 level.
Immediate support sits near 0.8325. The next major support is near 0.8305. A downside break below the 0.8305 support might call for more downsides. In the stated case, the pair could drop toward the 0.8265 support level.
Trade on TradingView with FXOpen. Consider opening an account and access over 700 markets with tight spreads from 0.0 pips and low commissions from $1.50 per lot.
This article represents the opinion of the Companies operating under the FXOpen brand only. It is not to be construed as an offer, solicitation, or recommendation with respect to products and services provided by the Companies operating under the FXOpen brand, nor is it to be considered financial advice.

Market Analysis: GBP/USD Falls Into The RedMarket Analysis: GBP/USD Falls Into The Red
GBP/USD failed to climb above 1.2500 and trimmed all gains.
Important Takeaways for GBP/USD Analysis Today
- The British Pound is showing bearish signs below 1.2400.
- There is a short-term declining channel forming with resistance near 1.2280 on the hourly chart of GBP/USD at FXOpen.
GBP/USD Technical Analysis
On the hourly chart of GBP/USD at FXOpen, the pair started a fresh decline from the 1.2470 zone. As mentioned in the previous analysis, the British Pound struggled to extend gains and declined below the 1.2360 support level against the US Dollar.
There was a clear move below the 1.2320 level. The pair even settled below the 1.2300 level and the 50-hour simple moving average. The pair tested the 1.2250 support zone.
A low was formed at 1.2249 and the pair is now consolidating losses. On the upside, the GBP/USD chart indicates that the pair is facing resistance near 1.2280 and a short-term declining channel. The next major resistance is near the 1.2320.
A close above the 1.2320 resistance zone could open the doors for a move toward the 50% Fib retracement level of the downward move from the 1.2471 swing high to the 1.2249 low at 1.2360.
Any more gains might send it toward the 61.8% Fib retracement level of the downward move from the 1.2471 swing high to the 1.2249 low at 1.2385. If not, the pair could resume its decline below 1.2250. On the downside, there is a key support forming near 1.2220.
If there is a downside break below the 1.2220 support, the pair could accelerate lower. The next major support is near the 1.2150 zone, below which the pair could test 1.2050. Any more losses could lead the pair toward the 1.2000 support.
Trade on TradingView with FXOpen. Consider opening an account and access over 700 markets with tight spreads from 0.0 pips and low commissions from $1.50 per lot.
This article represents the opinion of the Companies operating under the FXOpen brand only. It is not to be construed as an offer, solicitation, or recommendation with respect to products and services provided by the Companies operating under the FXOpen brand, nor is it to be considered financial advice.

US Economic Data Impact: Will EURUSD Test Support zone Again?Today, key U.S. economic data was released , including GDP , Unemployment Claims , and the GDP Price Index . These data points had a direct impact on the U.S. dollar, resulting in volatility in the EURUSD pair . The weaker-than-expected GDP and lower inflation caused a temporary weakening of the USD, but the strong labor market data still supports the dollar, potentially limiting further downside for EURUSD.
This was an analysis of the US economic data that was released today.
------------------------------------
EURUSD ( FX:EURUSD ) entered the Resistance zone($1.054-$1.044) again, and it seems that this move is a Pullback to the ascending channel (broken) .
According to Elliott's wave theory , pullback appears to be a Zigzag corrective wave(ABC/5-3-5) .
I expect EURUSD to attack the Support zone($1.039-$1.033) again, 100_SMA(4-hour) , and decline to at least the width of the broken ascending channel .
Was the bullish candle the previous hour in the role of a pullback or the start of another upward trend for EURUSD?
Note: If EURUSD goes over $1.049, we can expect more pumps.
Please respect each other's ideas and express them politely if you agree or disagree.
Euro/U.S.Dollar Analyze (EURUSD), 1-hour time frame.
Be sure to follow the updated ideas.
Do not forget to put Stop loss for your positions (For every position you want to open).
Please follow your strategy and updates; this is just my Idea, and I will gladly see your ideas in this post.
Please do not forget the ✅' like '✅ button 🙏😊 & Share it with your friends; thanks, and Trade safe.

THE KOG REPORT - FOMCTHE KOG REPORT – FOMC
This is our view for FOMC, please do your own research and analysis to make an informed decision on the markets. It is not recommended you try to trade the event if you have less than 6 months trading experience and have a trusted risk strategy in place. The markets are extremely volatile, and these events can cause aggressive swings in price.
Ok team, a simple one for this FOMC as we're expecting a bit of a curveball which is going to make it difficult to hold trades. For that reason, we have plotted the extreme key levels on the charts, anything intra-day and immediate support and resistance has been removed as it’s simply irrelevant if we see aggressive volume.
We have the level below which is also the order region 2730-40, a spike there with rejection can give this the momentum it needs to break upside and attack that 2800 level which is ideally what we want to see if they’re going to attempt it. We’ll be waiting higher however for them to complete the move and confirm a reversal, only then will we want to attempt the short trade back down using the red boxes.
Below the order region is the key level 2710-03, a push down there with a confirmed rejection and reversal, we’ll decide on whether to long or not back up using the red boxes level to level. We’ve done well on the KOG Report, we’ve shorted, we’ve longed and we’ve closed nicely on the bias level targets this week. We’re suggesting our traders take it easy, instil some patience and discipline, wait for them to take the price to where they want, then hunt the trade.
RED BOXES:
Break above 2762 for 2775, 2782, 2790 and 2810 in extension of the move
Break below 2740 for 2730, 2720, 2710 and 2698 in extension of the move
Please do support us by hitting the like button, leaving a comment, and giving us a follow. We’ve been doing this for a long time now providing traders with in-depth free analysis on Gold, so your likes and comments are very much appreciated.
As always, trade safe.
KOG

DOA Trading Strategy - USDSGD#USDSGD - Red DOA sniper and meter are holding strong on 4hrs
We’ve created a double top as well
We should see a nice drop on this soon

EURUSD Near Ascending Channel’s Peak: Will It Reverse?EURUSD ( FX:EURUSD ) rose to the Resistance zone($1.054-$1.044), as I expected in the previous idea .
EURUSD is moving in the Resistance zone($1.054-$1.044) and near the upper line of the Ascending Channel ( the role of resistance ).
According to the theory of Elliott waves , it seems that EURUSD has completed 5 impulsive waves , and we should wait for corrective waves .
Also, we can see the Regular Divergence(RD-) between Consecutive Peaks.
I expect EURUSD to fall at least to the Targets I have marked on the chart .
What do you think? Will EURUSD break the Resistance zone($1.054-$1.044) or back to test the Support zone($1.039-$1.033)?
Note: If EURUSD breaks the Resistance zone($1.054-$1.044), we can expect more pumps.
Please respect each other's ideas and express them politely if you agree or disagree.
Euro/U.S.Dollar Analyze (EURUSD), 2-hour time frame.
Be sure to follow the updated ideas.
Do not forget to put Stop loss for your positions (For every position you want to open).
Please follow your strategy and updates; this is just my Idea, and I will gladly see your ideas in this post.
Please do not forget the ✅' like'✅ button 🙏😊 & Share it with your friends; thanks, and Trade safe.

GBP/CHF Breakout Riding the Bullish Wave of the Cup and HandleThe chart for GBP/CHF on the 2-hour timeframe highlights a classic cup-and-handle pattern, a well-recognized bullish continuation setup. The rounded bottom of the cup indicates a period of accumulation, while the subsequent handle reflects a minor retracement and consolidation phase. This pattern suggests a strong potential for upward momentum as buyers regain control and push prices higher.
Key support and resistance levels are clearly defined. The rounded bottom has established firm support at 1.1130, while the handle retracement respected the 1.1198 level, reinforcing it as a critical short-term support zone. The neckline of the cup pattern, now serving as a breakout point, is around 1.1204. If bullish momentum continues, the price is likely to test resistance levels at 1.1270 and further extend towards 1.1350.
The chart also shows dynamic support and resistance through moving averages or bands, with the recent transition to green indicating strengthening bullish momentum. These indicators are acting as a trailing support zone, adding further confidence to the long position.
The long position was initiated at the breakout above the handle consolidation, confirming bullish intent as the price reclaimed the neckline at 1.1204. The stop loss is strategically placed below the handle retracement at approximately 1.1190 to protect against a false breakout or reversal. The initial target is set at 1.1270, aligned with Fibonacci extensions and resistance zones, while an extended target lies near 1.1350, suggesting significant upside potential.
Cup-and-handle breakouts typically align with increasing volume during the breakout phase, confirming the strength of the move. Traders are advised to monitor price action closely near key resistance levels to gauge the sustainability of this bullish trend.
The setup presents a disciplined and well-calculated bullish breakout strategy. The technical indicators, pattern formation, and risk management align to support a strong upward move, provided market conditions remain favorable. This chart reflects a clear opportunity for traders aiming to capitalize on the continuation of bullish momentum.

EURUSD Roadmap==>>Short-term!!!EURUSD ( FX:EURUSD ) is moving near the Support zone($1.039-$1.033) and inside the Ascending Channel .
According to the theory of Elliott waves , it seems that EURUSD has succeeded in completing the main wave 3 above the ascending channel and is currently completing the main wave 4 .
I expect EURUSD to attack the Resistance zone($1.052-$1.044) again soon, and the main wave 5 could end in this zone.
What do you think? Will EURUSD break the support zone or bounce back to test the resistance zone?
Note: If EURUSD can break the Support zone($1.039-$1.033), the lower line of the ascending channel, and 100_SMA(4-hour) , we should expect a further decline of this pair.
Note: Donald Trump's speech and the announcement of the Unemployment Claims index can affect the EURUSD trend(Tomorrow).
Please respect each other's ideas and express them politely if you agree or disagree.
Euro/U.S.Dollar Analyze (EURUSD), 1-hour time frame.
Be sure to follow the updated ideas.
Do not forget to put Stop loss for your positions (For every position you want to open).
Please follow your strategy and updates; this is just my Idea, and I will gladly see your ideas in this post.
Please do not forget the ✅' like '✅ button 🙏😊 & Share it with your friends; thanks, and Trade safe.

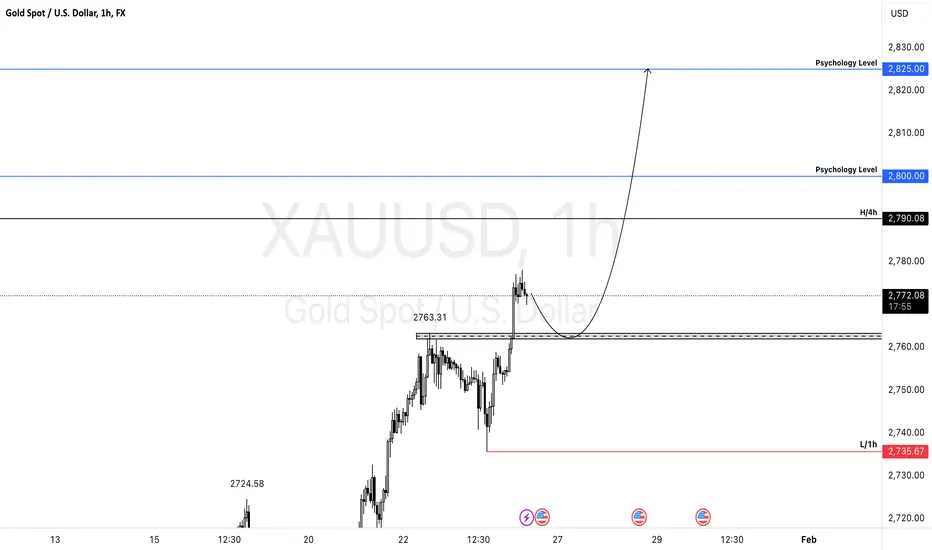
XAUUSD - ANALYSIS👀 Observation:
Hello, everyone! I hope you're all doing great. Let me share my personal view on XAUUSD (Gold) with you.
Based on what I see on the chart, I expect gold to make a small pullback to the 2760–2763 zone. From there, it might push higher, aiming for new all-time highs. However, if 2735.67 is broken, I anticipate a further decline.
📈 Expectation:
Bullish Scenario: A pullback to 2760–2763 followed by a rally targeting:
1️⃣ 2,800 (Psychological Level)
2️⃣ 2,825 (Psychological Level)
3️⃣ 2,850 (Psychological Level)
Bearish Scenario: A break below 2735.67 may lead to further downside movement.
💡 Key Levels to Watch:
Resistance Levels: 2800 / 2825 / 2850
Support Level: 2735.67
💬 What’s your perspective on XAU/USD ? Share your analysis in the comments!
Trade safe
Eurusd analysis move down read the caption This chart represents an analysis of the EUR/USD currency pair on the 1-hour timeframe. Below is a detailed breakdown of the key elements in the analysis:
1. CHoCH (Change of Character):
Multiple "CHoCH" labels are marked to signify reversals or shifts in market structure. These highlight areas where the price changes from a bullish to bearish trend (or vice versa).
2. BOS (Break of Structure):
BOS is labeled, showing significant points where price breaks through key structural levels, confirming continuation or reversal trends.
3. EQH (Equal Highs):
Equal highs indicate potential liquidity zones where stop-loss orders may be positioned. These zones are likely to be targeted by the market.
4. Weak Highs and Trendline:
A weak high is identified within the red zone, suggesting a lack of strength to continue upward. This creates a bias for potential downward movement.
The yellow and blue trendlines illustrate a descending wedge pattern, highlighting bearish pressure.
5. Target Zone (1.03411):
A blue box around 1.03411 represents the target price area for potential bearish moves, aligning with the downward arrow projections.
6. Bearish Plan:
The analysis expects a downward trajectory after a liquidity grab (red arrows) and weak highs. The market is forecasted to form lower highs and lower lows, eventually reaching the target zone.
This is a structural and liquidity-based analysis indicating bearish expectations while leveraging trendlines, BOS, CHoCH, and liquidity zones.

CADJPY Downtrend Analysis: Bearish Momentum ContinuesThe CADJPY remains in a strong downtrend after completing its first wave structure to the downside. The corrective wave offered no signs of a trend reversal, confirming the sellers’ dominance.
Yesterday, during the Tokyo session, a new bearish wave structure began, breaking below the first wave's momentum low. Wave 2 formed as a correction to Wave 1, creating an opportunity to look for short trades below 108.614. A break below 107.65 (momentum low) is expected, with a Fibonacci target of 61.8% as a likely end for the current wave.
Key levels to watch:
Entry: Below 108.614
Target: 107.65 and Fibonacci 61.8% level
Stop Loss: Above 109.05
Selling above 109.05 is not recommended.
Like, comment, and share your thoughts. Happy trading!

Gold will be fly make new record 2810This chart displays an analysis of the Gold Spot/U.S. Dollar (XAU/USD) on a 1-hour timeframe. Key components of the analysis include:
1. Current Price Levels:
Buy price: 2,761.12
2. Bullish Channel:
Gold is trending within an upward sloping channel, indicating a bullish trend in the short term.
3. Target Levels:
A significant target is identified at 2,810, marked as a potential new high.
4. Price Action Projection:
The blue arrow suggests that the price is expected to rise toward the target level of 2,810. After reaching this, a possible correction or retracement might occur before another upward move.
5. Stop Loss:
A stop-loss level is set at 2,740, which is below the current trendline to minimize potential losses in case the trend reverses.
6. Resistance and Support Zones:
Key resistance levels are near 2,810, while the lower boundary of the channel and 2,740 serve as support.
This analysis anticipates a continued bullish move but incorporates risk management strategies in case of market reversals.
Kha

Market Analysis: USD/JPY Corrects GainsMarket Analysis: USD/JPY Corrects Gains
USD/JPY is correcting gains and now consolidates below 156.00.
Important Takeaways for USD/JPY Analysis Today
- USD/JPY is trading in a bearish zone below the 157.00 and 156.60 levels.
- There is a connecting bearish trend line forming with resistance near 155.90 on the hourly chart at FXOpen.
USD/JPY Technical Analysis
On the hourly chart of USD/JPY at FXOpen, the pair started a steady decline from well above the 158.00 zone. The US Dollar gained bearish momentum below the 157.00 support against the Japanese Yen.
The pair even settled below the 156.60 level and the 50-hour simple moving average. There was a spike below 155.00 and the pair traded as low as 154.77. It is now correcting losses and trading above the 50-hour simple moving average and the 50% Fib retracement level of the recent decline from the 156.58 swing high to the 154.77 low.
Immediate resistance on the USD/JPY chart is near a connecting bearish trend line at 155.90. It is near the 61.8% Fib retracement level of the recent decline from the 156.58 swing high to the 154.77 low.
The first major resistance is near the 156.60 zone. If there is a close above the 156.60 level and the hourly RSI moves above 60, the pair could rise toward 157.00. The next major resistance is near 157.70, above which the pair could test 158.50 in the coming days.
On the downside, the first major support is near 155.35. The next major support is near the 154.80 level. If there is a close below 154.80, the pair could decline steadily. In the stated case, the pair might drop toward the 154.00 support.
Trade on TradingView with FXOpen. Consider opening an account and access over 700 markets with tight spreads from 0.0 pips and low commissions from $1.50 per lot.
This article represents the opinion of the Companies operating under the FXOpen brand only. It is not to be construed as an offer, solicitation, or recommendation with respect to products and services provided by the Companies operating under the FXOpen brand, nor is it to be considered financial advice.
