Trend Changing Pattern (TCP) ExplainedIntroduction
One of the most important skills in forex trading is learning how to read price action and understand what the market is telling you. Price is not just numbers — it’s the collective perception of traders, making it the most reliable leading indicator available.
Today, I want to explain a powerful concept known as the Trend Changing Pattern (TCP) — a crucial tool for identifying potential market reversals and shifts in trend direction.
📈 What Is a Trend Changing Pattern?
In any trending market, whether it's an uptrend or downtrend, the trend won’t change easily. The strength of the trend and the timeframe you're trading on will determine how long it takes for a true reversal to occur.
One key signal of a trend change is a shift in momentum:
In an uptrend, when a momentum low forms during a pullback, it can be a sign that the trend is beginning to reverse.
In a downtrend, a momentum high during a pullback can signal a potential bullish reversal.
These are what we refer to as Trend Changing Patterns (TCPs) — moments where the structure of the market starts to shift.
⚠️ Watch for Manipulation After the TCP
After a TCP appears, it's common to see price manipulation before the new trend fully takes hold:
In an uptrend, price may return to manipulate the previous high before continuing down.
In a downtrend, price often dips to manipulate the previous low before reversing higher.
Being aware of this common liquidity grab helps traders avoid being trapped and instead position themselves in alignment with the new trend.
🧠 Final Thoughts
Understanding how to spot and interpret a Trend Changing Pattern gives you a major edge in forex trading. It helps you stay ahead of the market and make informed decisions based on price action, not emotion.
🎥 In the video, I go into more detail about momentum highs and lows, and how to recognize these key patterns in real time. Be sure to check it out if you want to sharpen your trend reversal strategy.
Wishing you success on your trading journey! 🚀
Forexeducation

THE KOG REPORT THE KOG REPORT:
In last week’s KOG Report we said we would anticipate a potential curveball and that being that price may just support on the open at the immediate support level and give the move upside into the 3010 and above that 3020 region which was achieved. We then updated traders with the FOMC report suggesting a further move upside into the 3050-55 region which is where we suggested the potential short will come from.
After the push up into the level and then some accumulation, Friday gave us the volume we needed to break away from the range and complete the move downside to end the week.
Again, nearly all of our bias level targets were completed, the bias level worked well, Excalibur performed well and the red box indi’s worked a dream, even in the choppy market conditions.
So, what can we expect in the week ahead?
We have an issue with gold at the moment, although it’s broken the immediate range, it’s still above 3000 with a larger range low around the 2990 and below that 2970-75 region. That potential swing point below is an area of interest for us this week and leading up towards the end of the month. For that reason, if we can support at the first red box below, and continue the move that started on Friday up into those 3025, 3030 and above that 3035-7 price points we’ll want to monitor this careful for a reversal to form. If we can get it, an opportunity to add or take the short may be available to traders, this time in attempt to break below the 3000 level into those lower support level mentioned and shown on the chart, which also correspond with the red boxes. As many of you have seen over the last year or so, we’ve been sharing these indicator boxes on the 4H for the wider community for free, as they are extremely powerful in identifying turning points and entry and exit points for traders. So let’s keep an eye on them this week for the break and closes, RIP’s and rejections.
We’re mostly looking for this one move to complete, however, there has to be a flip! This week, the flip is breaking above that 3035-37 level which will also be this week’s bias level. If we do breach, we’ll be looking at this to then continue higher, breaking 3050 and then resuming the move into the active Excalibur targets above which ideally, we don't want to see happen yet!
So, we know we want higher, what we do want though is better entry levels for the longs, until then, if we can capture these short trades we’ll of course gratefully take them.
KOG’s bias for the week:
Bearish below 3040 with targets below 3010, 3006, 2997, 2985 and below that 2978
Bullish on break of 3040 with targets above 3050, 3055, 3063 and above that 3067
RED BOXES:
Break above 3037 for 3040, 3047, 3050, 3055, 3063 and 3066 in extension of the move
Break below 3010 for 3006, 3000, 2997, 2990 and 2985 in extension of the move
This should give you an idea of your levels, please use them!
Please do support us by hitting the like button, leaving a comment, and giving us a follow. We’ve been doing this for a long time now providing traders with in-depth free analysis on Gold, so your likes and comments are very much appreciated.
As always, trade safe.
KOG

Trading Miscalibration: Crypto Aims Too High, FX Aims Too LowI was thinking about something fascinating—the way traders approach different markets and, in my opinion...
One of the biggest mistakes traders make is failing to calibrate their expectations based on the market they’re trading.
📌 In crypto, traders dream of 100x gains, refusing to take profits on a 30-50% move because they believe their coin is going to the moon.
📌 In Forex and gold, the same traders shrink their expectations, chasing 20-30 pip moves instead of riding 200-500 pip trends.
Ironically, both approaches lead to frustration:
🔴 Crypto traders regret not taking profits when the market crashes.
🔴 FX and gold traders regret not holding longer when the market runs without them.
If you want to be a profitable trader, you must align your strategy with the reality of the market you’re trading.
________________________________________
Crypto: Stop Aiming for the Moon—Trade Realistic Outcomes
Crypto markets are highly volatile, and while 10x or 100x gains can happen, they are rare and unpredictable. However, many traders have been conditioned to expect extreme returns, leading them to ignore solid 30-50% gains—which are already fantastic trades in any market.
🔴 The Problem: Holding Too Long & Missing Profits
Many traders refuse to take profits on a 30-50% move, convinced that a 10x ride is around the corner. But when the market reverses, those unrealized gains disappear—sometimes turning into losses.
🚨 Frustration:
"I was up 50%, but I got greedy, and now I’m back to break-even—or worse!"
✅ The Fix: Take Profits at 30-50% Instead of Waiting for 10x
✔️ Take partial profits at key resistance levels.
✔️ Use a trailing stop to lock in gains while allowing for further upside.
✔️ Understand that even professional traders take profits when they’re available—they don’t blindly hold for the next 100x.
📉 Example:
If Bitcoin jumps 30% in a month, that’s already a massive move! Instead of waiting for 200%, a disciplined trader locks in profits along the way. Similarly, if an altcoin is up 50% in two weeks, securing profits makes sense—instead of watching it all disappear in a market dump.
________________________________________
FX and Gold: Stop Thinking Small—Aim for Big Market Trends
On the other hand, when it comes to Forex and gold, many traders shrink their expectations too much. Instead of capturing multi-hundred-pip moves, they settle for 20-30 pip scalps, constantly entering and exiting the market, exposing themselves to unnecessary whipsaws.
🔴 The Problem: Exiting Too Early & Missing Big Trends
Unlike crypto, where traders hold too long, in FX and gold, they don’t hold long enough. Instead of riding a 200-500 pip move, they panic-exit for a small profit, only to watch the market continue without them.
🚨 Frustration:
"I closed at 30 pips, but the market kept running for 300 pips! I left so much money on the table!"
✅ The Fix: Target 200-500 Pip Moves Instead of Scalping
✔️ Focus on higher timeframes (4H, daily) for clearer trends.
✔️ Set realistic yet ambitious targets —200-300 pips in Forex, 300-500 pips in gold.
✔️ Use a strong risk-reward ratio (1:2, 1:3, even 1:5) instead of taking premature profits.
📉 Example:
• If EUR/USD starts a strong downtrend, why settle for 30 pips when the pair could drop 250 pips in a week?
• If gold breaks a major resistance level, a move of 300-500 pips is entirely possible—but you won’t catch it if you exit at 50 pips.
________________________________________
Why Traders Fail to Calibrate Properly
So why do traders fall into this misalignment of expectations?
1️⃣ Social Media & Hype Culture – Crypto traders are bombarded with "to the moon" narratives, making them feel like 30-50% gains are not enough. Meanwhile, in Forex, traders get stuck in a scalping mindset, thinking that small, frequent wins are the only way to trade.
2️⃣ Fear of Missing Out (FOMO) vs. Fear of Losing Profits (FOLP)
• In crypto, FOMO keeps traders holding too long. They don’t want to miss "the big one," so they refuse to take profits.
• In FX and gold, fear of losing small profits makes traders exit too soon. They don’t let trades develop because they fear a pullback.
3️⃣ Misunderstanding Market Structure – Each market moves differently. Crypto is highly volatile but doesn’t always go 10x. Forex and gold move slower but offer consistent multi-hundred-pip trends. Many traders don’t adjust their strategies accordingly.
________________________________________
The Solution: Align Your Strategy with the Market
🔥 In crypto, don’t wait for 10x— start taking profits at 30-50%.
🔥 In FX and gold, don’t settle for 30 pips—hold for 200-500 pip moves.
By making this simple mental shift, you’ll:
✅ Trade smarter, not harder
✅ Increase profitability by targeting realistic moves
✅ Reduce stress and overtrading
________________________________________
Final Thoughts: No More Frustration!
The calibration problem leads to frustration in both cases:
⚠️ Crypto traders regret not taking profits when the market crashes.
⚠️ FX and gold traders regret not holding longer when the market trends.
💡 The solution? Trade according to the market's behavior, not emotions.

THE KOG REPORT - NFPTHE KOG REPORT – NFP
This is our view for NFP, please do your own research and analysis to make an informed decision on the markets. It is not recommended you try to trade the event if you have less than 6 months trading experience and have a trusted risk strategy in place. The markets are extremely volatile, and these events can cause aggressive swings in price.
Firstly, we would suggest traders stay away from this NFP altogether, the markets are very delicate and moving to extreme levels not only on Gold but most forex pairs. For that reason we’ll keep it simple and look at the key levels together with the structure formed.
We have the higher resistance level here which is the previous order region 2930-35 which looks to be a potential region price may want to attack if they want to continue this move upside, above that is the extension of the move around 2945-55. Price needs to stay below this level, If we can reject and not break above these levels, an opportunity to see the market correct may be available back down in attempt to break 2900 level.
On the flip, if they push price downside, we’ll wait, the range needs to be broken, price should want to retest the flip and then continue the move, that’s when we can start using the red boxes to target those lower levels and potentially look for the swing low from the circled hotspot.
As above, keep it simple, the trade comes after the event and most accounts are blown during these events due to traders using large lots on small accounts attempting to capture the volume driven candles. Unless you’re already in and protected, the swing in the opposite direction can cause huge problems to less experienced traders.
RED BOXES:
Break above 2930 for 2934, 2940, 2944 and 2955 in extension of the move
Break below 2910 for 2903, 2895, 2890 and 2879 in extension of the move
Please do support us by hitting the like button, leaving a comment, and giving us a follow. We’ve been doing this for a long time now providing traders with in-depth free analysis on Gold, so your likes and comments are very much appreciated.
As always, trade safe.
KOG
GBPUSD GBPUSD Trade at mid of 2 zones when market give displacement towards downside we will see fvg and enter on that if market go upside and close any H4 candle above these zone then we see pump towards upside market will go upside,
Remember!Trade What You See Not What You Think.

THE KOG REPORT THE KOG REPORT
In last week’s KOG Report we said we would be looking for the deeper pull back from the open and then hunt the long trades into the levels we published as our bias and red box targets. We managed to get the short early part of the week into the level we wanted 2730-35 giving us the long trade and a phenomenal pip capture.
We then published the FOMC KOG REPORT and stated a similar scenario, only this time expecting price to give us an undercut low before then resuming the move into all time highs. Price didn’t capture the liquidity from below enabling traders to keep positions from below and then carry trades up completing every target level down and up for the week!
A fantastic week in Camelot and for those who followed, not only on Gold but all the other pairs we trade and analyse, completing 28 targets during and high volatility and demanding week. Well done to the team!
So, what can we expect in the week ahead?
We’re looking for two potential moves this week to start with. Ideally, we want to see the market open, test that high around the 2810-7 region and see a rejection there. If we can get that RIP there we feel the move downside can commence firstly into the 2775 region and below that 2755-60. That’s the level for us to watch for a potential long trade back up but we’ll treat it level to level unless the 2890-95 region is broken.
Our target level of 2828 is still active, however, we would again like to see a deeper pull back before attempting that long trade as we’re too high and It’s too dangerous up here.
On the flip, if we break above that 2810 level and can hold above it, we’ll be looking to complete our target level and based on a clean set up, a potential swing short for the bigger capture may come from up there.
Crucial level here is 2790 which has been circled on the chart, it’s likely they will use this level as a key level for this week.
KOG’s Bias for the week:
Bearish below 2810 with targets below 2795, 2775 and below that 2755.
Bullish on break of 2810 with targets above 2820, 2824, 2828 and above that 2835
RED BOXES:
Break of 2810 for 2815, 2818, 2828, 2830 and 2834 in extension of the move
Break of 2790 for 2785, 2877, 2765 and 2755 in extension of the move
Please do support us by hitting the like button, leaving a comment, and giving us a follow. We’ve been doing this for a long time now providing traders with in-depth free analysis on Gold, so your likes and comments are very much appreciated.
As always, trade safe.
KOG

SL HIT ON NASDAQAs I post my winning trades, I'm going to post my losing one, so people, especially beginners know that trading isn't always wins and wins, and no strategy always brings back profits for you.
Every strategy has downsides and upsides, this is the first thing I teach to my students who fully understands it.
In case you wondered how I trade, I'm a reversal based trader. hich means I trade reversals, ans as every strategy it works 80% of the time and having a losing day of the week, but the unforgivable thing is to let your emotions take over your trading and lose all the profits you made.
The first thing I teach is don't let your emotions take over your trading, and don't make more than 2 losing trades a day. STICK TO THE PLAN.
Follow for more!

THE KOG REPORTTHE KOG REPORT
In last week’s KOG Report we said for the first half of the week we will be looking for the price to attempt the low-level support 2625-30 to complete the move from the week before which we achieved. We wanted this level to give us the bounce upside for the long, which was almost to the pip, hitting our target upside for another short completing the bearish targets.
We then updated traders with the long trade before NFP which we traded level to level until we released the NFP KOG Report on Friday. For this report we gave the levels of interest and our plan, and although we didn’t manage to capture the exact level for the long, some traders managed to get in on the move hitting the target on the nose. It’s at that red box level we then shorted again to close the week.
What a week in Camelot, not only a point to point moves across the week on Gold but we completed a whopping 22 targets across the other pairs we trade and analyse.
Well done to the community and traders.
So, what can we expect in the week ahead?
For this week we have the key levels above 2700 and above that 2710, which could be possible targets for bulls to attempt during the course of the week. Below, we have the key levels of 2665 and the key level 2650-55 which will be this week’s bullish above bias level. Ideally, on open we want to see a brief test of that high, if rejected we would like to see this come back down to complete the move downside from Fridays’ NFP. It’s these lower levels that need to be monitored, the 2665 region which is where if we want to go up, we don’t want to see a break below and below that, then the extension of the move into the 2645-50 region.
We’re a little too high to attempt the long and we’re also holding protected shorts from above, so a progressive move down would suit before then finding a base to attempt that long unless Excalibur says otherwise.
At present, we can not get to carried away with the long-term direction, a visit into 2700 with a strong break above 2720 is needed for this to continue the move upside, while a break below the 2640-45 region is needed for this to confirm the move further downside. It’s still possible we continue this range until a further breakout so for that reason we’ll play it intra-day for now following our trusted algo and additional tools we have in place.
KOG’s Bias for the week:
Bullish above 2650 with targets above 2700, 2706 and above that 2716
Bearish on break of 2650 with targets below 2640 and below that 2635
RED BOXES:
Break above 2690 for 2700, 2703, 2706, 2710 and 2724 in extension of the move
Break below 2680 for 2667, 2665, 2655 and 2640 in extension of the move
Please do support us by hitting the like button, leaving a comment, and giving us a follow. We’ve been doing this for a long time now providing traders with in-depth free analysis on Gold, so your likes and comments are very much appreciated.
As always, trade safe.
KOG

THE KOG REPORT - ELECTION SPECIAL COMPLETEDKOG first published this chart at the beginning of November prior to the US Election with our view of the movement expected and the trade plan for the month.
We highlighted the path with the Red arrows and added the green arrows with the actual movement. As you can see, we weren't too far off with the projection using it to then trade the levels intra-day and for the swings successfully. It's worked well and combined with our tools, indicators, algo and target activations we can honestly say it's been another great year in Camelot.
We will end this idea here and mark it as completed at the green arrow point above.
Please do support us by hitting the like button, leaving a comment, and giving us a follow. We’ve been doing this for a long time now providing traders with in-depth free analysis on Gold, so your likes and comments are very much appreciated.
As always, trade safe.
KOG

The Importance of Measuring Trading Performance with "R"In today’s fast-paced trading environment, having an effective and clear method to track performance is essential for success. This article is tailored for short-term traders who typically manage 1–3 positions at a time and are looking for practical strategies to evaluate their trading outcomes. Unlike diversified stock portfolios or hedge funds that deal with long-term asset management, this guide focuses on the everyday realities of prop and retail traders.
Not everyone will agree with the concepts I discuss in this article, but this is how I track trading performance and how many other successful retail and prop traders track theirs. This is what I do, and it’s what I suggest. Let’s explore why tracking performance in terms of dollars risked versus dollars gained—using a metric called “R”—is a superior method compared to traditional measures like percentages or pips.
Why Percentages and Pips Fall Short
Most trading blogs and forums emphasize percentage or pip returns, but these metrics don’t tell the full story. Every trader operates under unique circumstances, influenced by their account size, risk tolerance, and trading style. A trader managing $1,000 doesn’t face the same challenges as one handling $100,000. For this reason, dollar-based performance tracking, specifically through “R,” provides a more accurate and relevant measure of trading effectiveness.
What is “R” and Why Does It Matter?
“R” is a measure of your risk-to-reward ratio across all trades. It reflects how much you make relative to how much you risk. For example:
If you gain $100,000 in a year and lose $50,000, your R-value is 2R ($100,000 ÷ $50,000).
A 2R track record means you’re making $2 for every $1 you lose, while a 3R track record means $3 for every $1 lost.
A solid R-value is a strong indicator of trading proficiency. It provides a quick, meaningful snapshot of performance, and investors or prop firms evaluating your track record will prioritize this metric. A high R-value demonstrates effective risk management and profitability.
Percent Risk vs. Fixed Dollar Risk
Risking a percentage of your account, such as 2% per trade, is a popular strategy but isn’t ideal for short-term traders. While it works well for diversified portfolios or hedge funds managing multiple assets, short-term traders focusing on a few positions should prioritize fixed-dollar risk. Here’s why:
Relevance: A 100% gain on a $300 account isn’t as significant as a 50% gain on a $10,000 account. Dollar gains give a clearer picture of actual performance.
Leverage: Forex trading allows traders to control large positions with smaller deposits. A trader with $1,000 and one with $10,000 can both manage similar position sizes due to leverage, making percentage returns less relevant.
The “Pillow Test”: Your ability to sleep at night often determines how much risk you’re truly comfortable with. For instance:
With a $1,000 account, risking 2%—$20—might feel inconsequential, comparable to the price of two beers and a pizza in some countries. This could lead a trader to feel comfortable risking 5% or even 10%.
However, with a $100,000 account, risking 10%—$10,000—might be enough to keep you awake at night. For most traders, myself included, this level of risk is intolerable.
This example highlights the limitations of percentage-based models. They fail to account for individual perceptions of money and risk. Dollar-based risk management and the R-value system, by contrast, adapt to the trader's mindset and circumstances.
Why Account Balances Can Be Misleading
Account balances don’t necessarily reflect a trader’s true trading capital. Many professional traders keep a minimal amount in their trading accounts and maintain the rest in safer, in a bank account or even in long term investments.
For example, a trader might control a 100k position with just $5000 in their trading account, but this does not mean that 5k is all their capital.
This strategy minimizes risk while leveraging the power of Forex trading.
Avoiding the Pitfall of Tying Up Capital
There’s no need to keep all your trading capital in one account. Thanks to leverage, traders can manage large positions with smaller deposits. Successful traders often withdraw profits monthly, maintaining a predetermined account balance and reallocating funds to other investments or savings. This approach underscores the irrelevance of account size in tracking performance. What truly matters is your dollar risk per trade and your overall R-value.
The Personal Nature of Risk Tolerance
Every trader has a unique risk tolerance shaped by their experience, confidence, and financial situation. A seasoned trader comfortable with their edge might take larger risks than a beginner. This variability further emphasizes the importance of measuring performance through R-values. Instead of comparing percentages or pips, traders can focus on their individual risk-reward balance and optimize their strategy accordingly.
Ultimately, risk tolerance is deeply personal. For some, losing a few hundred dollars on a small account feels negligible, but for others, the same few hundred, even if the account is considerably larger may become emotionally and psychologically taxing. This is why measuring returns in terms of dollars risked versus dollars gained is more practical and relevant.
Calculating Your R-Value: A Practical Example
Let’s break it down with a simple example:
Number of trades: 20
Fixed risk per trade: (amount varies by trader)
Winning trades: 9 (45%)
Losing trades: 11 (55%)
Gains: 33R
Losses: 11R
Overall R-value: 3R (33 ÷ 11)
This means that for every dollar risked, the trader earned $3 on average. Notably, the trader had more losing trades than winning ones but still achieved profitability due to effective risk-reward management.
Final Thoughts: The Power of “R”
Measuring trading performance in terms of R provides a comprehensive and meaningful view of your effectiveness as a trader. It transcends the limitations of percentages and pips, accounts for individual differences in risk tolerance, and aligns with the realities of leveraged trading. By adopting this approach, traders can better track their progress, refine their strategies, and present a compelling case to potential investors or prop firms.

Trading Tip: Always Wait for ConfirmationOne of the most common mistakes traders make is entering trades impulsively. Waiting for confirmation—such as a clear break of structure or a retest—can save you from unnecessary losses and improve your win rate significantly.

Your Real Chances of Succeeding as a Forex TraderYou’ve probably heard the claim that 95% of traders fail to make money in the markets. This statement is repeated endlessly across the internet, creating fear and doubt for many aspiring traders. However, this widely circulated myth is not backed by solid evidence or reliable statistics. In reality, it’s a generalized assumption based on flawed logic that discourages new traders from reaching their full potential.
Let’s unpack this myth and explore your real chances of succeeding as a Forex trader with a logical, evidence-based discussion. By the end of this, you’ll feel more confident and ready to approach trading with the right mindset.
Understanding Success in Forex Trading
A critical question for any trader is: What are the chances of making consistent profits in Forex without being a full-time professional?
It’s important to recognize that while some traders lose money, others consistently make profits. Consistency over the long term is what separates successful traders from the rest. However, being a “professional” trader is not a prerequisite for success.
The myth that “95% of traders fail” doesn’t mean 95% never make money. Many traders are profitable part-time, focusing on steady growth rather than aiming for professional status right away.
Focus on Realistic Goals
One of the biggest mistakes new traders make is trying to become professional traders too quickly. This approach often leads to overtrading, excessive risk-taking, and emotional decision-making. Instead, your initial goal should be to make consistent profits on a monthly basis.
Start by aiming for profitability each month. Once you achieve this, you can gradually raise your targets—weekly profitability, then scaling up your account and trading frequency. This progression not only builds your skills but also instills the discipline required for long-term success.
Why Realistic Expectations Improve Your Trading
Setting achievable goals gives you an emotional advantage. By not pressuring yourself to become a professional immediately, you reduce the likelihood of over-leveraging or overtrading. Without the emotional burden of relying on trading as your sole income source, you can focus on refining your strategies and improving your decision-making.
When you detach emotionally from your trades and manage risk effectively, you put yourself in a better position to succeed. In fact, statistics show that the percentage of traders who make consistent monthly profits is likely closer to 20-30%, far higher than the often-cited 5%.
The Power of Risk-Reward and Strategy
To succeed in Forex trading, you need to understand risk-reward ratios and develop a high-probability trading edge. Let’s break this down:
Risk-Reward Ratios
A 1:1 risk-reward ratio requires a 50% win rate to break even.
A 1:2 ratio only requires a 33% win rate to break even.
A 1:3 ratio allows you to break even with just a 25% win rate.
The higher your risk-reward ratio, the fewer trades you need to win to stay profitable. This highlights the importance of letting your winning trades outpace your losing ones.
High-Probability Trading Edge
A sound strategy, like price action trading, increases your chances of making profitable trades.
Random entries will likely result in break-even performance, but combining a solid strategy with effective risk-reward management shifts the odds in your favor.
Steps to Improve Your Odds of Success
To increase your chances of becoming a successful trader:
Master Risk Management: Understand how to manage your capital effectively to minimize losses.
Learn a Proven Strategy: Focus on mastering a high-probability trading strategy, such as price action.
Set Realistic Goals: Aim for consistent monthly profits rather than rushing to become a professional.
Trade Part-Time First: Start small and trade part-time. Over time, scale up as your skills and account balance grow.
Focus on Quality, Not Quantity: Trade less but aim for higher-quality setups.
Final Thoughts
Becoming a profitable trader is not unattainable. By setting realistic goals and avoiding the pressure to go full-time too quickly, you greatly increase your chances of success. Start by mastering a strategy like price action trading and combine it with disciplined money management.
Success in Forex trading comes from within—it’s about controlling emotions, managing risks, and having a solid plan. If you focus on trading part-time with consistency, you’ll be surprised at how quickly your trading can turn profitable.
Take it step by step, and remember: the journey to success in Forex trading is a marathon, not a sprint.

US30 sell opportunityAt US30 Empire, we believe the US30 (Dow Jones) is primed for a drop based on several key technical indicators. Here’s why:
1. Stochastic Oscillator in Overbought Territory: The stochastic oscillator, a momentum indicator, is signaling that US30 is in an overbought zone. This suggests that the index may have risen too far, too fast, and is due for a correction. Historically, when the stochastic hits these levels, we see a pullback in price.
2. Trend Lines Indicate Resistance: Our trend lines, drawn from key highs and lows, show that the US30 is approaching a major resistance level. This resistance aligns with the index being at its highest price ever. Typically, markets struggle to break through strong resistance without a significant retracement first.
3. Pivot Points Signaling Reversal: Based on pivot point analysis, the US30 is sitting at a major pivot level. This level often acts as a turning point in price movement, and combined with other indicators, it suggests the potential for a reversal.
4. Support and Resistance Levels: The US30 is currently testing long-standing resistance levels. As price fails to break through, this creates a barrier that historically leads to a downside correction. These resistance levels, matched with the overbought stochastic, signal that sellers may soon take control.
Overall, the combination of overbought stochastic levels, trend line resistance, pivot points, and price reaching historical highs makes a compelling case for the US30 to drop from here.

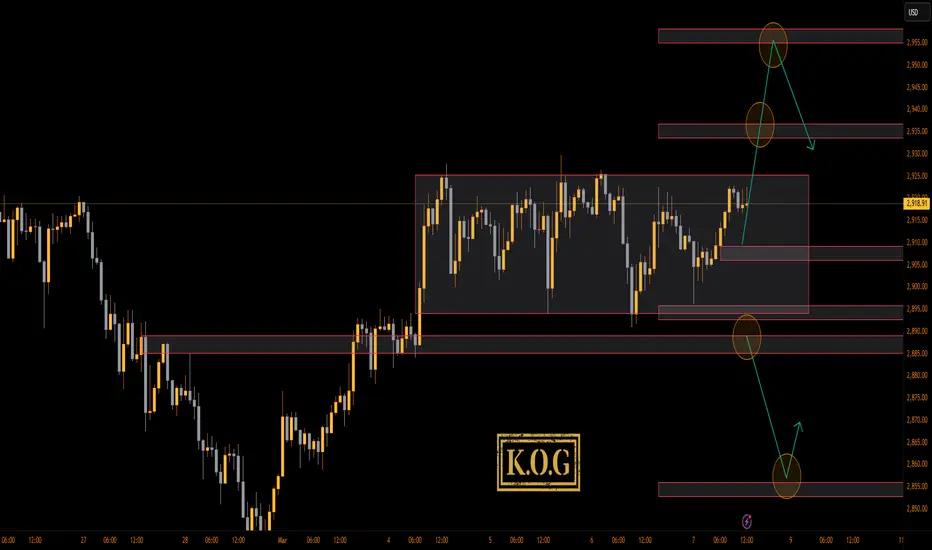
THE KOG REPORTTHE KOG REPORT:
In last week’s KOG Report we plotted the potential range and play pre-event (FOMC) giving the resistance level above which we said would present the opportunity to short if targeted and held. This gave traders a fantastic trade into that range low where we gave the targets 2565 and 2555, which were both achieved. We then update traders with the FOMC KOG Report and again gave the levels for the short if resistance was targeted, which worked well. We had identified the same order region which is where price tapped and bounced, giving traders that long we suggested to break above the 2600 level to complete KOGs weekly bias level targets.
Once that trade was taken, we decided to call it a week and wait for the close, giving us another fantastic week in Camelot, not only on Gold but also the other pairs we trade and apply the algo to.
So, what can we expect in the week ahead?
For this week we will say play caution on going long unless we get a pullback! Ideally, we want to see price attempt that 2630-35 region, with the extension of 2640, and if we see signs of a reversal there, we feel an opportunity to short the market is available, initially into the 2610 region and below that 2595 as shown with the red arrows on the chart. We need to monitor this move carefully as there are initial signs we may see a deep pull back next week, so please monitor the levels and watch the red boxes for the breaks!
On the flip, if we do start the week with a move downside, we will be looking at the 2610 level first for a RIP, and if achieved and defended we feel the long trade is available into that 2635 region where again we will look for signs of a reversal.
In summary, unless we break above the 2640 level we want price to give us better opportunities as the last thing we want to do is start taking losses, even small ones while price is still finding it’s feet up here. Hope that is clear for everyone!
KOG’s bias for the week:
Bullish above 2595 with targets above 2630, 2635 and extension level 2640
Bearish on break of 2595 with target below 2570
RED BOXES:
Look for red box breaks above 2626 to confirm move higher
Look for red box breaks below 2613 to confirm lower
As usual, please look out for the red boxes, KOG’s bias of the day and the updated analysis which is posted for the wider community.
Please do support us by hitting the like button, leaving a comment, and giving us a follow. We’ve been doing this for a long time now providing traders with in-depth free analysis on Gold, so your likes and comments are very much appreciated.
As always, trade safe.
KOG

Forex Portfolio Selection Using Currency Strength Index (CSI)Hello Traders,
Today, I’ll share my portfolio selection approach in forex trading. This method helps identify the best forex pairs to trade based on their relative strength.
The simplest and most effective strategy is to use the Currency Strength Index (CSI), combining the H4, Daily (D1), and Weekly (W1) cumulative strength. By analyzing this data, we can identify the strongest and weakest currencies at any given time.
Once we have this information, the next step is to pair the strongest currencies with the weakest. Here are today’s portfolio selections:
BUY Pairs: GBPUSD, GBPCAD, GBPNZD
SELL Pairs: USDJPY, CADJPY, NZDJPY, USDCHF, CADCHF, NZDCHF
The key benefits of this portfolio selection process are:
A focused view on the most profitable currency pairs
An objective approach to trading decisions
Clear direction on which way to trade (buy or sell)
Like, comment by letting me know what you think and follow me for more trading education.
Happy trading!

THE KOG REPORTTHE KOG REPORT
In last week’s KOG Report we said we would be looking for more downside movement on Gold and gave the weekly bias level of 2335 with targets below 2310 and below that 2395. We also informed traders to watch out for the extension of the move into that 2340 which is where we ideally wanted to short the market for the bigger capture. We suggested early longs into the levels above, and once there we confirmed the move not only did we get the long trades, we got the opportunity to take that short trade all the way back down to complete the bias level targets. It’s at this lower level we suggested taking the early long back up, again netting a fantastic return, following Excalibur all the way to where we closed the month.
During the week, we also update traders on the intra-day movement highlighting the levels to look for RIPs and opportunities to capture the counter movement, which also worked extremely well completing a fantastic week for the free analysis, but a phenomenal week on Gold targets in Camelot.
Well done to our community and team for another great month of completed targets.
So, what can we expect in the week ahead?
We’ll start by saying it’s the first week of a month and quarter, so best practice would be letting the market settle for the new month, especially the first few days. We also have a lot of news this week which is guaranteed to drive the markets to extreme levels aggressively, coupled with choppy price action. New traders really should be sitting out with the attitude that cash in your account is a position in the market, a very strategic one!
Although we ended the month with a bullish daily, we’re not seeing any confirmed movement to complete the upside levels as yet! So, we’ll begin the week with caution and look at the immediate levels of support sitting around the 2313 and above that 2317 levels. If we begin the week with an attack on those levels and face strong support, it’s here we may get an opportunity to long back up into that 2330 -35 region with the extension of the move again the 2345-50 price point, which for this week is our bearish below level. This level above if targeted is important, as breaking above here will take us back up to target that 2270-75 region, which believe it or not, is still in this range! It is however these higher levels we want to be monitoring closely for signs of rejection, and if we get them we feel there is an opportunity to short again from higher up into the lower levels as suggested on the chart. We have our active targets and the prices we’re looking for but would suggest level to level trading for this week at least, with tight stops!
We’re going to keep it simple this week and say that’s the main move we’re looking for unless we break below 2316-20 and hold, in which case the plan completes before we get any more opportunities to add to shorts from higher again.
KOG’s Bias for the week:
Bearish below 2345-50 with targets below 2310 and below that 2290
Bullish on break of 2345 with targets above 2360 and above that 2370
We’ve added the key levels on the charts for you this week with the text, “Bearish below, Bullish above etc” which we hope will help you stay in the right direction and manage your trades.
As usual, we will update you with our plans and wish you a successful week ahead.
Please do support us by hitting the like button, leaving a comment, and giving us a follow. We’ve been doing this for a long time now providing traders with in-depth free analysis on Gold, so your likes and comments are very much appreciated.
As always, trade safe.
KOG

KOG - Trading the Range!RANGE BOX:
When the price is in a ranging market look for date of when the price was last in its range. Example above shows we had the range, a breakout above and then a break back inside the range. Draw a box around the range and then identify the buy area and the sell area. This stops you from trading in the middle of the range and getting chopped up by the market. Always wait for the lower levels to buy and the higher levels to sell. If either level breaks wait for the support or resistance to turn into support or resistance. This give you an indication of potential further movement in the direction of the breakout.
Within the range you will find trends, smaller support and resistance levels and chart patterns. This will further help you to trade within that range of scalp in between levels. Identifying these levels and patterns also give you a view of potential future movement. Again, this helps towards making sure you don’t get caught trading in the middle and getting caught the wrong of the market.
Now we’ve updated the range to present day and it gives us a clearer picture of what the market has been trying to do since October 2021. We can the H&S back in November which as yet hasn’t been tested, with patterns like this they don’t always get a retest but on most occasion the price will come back to test it. This tells us that if we break above the range high again there is potential for the price to test that 1860 at some point.
We can also see that there is a double top recently which caused the price to break back inside the range. Again, on most occasions its likely the price will want to test the pattern or neckline at some point. This gives us an indication of potential movement in the direction of the double top and if we break the double top (we fail a triple top) then there is a chance we could go further up based on support below to test the shoulder of the H&S from Oct. We then add our every day analysis, support and resistance levels and smaller timeframes to further confirm movement and potential challenges on different price regions.
If we now look at the bottom of the chart we have one significant area of interest. That’s the buy area we have been using to take the long trades within the range. We can see its given us a triple bottom in this region where we have seen rejection in price. This area has worked well for Bulls but now we will need to be cautious if the price comes down to challenge this area again. Based on what we mentioned above with patterns its likely the price will want to come down to test this level again at some point. Keeping that in mind we also have to be cautious here as the level has been rejected 3 times forming the triple bottom. The is huge potential now for the next test on this level to break this level aggressively which could take us down towards the lower key support of 1730-20.
Hope this helps traders, its more an educational post rather than our analysis but please do back test it and see how it works for you. Any questions please do ask, we try our best to answer everyone.
See you tomorrow for the KOG report.
As always, trade safe.
KOG

GOLD 1H Trading buy and sell opportunityUse at your own risk. this is my trading plan.
every details I marked with chart properly and can understand everyone
enter with confirmation. will update you guys

GBPUSD Sell opportunity 1.2760 - 1.2766#GBPUSD Update..!
The pair already rejected with 4H support area successfully and retest still not confirmed. I didn't expect the pair would go up to retest high level before testing below the support area. Because Accending channel support is no longer valid.
GBPUSD Sell opportunity 1.2760 - 1.2766
GBPUSD Buy opportunity 1.2599 - 1.2695
*My trading plan. use at your own risk

JPY Index next week outlookThe Japanese currency continuesly doping down From march of 2020. Now in 4H timeframe already Rebound from 704.1 level. But still not tread breakout confirmation.
Within next week I expect all JPY pairs will fall down to retest the above support area. However still have FVG Between 718 - 120 levels.

NASDAQ Next week expectation #NAS100 Next week..!
The price reaches the highest level. And this should be retested. Because 13th of June reaches this price and falls down to 19,479 level.
But in a low time frame still running between the Accending channels. But the movement is bearish Because 2 times it is tested with treeline.
However once the market opens if the current 4H candle end below 19670 can go for sell to 19352 level. And the buy area located at 18753 - 18933 according to 4H timeframe
*My trading plan. Trade at your own risk good luck

GBPUSD Next week expectation #GBPUSD Next week..!
After ending Friday the pair broke the 4H support level 1.2712 - 1.2703 area. Currently running between the Decending Channel.
Next week the price will retest the above resistance area. Once the bear market is retested. Wait for selling the gbpusd as a swim trader. Scalpers can get selling in 1.27014 to 1.2657 level.
*My expectation not suggested.

Gold going down from 2323according to the analysis I expect
gold will ready to go 2268 - 2277 support zone
if broke 2338-2340 zone i expect price will retest 2360 level
waiting level break to entering buy or sell
trade at your own risk
