Forexeducation

USDCAD [Intraday] Possible demand, run for stops >1,3260 ?Overall dollar is trying to hold support, so here we are testing possible intraday demand, if holds we may see run for stops above 1,3260

DXY [Intraday] Is it last chance for bulls ?Weekly and Daily does not look good. Intraday: testing possible demand.
Weekly close below 97/96,80 ugly.
Market expectation related to December FOMC felt below 80%


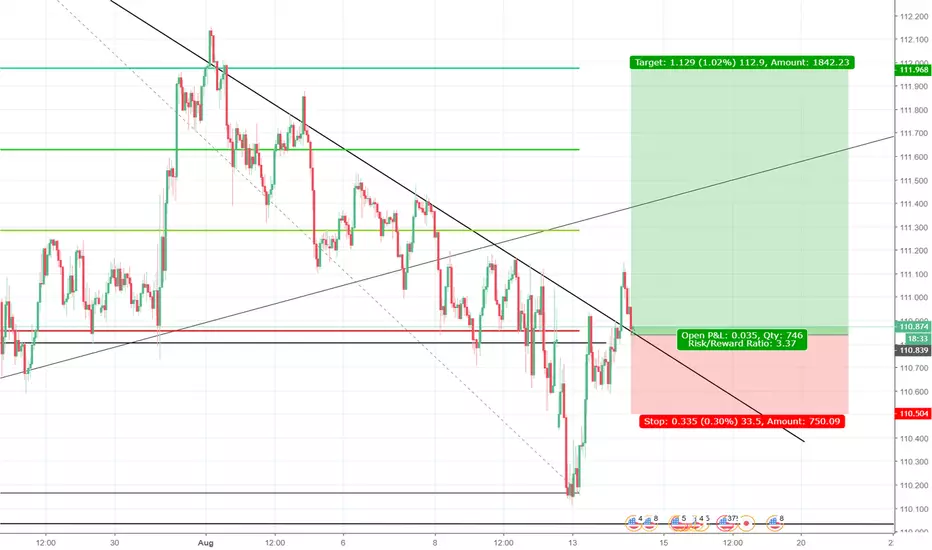
USD CAD Short Spot INCOMING Divergences Spotted and we are testing an important trendline support if the 1h candle close below the support the first target will be the blue rectangle.
First Target: 1.31850
Extension: 1.30900
Lets Go!


EURUSD [Intraday] Are we going to find support ?In relation to our view based on weekly chart here
Breakdown through 'ideal' double bottom and scenario 2 might be in play. Long weekend in US ( market is open but lower liquidity could be in place ) as a perfect envirnoment for quick manipulation ?
Intraday possible supply between 1305/20 and stops above Tokio high

Education post 13/100 – How to trade doji candlestick pattern?– A Doji is a small bodied Japanese candlestick pattern whose opening and closing are at the same or nearly the same price.
– A Doji is usually part of common Japanese candlestick reversal patterns like the bullish Morning Star and bearish Evening star patterns
– Because Dojis are found in a large number of reversal patterns, traders automatically think that the single doji is a reversal candlestick. But in fact, the doji by itself represents indecision in the marketplace.
– A Doji breakout setup provides an excellent risk to reward opportunity for forex traders.
The lowly doji is very unassuming in appearance. Typically, it looks like a plus sign but can appear as a capital “T” in the Dragonfly doji pattern or the shape of a nail in the Gravestone Doji. We are going to be discussing the first two types of dojis found in the “cheat sheet” above. These small candles can lead to large breakouts that either continue trends or reverses them. We are going to look at the way to trade these power packed price patterns with limited risk for maximum potential gain
Typical candlesticks consist of a body that may be one of two colors; blue or red. A candle is blue if buyers were able to push prices above the opening price and were able to hold it until the close of the candle. A candle is red or bearish is sellers were able to push prices below the opening price and hold it there until the close.
On the other hand, the doji candles have no color. The doji and long-legged doji illustrate the battle between buyers and sellers that ended in a tie. The opening price and closing price are in the same place as bulls were unable to close prices higher and bears were unable to close prices lower.
How to Trade the Doji Breakout
Ideally, you want to find a doji that has formed near a level of support like a trend line. You want to identify the doji high and the doji low as this will determine the support and resistance levels of a potential breakout.

GBPNZD Bullish Update on 1 HR QUICK 50+ PIPSSomeone wanted to know how this would look on the 1 HR chart. The original markup was completed on the daily chart, which can often be difficult to translate to the hourly chart. As you can see GBPNZD is due for a break out to the upper support level. You will notice higher lows on the hourly chart. I feel this will be a quick 50+ PIP move over the new few (Possibly 3 or 4) hours.
-Thanks for reading. Much success.
-StampsFX

USDJPY [Daily] Looking to sell within supply zoneBulla are trying to retest broken trendline + possible supply based on daily chart

EURUSD [Weekly] Two possible bullish scenariosAs you can see on the weekly chart bulls have two possibilities to recover towards end of the year
and probably this week events ( elections + FOMC ) may create opportunity ( it's related to prevous DXY analysis here ):
1. Based on the last two weeks PA swing low around 1,13 might be in place ( would be great to close above last week high ) or...
2. Full manipulation into election/FOMC with stop hunting down towards 1,1240/1,1200 with strong rejection.

DXY [Weekly] Ahead of elections and FOMCLast week extremes ( high and low ) are going to be very important for both sides.
Mid term elections in US on Tuesday and FOMC on Thursday ( no change but statemnt as key ) could give Us
few hints about dollar near term future ( where we are going to be at the end of the year ).
Bulls: "thank you NFP" , bulls used better number as excuse to avoid damage on weekly chart but that might not be enough.
To gain momentum we need to go through and close above last week high which will open they way towards 98,60/99,80
Bears: may try to " play the stop hunt game " based on last week high ( as stop zone area where we saw rejecton ). So possible supply around 97 zone to try to build swing high, confirmation on a weekly close below last week low.

[DXY] How to use Fibonacci IndicatorHi guys !
This a simple chart with a explicit Fibonacci Indicator. Many people asking me how to use it, it's easy, have a look.
Story : Fibonacci was an Italian mathematician (1175 - 1250). He discovered this number sequence like this: Each numbers is calculated by adding the two previous numbers, for exemple : 1, 1, 2, 3, 5, 8, 13, 21, 34, 55, 89...
The special thing in this sequence is that every numbers is 1.618 of previous and 0,618 of next one. And as you know, 1,618 is the "Gold number" .
(Hope my english is not too bad haha)
1 - Choose a higher and lower price (downtrend) or lower and higher price (uptrend)
2 - Fibonacci will retrace different line at 23.6, 38.2, 50, 61.8, 78.6 and 100 %
3 - Theses line will be the next supports / resistances in the correction / bounce
You can use it to place the best order (BUY or SELL) and make more profit.
Ask me for any questions !
Thanks for your time.

EURUSD [Intraday] 1,1422/33 as key level for todayEURUSD 1,1422/33 intraday key lvl in my opinion ( close above might be bullish ) , possible intrtaday demand around 1360/50
End of the month flow will dominates today ( if US comapnies want to transfer dollar in October casue of TAX reform they have to buy it today t+2 on spot )

EURUSD [1h] To be or not to be ? Long...Current 1470/50 as line in the sand and we are testing it again.

EUR/CAD Sell shortHere we have the EUR/CAD on the ichimuku chart we feel that this will be a bearish day for the EUR
we feel that this will fall down to around 400 - 700 points.
Comment if you feel different

EUR/NZD Forgotten idea last week.Hello everyone, Sorry for this late post we forgot to post last week in our private idea box so we posting now.
This was a very good move for us. we was expecting a slight short fall but it looked liked it never happened.
comment below if you have any comments?
Thank you
Daniel.

Education post 1/100 - How to trade pin bars?The Pin Bar Setup
I bet you have seen many pin bars on your Forex charts. Maybe you haven’t been aware that you are looking at a pin bar formation, but you most likely have come across this candle on the chart
Bullish Pin Bar
A valid, tradeable bullish pin bar is located at the end of a bearish trend and its lower candle wick goes below the overall price action. If you spot a bullish pin bar setup on the chart, this will setup a nice opportunity for a long position.
Bearish Pin Bar
The same is true for bearish pin bars but in the opposite direction. The bearish pin bar is located at the end of a bullish trend and its longer candle wick is the upper area. In this manner, the longer wick is sticking out above the price action. The bearish pin bar is usually a good sign of an upcoming price reversal in the bearish direction.

EURCHF Sells. Keeping the read and approach really simplistic.Looking to sell this pair as it comes up towards 2100. If it comes up way too aggressive, the sells would be off. If not, would be expecting to take the sell there to at least the recent low.

NZDUSDHi everyone ! Today I am gonna give you my NZDUSD analysis.
We are on the bullish rally to the 0.672 +/- level.
What I see now on the 1H chart is bearish divergence, It means that there will be a correnction on the road to the level which I mentioned above. (I hope)
Enjoy your life and follow me !
For Educational Purposes Only.

swissfranc/yen short Signal!very good short coming up on this pair! Set up couldnt look any better, break of an uptrend, retouch candlestick on the 50% fib line which is also a new key level of reisistance, and this pair is about to melt in the coming days/weeks. Cant wait to see how this trade plays out, Could be the trade of the year.

usdjpy long idea the 4hr and 1 hr chart lead me to believe that the Dollar is about to rise on the yen. the 4hour chart has shown that usdjpy is in an uptrend for the last month or 2. it has been exhausting to a key level of support, The pair has just broken it's short term resistance, is retesting and now i believe it is about to go to the moon. Blast off.