What is the name of this order?Please answer this question if you know the answer. Example is on screen. OANDA:NZDJPY
Forexeducation

EURUSD is trading in a contracting triangleAccording to the analysis that we made, price will move sideways between 1.1660 and 1.1580 zone.
Selling at the resistance line of the contracting triangle is the first trade that we'll give it a go
If we can reach to the bottom of the triangle, next trade will be a buy from marked zone.
Good luck
--------------------
Thanks for the likes and support. Feel free to comment

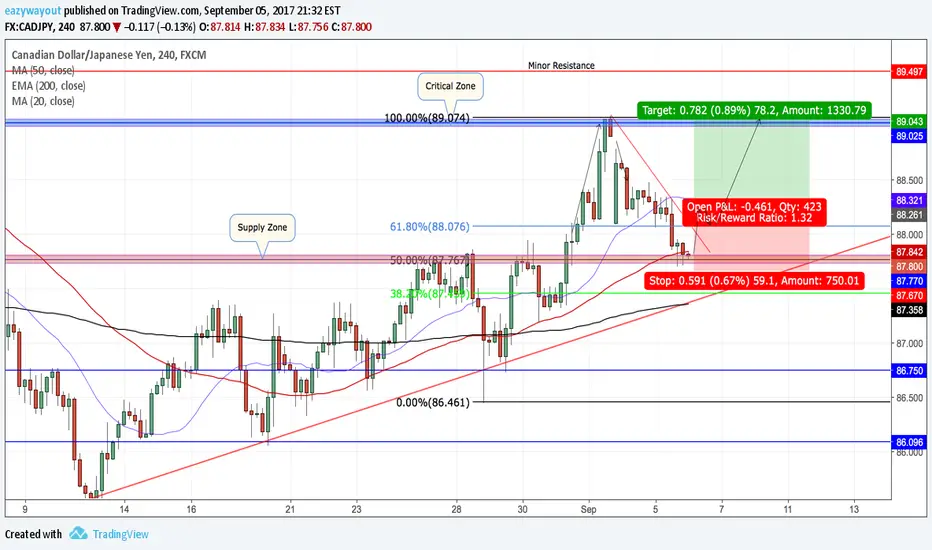
CADJPY Fibonacci setupWe're trading at 618 level of the daily move.
Price is showing signs of short term reversal which we're planning to take advantage of.
Need a signal at the 84-84.20 zone in order to execute
Good luck
-------------------------
Thanks for the support and likes, feel free to comment

EURUSD...WHAT NOW?If we look to the DXY idea we expect USD weakness. The DXY is made up of 58% EURO. Which is why there's a heavy correlation between the Index and the currency pair.
If we expect USD weakness we must expect EURUSD to move higher, price is currently sitting at the key support much like the DXY sitting at the $95.00 resistance level. If price holds at this key level of 1.1600 price could see further upside into the key resistance of 1.2040. A break below will cement the USD strength moving forward.
Seasonally through July the USD usually sees weakness strengthening our idea for a retracement for the USD and EURUSD prices moving higher.


NZDUSD (Neutral)Price move of pair into zone above or below extends to next zone above or below as shown
www.trading-equity.com

USDJPY - Monthly UpdateRecent price action: Neutral
Pattern: Asymmetrical triangle
Long-term momentum: Bullish
Short-term momentum: Bearish
Bias: Neutral
Action: Price needs to be trading above the 111.2 level and trend resistance to consider a long position.
Comments: Major indecision happening in this pair. U.S. trade war keeping price ranging

EURUSD - Monthly AnalysisRecent price action: Bearish
Pattern: Potential head and shoulders
Long-term momentum: Bearish
Short-term momentum: Bullish
Bias: Short
Action: Stay in the trade until price hits weekly support then close the position. Price needs to correct and find a area of resistance. Only after there is a strong bounce off that level consider taking short positions again.
Comments: Closely correlated with DXY index. Price is forming a inverse and and shoulders. If the pattern completes there I expect EURUSD to follow.

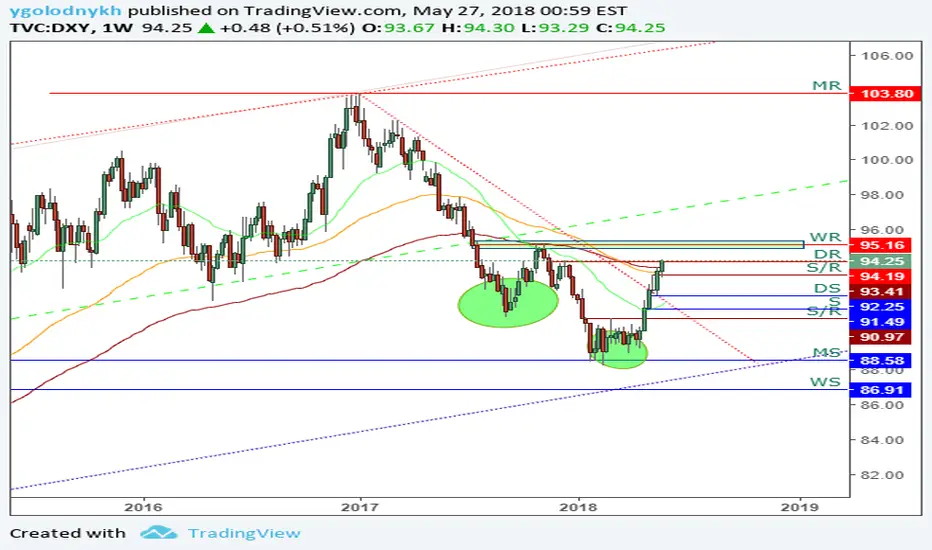
DXY - Weekly Chart AnalysisRecent price action: Bullish
Pattern: Potential inverse head and shoulders.
Long-term momentum: Bullish
Short-term momentum: Bullish
Bias: Long
Action: Ride current U.S. trades to weekly resistance, sell, then rebuy after price finds support again. Would be nice for price to retest 29 EMA for support.
Comments: Price is finally trading above all EMA’s. Price is approaching an area of resistance that has held almost one year (late June/early July). There will definitely be a rejection there, but after price finds support, continue the buying.
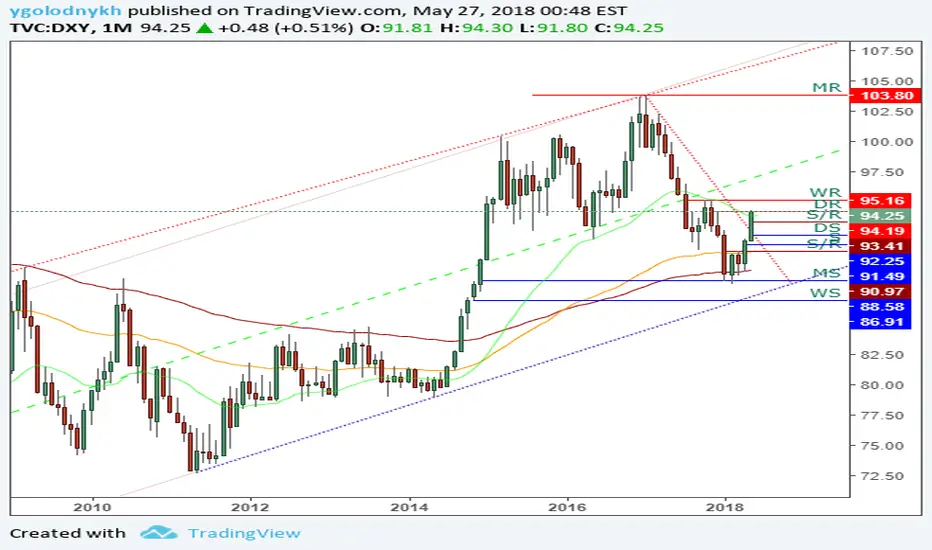
DXY - Monthly Chart Analysis, Potential 10% MoveRecent price action: Bullish
Pattern: Potential inverse head and shoulders. Price would have to reject off weekly resistance, find support near daily support, and move back above weekly resistance. Price has also broken out of its corrective phase.
Long-term momentum: Bullish
Short-term momentum: Bullish
Action: Ride current U.S. trades to weekly resistance, sell, then rebuy after price finds support again. Would be nice for price to retest 29 EMA for support.
Comments: Looks like strong bullish momentum. I would like to see price test monthly support by end of year if momentum holds. That would equate to roughly a 10% move.
GBPJPY BULLISH IDEAIf 147 continues to hold It wouldn't surprise me to see the bulls make a run at some higher levels. If they're really serious I could see 160 being hit over the next months/year or so.

gbpaud high probabiliry longswith the first and second target being displayed, expecting gbpaud to see the 1.7500 resistance zone and above, after a deep fib retracement and some technical analysis

gbpjpy sells cypher pattern spotted on gbpjpy , in line with other technical analysis . first and second target dispalyed

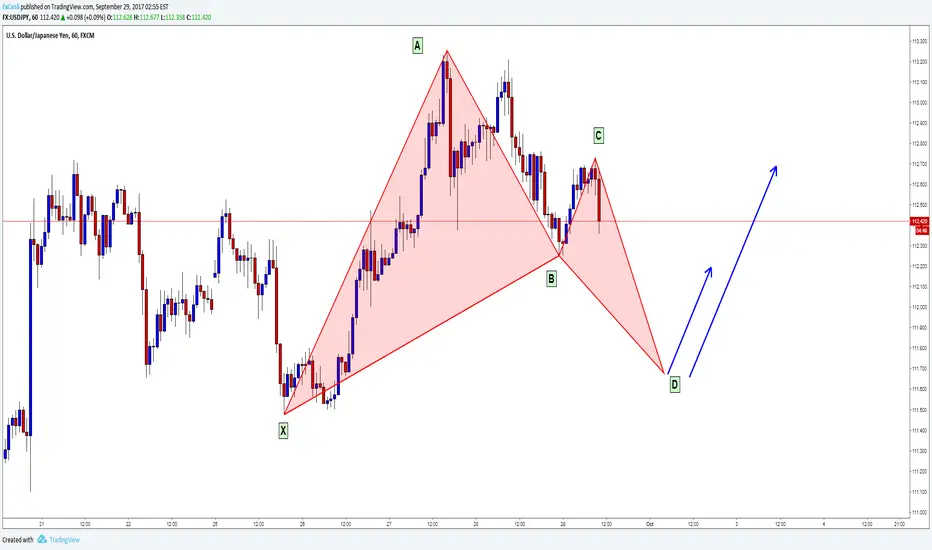
USDJPY / H1 / Bat Pattern
If you dont know how to trade with this analyses, please look at the related ideas at below
Use %2 Risk Management
we are not trading for D point, Price may not come to D point
we will enter trade When price will come to D point of the Pattern
D point is end of Triangle
At the related ides, there are the rules of target and trading Strategies
Good Luck
Looking for Gartley to form on AUDUSDNot trading this pair yet, but keeping eyes to see what formations we can get. Potential setup for Hartley harmonic pattern

AUDUSD 9/20/17I am still learning the markets but a quick mark up of AUDUSD has me lead to believe that the pair will drop slightly and consolidate, before dropping to the macro trend line and bounce off to continue rise.

CADJPY 4H:Price respecting supply zone / 50 fibonacci level. I am looking for a break of counter trend line then retest before going long. This is a setup I have in mind for CAD news tomorrow morning, and will look to enter around that time.
Only enter after solid confirmation :)
Go Short a Break Below Opening Range Low & Previous Bar LowsAction to Take: Go Short, enter sell at 130161 stop
Take Profit Level: TP1 129615, TP2 129372 Stop Loss Level: 130481
Additional Factors:
Timeframe: ~ 24 hours
Total Risk of Account Equity: 2% or less

Simple profitable trading strategy!!I am posting this chart in order to show you how easily you can take profit of the market if you keep the analysis simple.
You don' t need many indicators that could make you confused.
In other words KEEP YOUR CHARTS CLEAN.
Then you would be able to understand in depth what you cant see in a messy chart.
As you can see, first we have a strong bearish move.
So then we expect a retracement that is placed exactly at 0.38.
Now i want to show you the importance of 1.2 fibo extension. In my opinion it is the most important level. It is clear that the price is always lookng for that level before having a retracement.
When the price is above MA50 we expect it to reach 1.2 fibo extension that could be your target level as well.
DON'T FOERGET. KEEP YOUR CHART CLEAN.
Thank you for your time!!

EURUSD Short setupVery nice Harmonic patterns next to Q Zone, i prefer to go short after retesting the Zone


GBPCHF (Stall Neutral)GBPCHF has reached critical resistance in our view. Current price structure suggests upward move that began on the 16th of March 2017 may have amounted to a protracted correction and may be in the process of topping out. Our main bias is now to the downside and we look for any daily price close and penetration below zone bounded by red and black upward sloping trendlines for short entries till around 1.19118 over most likely, some weeks. Further penetration of 1.19118 should bring 1.11995 area into sharp focus also over a few weeks.
On the other hand, any daily price close above 1.31927 is expected to bring a protracted 1.41615 into sharp focus on the upside also over some weeks.

