THE KOG REPORT THE KOG REPORT:
In last week’s KOG Report we said we would be looking for a price to attempt the higher level red box sitting around the 3370-75 region and if not breached, we felt an opportunity to short would be available from that region. We said if that failed and the move commenced, we would be looking at a complete correction of the move back down into the 3330-35 region, where we would then monitor price again in anticipation of a long from there or the extension level of 3310 which was also a red box short target (move complete). As you can see from the above, not only did we get that higher red box, we rejected, completed the move downside and then our traders managed to get that long trade all the way back up into the Excalibur target, red box targets and the hotspots shared in Camelot.
A decent week again, not only on Gold but also the numerous other pairs we trade, share targets on and analyse.
So, what can we expect in the week ahead?
For this week we can expect more ranging price action, but due to the previous range from last week being so tight, it looks like we’ll see a breakout coming in the latter part of the week unless there is news to bring us unexpected volume.
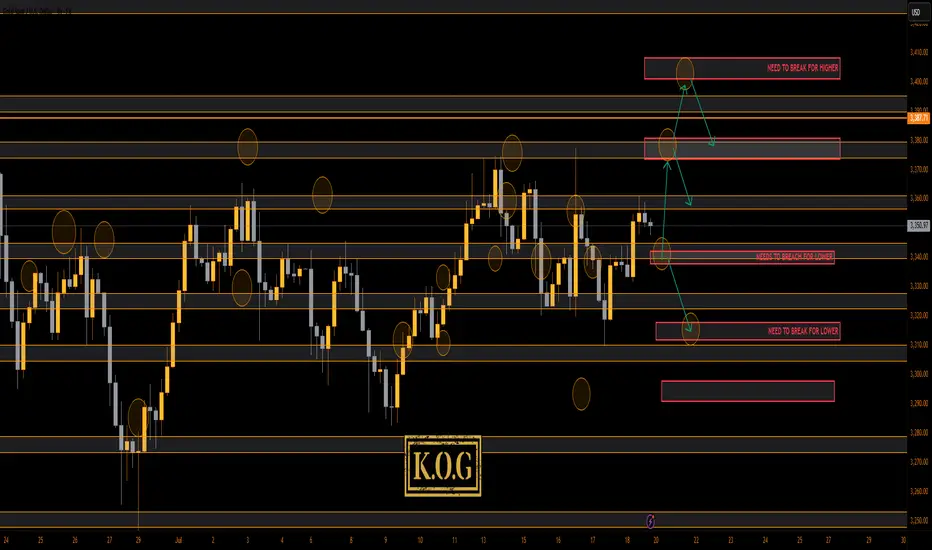
We have the key level below 3335-40 support and above that resistance and a red box sitting at 3375-80. This is the region that needs to watched for the break, and if broken we should hit the range high again at 3400-10. However, if rejected, we could again see this dip to attack that lower order region 3310-6 before attempting to recover.
Last week we wanted to see that curveball and although we did see some aggressive price action, I think we will see something extreme for this week. It’s that lower level 3310-6 that is a key region for bulls, if broken we can see a complete flush in gold taking us down into the 3250’s before we start the summer run. That for us would be the ideal scenario going into the month end, but, we’ll play it how we see and as usual, we go level to level and update any changes as we go along.
KOG’s Bias for the week:
Bullish above 3340 with targets above 3355, 3361, 3368, 3372 and above that 3385
Bearish below 3340 with targets below 3335, 3330, 3322, 3316, 3310 and below that 3304
RED BOX TARGETS:
Break above 3350 for 3355, 3361, 3367, 3375 and 3390 in extension of the move
Break below 3340 for 3335, 3330, 3320, 3310 and 3306 in extension of the move
Please do support us by hitting the like button, leaving a comment, and giving us a follow. We’ve been doing this for a long time now providing traders with in-depth free analysis on Gold, so your likes and comments are very much appreciated.
As always, trade safe.
KOG
Forexindicator
THE KOG REPORTTHE KOG REPORT:
In last week’s KOG Report we said we would be looking for the price to attempt the higher resistance level shown on the chart which was slightly higher than the red box. We wanted this level to reject price and give us the move down into the level which was shown on the chart. As you can see this move worked from the open, respecting the red box active level instead and completing all the bias level bearish targets in one swoop after the break.
We then updated the KOG Report with the move we wanted in order to then long into immediate resistance to again test the short trade, which again worked while we suggested traders look for the lower red box levels to attempt the long trades.
There was slight stretch again downside, but those red boxes played their part giving us the move on confirmation for the longs towards the end of the week, ending the week on a high.
It was a difficult week to trade with aggressive movement across the markets, however, the levels are reacting well and although there is a stretch on price, we’re getting the movement we want.
So, what can we expect in the week ahead?
We have key level now on the daily also aligning with the EMA50 at 3162 on the daily chart, while that 4H shows us a possible reversal on the flip. For this reason we have given the immediate red box levels of 3225-30 resistance and 3190-85 support. We have also plotted the potential range of play for the early part of the week, where we feel price may stabilise until a further move.
We’re looking for two possible moves here, one in order to continue to short and then look for the longer trade lower down, or, a break of the red box and bias level into higher resistance upon which we’ll trade level to level and then look higher for a potential short again. The bias level for this week has a huge extension of the move so it will be tradeable both directions. We have applied filters to the algo which is under test so we’ll also want to see if that works in our favour.
So, for now, support below can give us the move into the 3225-30 region which is the level to watch for the break, if rejected there may be an opportunity to short but that short must break below the 3185 level to continue and complete the move downside into the 3150-55 and below that 3130 levels. That’s where we feel the opportunity to long for the swing may come from but please remember, it’s changed structure until we break and hold above the 3265 level. That will be this week’s key level.
KOG’s bias of the week:
Bearish below 3235 with targets below 3196, 3185, 3177, 3165 and 3155
Bullish on break of 3230 with targets above 3242, 3250, 3255 and 3262
RED BOXES:
Break above 3210 for 3118, 3220, 3225, 3230, 3235 and 3247 in extension of the move
Break below 3195 for 3187, 3179, 3165, 3155, 3150 and 3137 in extension of the move
Please do support us by hitting the like button, leaving a comment, and giving us a follow. We’ve been doing this for a long time now providing traders with in-depth free analysis on Gold, so your likes and comments are very much appreciated.
As always, trade safe.
KOG

THE KOG REPORT - NFPTHE KOG REPORT – NFP
This is our view for NFP, please do your own research and analysis to make an informed decision on the markets. It is not recommended you try to trade the event if you have less than 6 months trading experience and have a trusted risk strategy in place. The markets are extremely volatile, and these events can cause aggressive swings in price.
We’ve done well this week on gold, capturing the high into the low and then taking the long late session which has nearly completed our higher target for a decent week on this precious metal. As we’ve said, best practice is to let this play out, let them take it to where they want, once it settles, then look for the trade.
We have support now at the 320-35 level which is a key level that will need to break in order to reverse and go lower. This level also lines up with our Excalibur levels and red boxes so we can say it’s pretty strong. Above, we have the 3270-75 region which is the previous order level, our volume indicator is suggesting a pull back, so rejection there can take us back into support to settle for the NFP release. It’s this level, if held which can push this upside and our thoughts are at the moment, are they going to take this back into the previous range and hold it there into the close.
So as long as 3240 holds us, we’re likely to see higher pricing for now, 3310-20 is the key level above which needs to break to then give us the flip and potential for a new all time high.
For now, let’s sit back and see what happens.
RED BOXES:
Break above 3262 for 3265, 3270, 3275 and 3288 in extension of the move
Break below 3252 for 3240, 3236, 3230 and 3220 in extension of the move
Please do support us by hitting the like button, leaving a comment, and giving us a follow. We’ve been doing this for a long time now providing traders with in-depth free analysis on Gold, so your likes and comments are very much appreciated.
As always, trade safe.
KOG

THE KOG REPORT THE KOG REPORT:
In last week’s KOG Report we said we would be looking for the price to continue upside into the region given which gave us a fantastic capture for the start of the week. We then had to adapt as the bias level and targets on the red box indi changed suggesting more upside. We continued to complete all our bias above targets as well as Excalibur and LiTE giving us 100% again for the week!
It wasn’t easy as it sounds, it took a lot of work and constant monitoring but the pip capture on gold was out of this world and well worth it!
So, what can we expect from the week ahead?
For this week we seem to be creating a DB on the 4hr chart which entails caution. We have resistance just above at the 3330-35 with extension 3240-45 region which if attacked and rejected in the early session could give the potential short trade into the support level 3295-8 which is the key level that needs to break for us to go lower.
There is a lot of liquidity above, especially those who like us shorted and held trades from the 3450 levels so the bias this week changes to the 3350-55 level, break above and we will confirm the move higher, otherwise, our thoughts are a test is likely on the high but we would like to get that long from lower to again create a new ATH.
Let’s see how we open, these markets need to be adapted to every day so making long terms plans as intra-day traders isn’t on our agenda at the moment. The market is giving short term, so why not take advantage of the conditions while they last.
Potential for gaps on open so please be careful, we’re on red boxes and extreme levels only.
RED BOXES INDI LEVELS:
Break above 3320 for 3327, 3330, 3335, 3345, 3347 and above that 3362 in extension of the move
Break below 3310, for 3306, 3297, 3295, 3280, 3266 and 3255 in extension of the move
Even the scalping levels are HUGE!
Please do support us by hitting the like button, leaving a comment, and giving us a follow. We’ve been doing this for a long time now providing traders with in-depth free analysis on Gold, so your likes and comments are very much appreciated.
As always, trade safe.
KOG

Chande Kroll Stop: Definition, Calculation, and Trading StrategyChande Kroll Stop: Definition, Calculation, and Trading Strategies
In the ever-changing landscape of financial markets, traders are constantly seeking effective tools to manage risk and protect their investments. The Chande Kroll Stop, a dynamic indicator, is one such tool that has gained popularity due to its ability to help traders determine optimal stop loss locations. In this article, we will delve into the Chande Kroll Stop, exploring its definition, formula, and application.
What Is the Chande Kroll Stop?
The Chande Kroll stop is a technical analysis indicator that is used to determine the optimal placement of a stop-loss order. It was developed by Tushar Chande and Stanley Kroll, two highly-respected figures in trading in the mid-90s, and is grounded in the idea of volatility.
By taking into account the current price, market volatility, and the security's average true range (ATR), the indicator calculates an appropriate stop-loss level that moves in tandem with the security's price. It’s plotted as two lines that help traders determine their stop losses, regardless of whether they go long or short. It is applicable to virtually every asset class – traders can use the Chande Kroll Stop for forex, commodities, stocks, and cryptocurrencies*.
Calculation of Chande Kroll Stop
The Chande Kroll encompasses three key components: the average true range (ATR), the multiplier, and the current price of the security.
ATR: The ATR is a volatility measure calculated by averaging the true ranges over a specific timeframe. The true range is determined by finding the maximum of the following:
- The range between the high and low of the current period.
- The difference between the close of the previous period and the high of the current period.
- The difference between the close of the previous period and the low of the current period.
Multiplier: The multiplier adjusts the ATR and is typically set between 1 and 3, depending on the trader's risk tolerance.
Price: The current price of the security being analysed.
The Chande Kroll Stop formula is as follows:
Initial high stop = HIGHEST (high) - x * Average True Range
Initial low stop = LOWEST (low) + x * Average True Range
Short stop = HIGHEST (Initial high stop)
Long stop = LOWEST (Initial low stop)
This calculation produces two stop-loss levels, typically a red (or orange) and green (or blue) line. The stop-loss may be placed below the green line for a long position, while it could be placed above the red line for a short position.
So what are the three numbers for the Chande Kroll stop? The ATR’s current period is denoted by the letter P (10 by default), while X represents the ATR multiplier (1 by default). Q is the lookback period for updating the indicator lines; its initial value, 9, means that the indicator will adapt to the highest and lowest values of the short-stop and long-stop lines, respectively, across the previous 9 bars.
However, there’s no need to perform these calculations yourself. In TradingView, you’ll discover the Chande Kroll Stop alongside dozens of other tools ready to help you navigate the markets.
How to Use the Chande Kroll Stop Indicator in Trading
When learning how to read the Chande Kroll stop, there are three key areas to be aware of: setup, stop-loss implementation, and entry signals.
Setup
The first step is to adjust your Chande Kroll Stop settings to suit your risk tolerance and trading style. In essence, setting a higher period for P will widen both lines and give your positions more room to breathe, while increasing X will bring the line closer to the current price. Similarly, a lower Q value will produce a more responsive indicator that will stop you out sooner.
Stop Loss Implementation
Once you have found your preferred settings and added the indicator to your chart, you can use it as a dynamic stop-loss. For a long position, you can place your order below the applicable level (blue line) and adjust it as the indicator adapts. In a short position, traders place it above the orange line.
Entry Signals
Although the Chande Kroll is primarily a stop-loss tool, it can also provide entry signals. When the long-stop line crosses above the short-stop line, it can signal that bullish momentum is entering the market. Conversely, the opposite can indicate that a short position could be opened.
Advantages and Limitations of Chande Kroll Stop Indicator
Advantages:
The Chande Kroll Stop is a dynamic indicator that adapts when the price moves, making it a potent risk management tool.
By taking into account market volatility, it offers protection against sudden price fluctuations, becoming particularly useful in volatile assets.
The simplicity of Chande Kroll's calculation and application makes it accessible to traders of all experience levels.
Limitations:
The indicator can be overly sensitive to price movements, leading to premature stop-outs and potentially missed opportunities.
It may be less effective for assets with low volatility, which could make it unsuitable for certain trading approaches or timeframes.
The Chande Kroll should not be used in isolation. It's best to combine it with other technical indicators and analysis techniques.
Final Thoughts
Overall, the Chande Kroll stop is a useful tool for traders looking for a dynamic stop-loss order that takes into account volatility. Now that you have a solid overview of the Chande Kroll stop and how to use it, why not consider opening an FXOpen account? You can enjoy access to over 700 markets and low-cost trading. Good luck!
*Important: At FXOpen UK, Cryptocurrency trading via CFDs is only available to our Professional clients. They are not available for trading by Retail clients. To find out more information about how this may affect you, please get in touch with our team.
This article represents the opinion of the Companies operating under the FXOpen brand only. It is not to be construed as an offer, solicitation, or recommendation with respect to products and services provided by the Companies operating under the FXOpen brand, nor is it to be considered financial advice.

THE KOG REPORTTHE KOG REPORT:
In last week’s KOG Report we said we wanted to see price dip into the lower support and give us the opportunity to long into the higher levels targeting the red box targets and the bias levels given. We manged to get this trade and started the week well! We then suggested traders play caution as the set up just wasn’t presenting itself for the short, instead, we updated our plans and published the long idea again which played out well giving us a decent end to the week. The ranging gave us conflicting signals and choppy price action towards the end of the week, so not 100% to plan, but we played it and adapted.
We managed another stellar performance on Excalibur, 6 targets on Gold and another trunk full on the other pairs we trade and analyse in Camelot. Difficult, but consistent nevertheless.
So, what can we expect in the week ahead?
Ideally we would like to wait for the market to open and break out of the range before picking the direction. We have lower support at 2930 and the extension level 2918-14 which needs to be watched for the break in the early part of the week, while the key level above 2950-55 with extension into the 2960 region should act as a barrier which will need to break.
We’ll start by saying if the price does support that 2930-25 level on the open, then the opportunity to long into the 2943 and above that 2950 levels should be available to those looking to go long. We have marked a RIP point 2960-65 but that will only give us the flip so scalps into the lower support region are potentially all we will get.
Above that we have marked our area of interest, this is ideally where we want to be monitoring the price action and looking for signs of a potential reversal, which, if given should give us a nice swing short into the lower levels which will be published on morning reviews and KOG’s bias of the day.
On the flip, If we glitch and make a move downside on the open, look out for the levels of 2920-16 and below that 2910! These region need to hold us up to go higher in order to clear the liquidity from above before another attempt at lower.
It’s the last week of the month, it’s going to be choppy and ranges will form. Indications of lower pricing are on the horizon, the set up just isn’t clear at the moment so play it level to level, keep an eye on the red boxes, look back at the KOG reports and see for yourself how well they play with price. Take it easy, “if it’s exciting, you’re doing it wrong”. We’ll update as through the week as we usually do with the red box targets, KOG’s bias of the day and the indicator levels.
KOG’s bias of the week:
Bullish above 2920 with targets above 2945, 2949. 2952 2955 and above that 2970
Bearish below 2920 with targets below 2916, 2910, 2906, and below that 2898
RED BOX TARGETS:
Break above 2943 for 2947, 2950, 2955, 2962, 2966 and 2977 in extension of the move
Break below 2930 for 2923, 2920, 2910, 2906 and 2899 in extension of the move
Please do support us by hitting the like button, leaving a comment, and giving us a follow. We’ve been doing this for a long time now providing traders with in-depth free analysis on Gold, so your likes and comments are very much appreciated.
As always, trade safe.
KOG

THE KOG REPORT THE KOG REPORT
In last week’s KOG Report we said we would like to see price attempt a brief test of the high, reject and give us the move down which was successful. We then wanted to exit any short trades and find the optimal spot to long back up sticking to the bias and the bias targets as well as the red box targets and Excalibur. Combined, we got the move up from the pivot red box and managed to complete all of our bullish targets ending the week with a phenomenal pip capture tracking this precious metal at nearly every turning point up and down.
A fantastic week again in Camelot not only on Gold but the other pairs we analyse and trade as well.
So, what can we expect in the week ahead?
For this week again we’ll stick with the bullish bias for now. The key level resistance on open is the 2715-14 price point, if rejected we should see a continuation of the move downside into the lower support levels 2700, 2690 and below that the key level and bias level support 2680-5. It’s that lower level that needs to be monitored, as building a base there and upon a clean reversal we feel the opportunity to then long the market again back up into the 2725, 2730 and above that 2740-5 region initially is what we’ll be looking for.
Our weekly red box worked well last week giving the rejection we wanted, and due to the failed break, we would like to see that level attempted again to monitor whether we close above or not. This is really important for gold as another fail can result in another major correction before attempting higher pricing.
KOG’s bias of the week:
Bullish above 2680-5 with targets above 2720, 2730, 2735 and above that 2745
Bearish on break of 2780 with targets below 2670 and below that 2766
RED BOX TRADERS:
Break above 2704 for 2710, 2716, 2735 and 2733 in extension of the move
Break below 2695 for 2788, 2682, 2680 and 2665 in extension of the move
Please do support us by hitting the like button, leaving a comment, and giving us a follow. We’ve been doing this for a long time now providing traders with in-depth free analysis on Gold, so your likes and comments are very much appreciated.
As always, trade safe.
KOG

THE KOG REPORT - FOMC THE KOG REPORT – FOMC
This is our view for FOMC, please do your own research and analysis to make an informed decision on the markets. It is not recommended you try to trade the event if you have less than 6 months trading experience and have a trusted risk strategy in place. The markets are extremely volatile, and these events can cause aggressive swings in price.
For this FOMC we have the following key levels which need to be monitored and can be used for potential spikes. 2630-25 support, which is too close to target from here could give us that push upside into the higher levels of 2650-55 and above that 2660-65. It’s that higher region we will want to be watching closely for a potential RIP and opportunity to then short back down as shown on the chart. Immediate levels are no good to us here if there is exaggerated volume in the markets on the release, or the press conference 30mins after.
On the flip, if we continue the move downside breaking through the 2630 level we will be looking lower, 2610 as the point of interest but the extension of the move into the 2590-95 region is where we will want to be to waiting for the RIP and potential opportunities to then long back up.
Simple one this time, if we don’t get the levels, we want we’ll stay out of it and come back tomorrow to look for a decent set up.
Our bias target at 2667 still remains so please play caution.
RED BOXES:
Break above 2640 for 2650, 2660 and above that 2668
Break below 2625 for 2610, 2596
Please do support us by hitting the like button, leaving a comment, and giving us a follow. We’ve been doing this for a long time now providing traders with in-depth free analysis on Gold, so your likes and comments are very much appreciated.
As always, trade safe.
KOG

THE KOG REPORT THE KOG REPORT
In last week's KOG report we said to expect choppy price action, but we did not expect it to last the whole week! What a week however, the range allowing traders to trade within it up and down making the most of the levels on the boxes and Excalibur. We gave the weekly key level as 2620 which we said will need to break to go lower, otherwise, opportunities from that level were available and worked well.
On Friday we published the NFP report, again giving the key level for the push up 2625, this also worked well for traders, with the bonus of the short to end the week. A fantastic week for traders with us completing a phenomenal 37 targets across the markets!
We had that higher region of 2670 which however was not visited, so is it still available? Let’s dive in.
So, what can we expect from the week ahead?
This week we would expect this price action to continue, the range getting a little larger but the up and down movement making it difficult to hold position, at least for the first part of the week. We have that key level of resistance above again at 2650 with that level of 2670 still active on our books. For that reason, we feel this decline isn’t ready just yet, but the lower levels are available for consideration. Support below 2620 and below that the 2610 level are opportunities if we can continue this slow decline downside. We have the extension of the move at 2590 as key level support, so we feel that’s the ideal long trade for the swing up, if attacked.
Looking at the chart in more detail, and applying the red boxes, we can see we have defence above at 2635-40, which if held, can continue this move down into the red box 2625 as the immediate level for the range. A break of that level will take us further into breaker move 2610 and 2590 before any exhaustion.
As we close in to the festive period, we can expect volume to be thin over the coming weeks as well as sudden burst of profit taking, so please trade carefully for the remainder of the month, reduce your lot sizes and make sure you have a sensible risk model in place.
KOG’s Bias for the week:
Bearish below 2665 with targets below 2620 and below that 2610
Bullish on break of 2665 with targets above 2670 and above that 2685
RED BOXES:
Break above 2639 for 2650, 2660, 2663 and 2670 in extension of the move
Break below 2627 for 2620, 2610 and 2595 in extension of the move
Please do support us by hitting the like button, leaving a comment, and giving us a follow. We’ve been doing this for a long time now providing traders with in-depth free analysis on Gold, so your likes and comments are very much appreciated.
As always, trade safe.
KOG

THE KOG REPORT - ELECTION SPECIAL UPDATEEnd of day update from us here at KOG:
The path has worked quite well so far with price testing the high, adhering to KOG's bias for the day and week and respecting the red boxes. We've managed to stay the right way and capture most of the move down completing nearly all the bias level targets on the KOG Report.
So, what now?
We have major support below at the 2650-55 region with slight extension in to 2645. If this level is attacked and defended in the coming sessions we should get a move back upside into the initial levels of 2675 and above that 2680-5. We do need to see a clean reversal for this to happen so let's be patient if you're looking to go long. Those who followed and are short, we suggested protecting and taking partials along the way while enjoying the move.
For now, planned and executed, Excalibur and the red boxes performing well. Let's see what tomorrow's news brings.
As always, trade safe.
KOG

Euro's Path Ahead: Short-Term Struggles, Long-Term Triumphs**Current Momentum and Market Sentiment:**
The EUR/USD pair is currently experiencing a challenging period, struggling to maintain bullish momentum. Despite a significant rally in recent months, the pair has recently faced resistance and corrective movements. The European Central Bank's (ECB) actions, including recent interest rate hikes and upward revisions to inflation forecasts, have supported the Euro, but market skepticism remains due to varying global economic conditions and the Federal Reserve's cautious stance on future rate hikes.
**Technical Analysis and Key Levels:**
The Euro is trading above its 20-year cycle support line, a critical historical level that previously led to a five-year rally after being broken in January 2003. The current price action, characterized by consistent volume buildup, suggests underlying strength. However, the momentum observed from January 2017 to late 2021 has been less stable, influenced heavily by the COVID-19 pandemic and subsequent economic measures.
For the short term, the EUR/USD is anticipated to continue facing volatility. The immediate resistance is noted around 1.1050, with support around 1.0800. A potential target by the end of 2024 is 1.169941, assuming stabilization in interest rates and continued economic recover.
### Long-Term Forecast (Next 2-5 Years)
**Macroeconomic Factors:**
Long-term prospects for the Euro will largely depend on several macroeconomic factors, including the ECB's monetary policy, inflation trends, and economic growth in the Eurozone. The structural reforms and fiscal policies adopted by member countries will also play a crucial role in shaping the currency's trajectory.
**Historical Context and Future Projections:**
Reflecting on the historical context, the Euro's previous rally post-2003 lasted five years until the 2008 financial crisis. Given the current economic landscape, a similar prolonged uptrend could emerge if global economic conditions stabilize and Eurozone economies demonstrate robust growth.
Over the next 2-5 years, the Euro might target higher levels, potentially reaching or exceeding the 1.2000 mark, driven by economic resilience and a balanced approach to monetary tightening by the ECB. However, this projection is contingent on the absence of significant geopolitical disruptions and a steady recovery from the pandemic-induced economic downturn.
### Conclusion
In summary, while the Euro shows potential for both short-term gains and long-term growth, it remains subject to market volatility and economic uncertainties. Investors should closely monitor ECB policies, global economic indicators, and geopolitical developments to make informed decisions. The anticipated stabilization of interest rates by the end of the year provides a cautiously optimistic outlook for the Euro, aiming for a target of 1.169941 by year-end and further growth in the following years.

GBPUSD Sell trade March 14 2024Simple correction of GBPUSD 4h TF.
-I noticed this trade starting from change of character and then BOS.
Upon leaving that area, it create a market structure and small supply (can be seen in 15min/30min)
After this I set a pending order. ( validity was the BOS structure - 15min)
It then activated today march 14 2024. (wyckoff distro originates this move).
I plan to hold until it reaches my desired target.
RR: 1:9
WYCKOFF DISTRIBUTION.

USD CAD -SELL trade Activated March 6 2024Good day guys!
another great trade ( pending sell limit activated last Wednesday) march 6
I started checking this pair because of USD CAD daily TF
It is in area of distribution ( supply) ---> I manage to go down from 4H to 1H so I can see fluctuations and introducing new areas of supply in smaller timeframe. It took me 3 hrs to wait for proof and validity 1.35465 move lower (can be seen in 1H -15min TF)
after this I set pending sell limit in my mt4. Aiming for 1:7 RR :)
This was a perfect example of powerful supply (check daily to 4H TF)
#wyckoffdistribution

NAS100 Next Sell opportunity 16922 - 16974NAS100 Next Sell opportunity 16922 - 16974
Target will be 16624 Wait for confirmation....................
SL ( Set a uniform set of 15$ ) only for your reference and you can set it according to your free margin.
Recommend stop 17016

Dec 19 2023 GBPUSD BUY Trade Activated (pending order) Good day folks!
Another great trade in this currency pair.
Look at daily TF bullish since 1.21020, I often used hedging trade but i think i got this one. Last week was sell then this tuesday, buy trade activated. Always adjust your analysis depending on the actual behavior and do not stay married to your first bias :) .
As i checked 4h-3h-2h-1h, there was an IC (POI created ) when accumulation schematics was introduced last week dec 12 onwards. So i monitor the left side of the chart and also see an IMB in price. I set pending order in my MT5 account so i can still ride the trade even when i am offline.
My trade come to fruition because of HTF bias and then validity in low tf.
I set my trade in lower tf for a better RR . :) .Hopefully my trade will have a momentum until friday, but no more loss in this trade due to the fact that I always take some partials in trades.
I hope you learn on something on this, have a great day.
#accumulation
#wyckoffiantrader
RR: 1:16

Is BTCUSD low at 28477 going to hold and become a weekly bottom We are looking at a potential entry on daily seller bar high to be taken out for price to continue further upwards and go onto confirm the bottom on daily and then weekly according to our smart money framework indicator.
BTCUSD(Long)
E - 30035
SL - 28476
T - To be confirmed(TBC)
We will be tracking this move and updating the post as we go along on the charts and on video. Keep a look out for it traders.

Clean Chart Affords Clean Re-Entries OANDA:EURUSD
During down times, I always like to play around with the tools that I have.
Experiment, mix and match around my anchor-indicators, and you never know what you can come up with.
I think this set-up, has some nice re-entries.
Now pair this up with a higher time frame.
We just may have a winner.

AUD/NZD Buy setup Video analysisHopefully you guys enjoy the breakdown, if you have any question leave a comment below and i will respond
follow me for more updates like this

EURAUD BREAK OF 1.469 GET'S UGLY🔸️Ticker Symbol: EUR AUD Timeframe: 15M🔸️Investment Strategy: Short
TECHNICAL ANALYSIS: EURAUD is on my watchlist. If we end up breaking support at this key level of 1.469 I do believe we can see a push lower in the market. Here are a couple factors that I like to look at. To start off we are trending in a sideways pattern on the 15m Timeframe. Typically, when we are trading in this pattern, and we get into the top red section on our linear regression indicator this has indicated historically that we could see a push lower. We can also tell that our bottom indicator is showing money momentum shifting out of the market along with a red middle band representing bear market momentum. With all of these metrics pointing in the same direction I do believe we could potentially see a nice selloff on EURAUD in the coming days. Thank you so much for following!
🔔 Follow for daily stock, crypto and forex technical analysis.
⚠️ Trading is risky, and I understand nothing is guaranteed. Proper risk management should be in place at all times to minimize losses. Please consult a financial advisor before trading. All Inclusive Trading LLC is not a financial advisor and may not be held liable for any losses which may occur.

DXY Tilted H&S Pattern -- 29/Jul/20Hello Traders,
Hope you all are doing good!!
DXY looks like forming a H&S pattern.
The index has already broken below the neck line but we need to wait for the weekly candle close confirmation below it.
If break below, Bears can take it to 92.5 level
**Today's FOMC meeting can be the main driver.
Please follow me and like if you agree or this idea helps you out in your trading plan.
Disclaimer: This is just an idea. Please do your own analysis before opening a position.

AUDJPY Sell 400 Pip OpportunityAUDJPY retested Resistance zone and looking for a corrective drop.
Indicators:
Pair is currently overbought and at a strong Resistance level.
Weekly RSI in a strong sell zone
Up trend line has broken, retested, and bounced off the back indicating downwards movement.
Entry:
1. Current price area
2. Wait for retracement on shorter time frame at 75.80 area
TP at next support at 72.00 area
Good luck trading!
Charles V
CVFX Management
www.cvfxmanagement.com
@cvfxwealth

NZD/USD consolidates in Asia as traders await the outcome of G20NZD/USD extends downside following NZ PM cited downside risks to the economy due to China's coronavirus.
In Asia session the Kiwi moved back into an area of support for which bulls will be looking for a test of the supply commitments from the bears, with a target of the 0.65.
Fibonacci Projection showing price action for managing profits & not for entries or reversals.

EURUSD Consolidating LossesEUR/USD remains firmly in bear grip
The EUR/USD pair came under strong selling pressure in the early trading hours of the American session and touched its lowest level since April of 2017 at 1.0786 before staging a rebound.
