THE KOG REPORT - FOMCTHE KOG REPORT – FOMC
This is our view for FOMC, please do your own research and analysis to make an informed decision on the markets. It is not recommended you try to trade the event if you have less than 6 months trading experience and have a trusted risk strategy in place. The markets are extremely volatile, and these events can cause aggressive swings in price.
It’s been an aggressive month on the markets especially this week which has been testing for traders due to the extended movement on gold. We’ve managed to stay ahead of the game and although we missed the move downside, we’ve capture scalps up and down trading it on an intra-day basis rather than a swing.
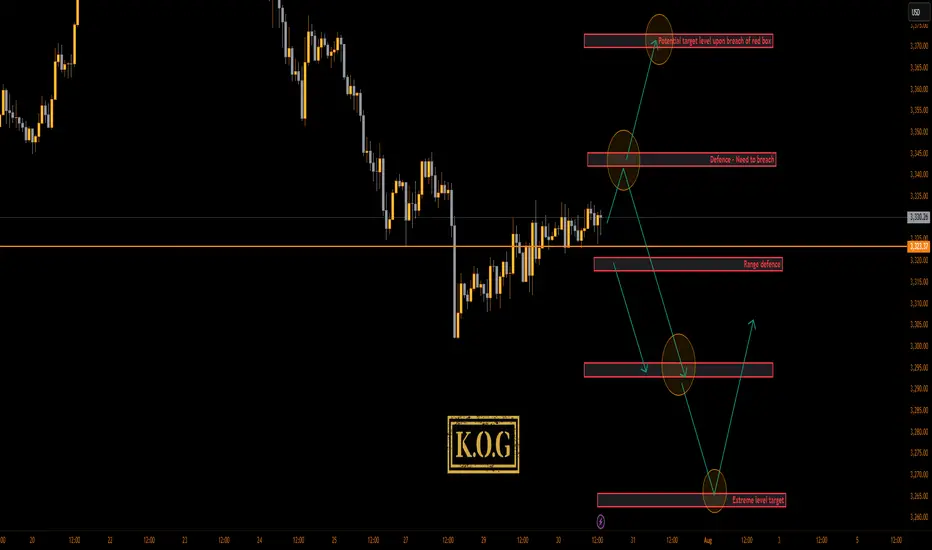
Looking at the 4H chart, we can see we have support forming at the 3310 level which is the key level for this week and will need to be broken to go lower. If we can flip the 3334 resistance, price should attempt higher into the 3355-60 region which is where we may settle in preparation for NFP. on Friday This is the level that needs to be watched for the daily close, as a close above will confirm the structure and pattern test which can form a reversal if not breached.
Now, here is the flip! We’re still sitting below the daily red box but we know this break does give a retracement and with sentiment long, it may not be a complete retracement again. Here 3345-50 is the red box to watch and as above, if not breached, we may see a rejection here which will confirm no reversal for higher and, potentially a further decline into the 3270-5 regions for the end of the month and quarter.
Pivot – 3323-6
RED BOX TARGETS:
Break above 3335 for 3338, 3340, 3345, 3347 and 3357 in extension of the move
Break below 3320 for 3310, 3306, 3302, 3297 and 3393 in extension of the move
Please do support us by hitting the like button, leaving a comment, and giving us a follow. We’ve been doing this for a long time now providing traders with in-depth free analysis on Gold, so your likes and comments are very much appreciated.
As always, trade safe.
KOG
Forexindicators
THE KOG REPORTTHE KOG REPORT:
In last week’s KOG Report we said we would be looking for price to attempt that higher level and potentially break for higher pricing. If it didn’t the path showed the level for an opportunity to short which fell just short but worked well into the level we initially wanted.
We then published the red box targets and the bias through the week which held, and we managed to complete all bearish targets by Friday.
Was it easy? No! Did we expect that flush? No! We simply got to a stage on Friday where we could only watch or get in with the volume, so we stood back and just watched.
So, what can we expect in the week ahead?
Simple one this week. We can see potential for lower, however, we’re too low to attempt shorting this, especially with the key level 3250-55 just below and major support. For that reason, we published the red boxes to help you all, look for the break either side! Ideally, we want to support on the low from the open and then continue with the move upside into the 3280-85 level initially, which should flip us on the support at 3270-75. We could range there as there is no news tomorrow but a gradual incline is what we’re looking for.
Support 3250-55 needs to break for lower, while resistance 3306-10 is the level that needs to break to go higher. That’s our potential range for now.
KOG’s bias for the week:
Bullish above 3250 with targets above 3278, 3285, 3297 and above that 3306
Bearish below 3250 with targets below 3240, 3232, 3220 and below that 3212
RED BOX TARGETS:
Break above 3275 for 3279, 3285, 3289 and 3306 in extension of the move
Break below 3260 for 3255, 3251, 3240 and 3235 in extension of the move
Please do support us by hitting the like button, leaving a comment, and giving us a follow. We’ve been doing this for a long time now providing traders with in-depth free analysis on Gold, so your likes and comments are very much appreciated.
As always, trade safe.
KOG

THE KOG REPORTTHE KOG REPORT
In last week’s KOG Report we said we would want the lower level red box to be tested and rejected in order to give us the move upside into that 3330-35 region where we wanted to monitor the price for the short. We managed to get a pin point move, however, we had to exit the short trades early due to the support level holding us up. We then continued to follow Excalibur and the red box indi’s which were suggesting higher pricing and by the end of the week we had completed all our bullish above target levels, plus Excalibur trade targets and LiTE again performed at 100% accuracy.
A phenomenal week in Camelot, not only on Gold but the numerous other pairs we trade, analysis and post on.
So, what can we expect from the week ahead?
For this week we can expect some gaps on open which is going to make it difficult due to skewed data. We will however stick with the red box levels and the tools we have to make a plan for the two scenarios we may see potential of.
Scenario one:
Price opens and gaps upside, we’ll be looking for the levels of 3455-60 for a potential reaction in price, if achieved, an opportunity may be available to short there back down into the 3450, 3443 and 3435 levels.
Scenario two:
If we do open and gap downside, we’ll look for the levels of 3430-23 to hold us up, and if achieved, an opportunity to long there back up into the 3450-5 level and in extension of the move 3465 may be available.
It’s a difficult one again as no one knows how the market is going to open and what is going to happen. So we’ll update traders as much as we can during the day and the week with KOG’s bias of the day and red box target levels
KOG’s bias of the week:
Bearish below 3465 with targets below 3425, 3420, 3410 and 3406
Bullish on break of 3465 with targets above 3477, 3485, 3492, 3495 and 3503
Red Boxes:
Break above 3435 for 3443, 3448, 3465 and 3476 in extension of the move
Break below 3420 for 3410, 3406, 3397, 3385 and 3380 in extension of the move
Many of our followers and traders have seen the power of the red boxes, Imagine this on your own TV screen, 4H for swing trading, 1H for day trading and 15min for scalping. Any pair on any chart 23hrs a day. Add to that the Knights indicator giving you swing points, key levels and retracement levels and our custom volume indicator telling you when to long, when to short and when to stand back from your trades.
LEARN AND GENERATE YOUR OWN SIGNALS. You don't need any of us to guide you.
Please do support us by hitting the like button, leaving a comment, and giving us a follow. We’ve been doing this for a long time now providing traders with in-depth free analysis on Gold, so your likes and comments are very much appreciated.
As always, trade safe.
KOG

THE KOG REPORT THE KOG REPORT
In last week’s KOG Report we said we would be looking for price to attempt the high, fail and make the move downside. This worked well in the early part of the week giving traders a fantastic capture for the short trade into the red box target levels which were all complete. During the week we update trades with the plan to long, and although there was a break from the red box, our lower red box bounced price giving the long trade completing the move.
It was only towards the end of the week where we started ranging that we only managed to capture short scalps on the upside move before the suggesting we call it a day, thankfully before the small decline from the level.
So, what can we expect in the week ahead?
We have a key level here of 3310-6 which has been a previous pivot in this range and is holding price down at the moment. This now make a crucial support region forming at the 3280-5 level with extension of the move into 3275. If this level holds and the red box reacts, we can see price push up from here and attempt to target the 3400 level again, which is towards the top of the range.
It’s this lower red box that needs to be watched for the break, as a break here will target the 3250-55 region initially and then go for the potential swing low around the 3210-2- region which in this scenario maybe the ideal long trade.
As always, we’ll update traders through the week with our analysis and red box target levels but for now, let’s see if we gap on open. Please remember, the market gaps with intention, the intention is usually to get traders in chasing the gap as soon as they see immediate exhaustion, this hardly ever works on gold and BTC especially. We’ve back tested the stretch, so please play caution on chasing gaps.
More choppy and ranging price action expected!
KOG’s bias of the week:
Bullish above 3285 with targets above 3306, 3310, 3321 and 3335
Bearish below 3285 with targets below 3267, 3255 and 3240
RED BOXES:
Break above 3290 for 3297, 3306, 3310, 3320 and 3330 in extension of the move
Break below 3280 for 3277, 3270, 3267 and 3255 in extension of the move
Many of our followers and traders have seen the power of the red boxes, Imagine this on your own TV screen, 4H for swing trading, 1H for day trading and 15min for scalping. Any pair on any chart 23hrs a day. Add to that the Knights indicator giving you swing points, key levels and retracement levels and our custom volume indicator telling you when to long, when to short and when to stand back from your trades.
LEARN AND GENERATE YOUR OWN SIGNALS. You don't need any of us to guide you.
KEY LEVEL 3237!
Please do support us by hitting the like button, leaving a comment, and giving us a follow. We’ve been doing this for a long time now providing traders with in-depth free analysis on Gold, so your likes and comments are very much appreciated.
As always, trade safe.
KOG

THE KOG REPORT - FOMCTHE KOG REPORT – FOMC
This is our view for FOMC, please do your own research and analysis to make an informed decision on the markets. It is not recommended you try to trade the event if you have less than 6 months trading experience and have a trusted risk strategy in place. The markets are extremely volatile, and these events can cause aggressive swings in price.
Our NFP KOG Report worked pretty well apart from it being a Friday and us closing out positions for the weekend only for the move to complete on Monday. For this FOMC we’ll share the levels and potential reaction points on the red boxes as well as the red box target levels. Due to the range, it’s best to wait for the break and also for them to move the price to where they want, then hunt the trade once price has settled.
We have the immediate support level below 3360-55 which if held can push this upside to break the recent high and that 3480-90 level again. Break of that level we have red box region 3330-20 which is where we could get a RIP but that will give us the flip with potential for the order region 3350-55 to turn into resistance unless broken. For that reason, a down move for now could only give scalps for decent captures on tap and bounces.
3320 is the line in the sand, if broken below we’ll get the long from the 3290-95 region which will come next week.
Note, these days it’s only Trump that manages to move the markets aggressively, so this FOMC is most likely already priced in. Not worth attempting the immediate levels so we’ll rather wait for the extreme levels.
RED BOXES INDI LEVELS:
Break above 3395 for 3406, 3410, 3420, 3430 and 3435 in extension of the move
Break below 3375 for 3370, 3366, 3356, 3351 and 3345 in extension of the move
Please do support us by hitting the like button, leaving a comment, and giving us a follow. We’ve been doing this for a long time now providing traders with in-depth free analysis on Gold, so your likes and comments are very much appreciated.
As always, trade safe.
KOG

THE KOG REPORT THE KOG REPORT:
In last week’s KOG Report we said we would anticipate a potential curveball and that being that price may just support on the open at the immediate support level and give the move upside into the 3010 and above that 3020 region which was achieved. We then updated traders with the FOMC report suggesting a further move upside into the 3050-55 region which is where we suggested the potential short will come from.
After the push up into the level and then some accumulation, Friday gave us the volume we needed to break away from the range and complete the move downside to end the week.
Again, nearly all of our bias level targets were completed, the bias level worked well, Excalibur performed well and the red box indi’s worked a dream, even in the choppy market conditions.
So, what can we expect in the week ahead?
We have an issue with gold at the moment, although it’s broken the immediate range, it’s still above 3000 with a larger range low around the 2990 and below that 2970-75 region. That potential swing point below is an area of interest for us this week and leading up towards the end of the month. For that reason, if we can support at the first red box below, and continue the move that started on Friday up into those 3025, 3030 and above that 3035-7 price points we’ll want to monitor this careful for a reversal to form. If we can get it, an opportunity to add or take the short may be available to traders, this time in attempt to break below the 3000 level into those lower support level mentioned and shown on the chart, which also correspond with the red boxes. As many of you have seen over the last year or so, we’ve been sharing these indicator boxes on the 4H for the wider community for free, as they are extremely powerful in identifying turning points and entry and exit points for traders. So let’s keep an eye on them this week for the break and closes, RIP’s and rejections.
We’re mostly looking for this one move to complete, however, there has to be a flip! This week, the flip is breaking above that 3035-37 level which will also be this week’s bias level. If we do breach, we’ll be looking at this to then continue higher, breaking 3050 and then resuming the move into the active Excalibur targets above which ideally, we don't want to see happen yet!
So, we know we want higher, what we do want though is better entry levels for the longs, until then, if we can capture these short trades we’ll of course gratefully take them.
KOG’s bias for the week:
Bearish below 3040 with targets below 3010, 3006, 2997, 2985 and below that 2978
Bullish on break of 3040 with targets above 3050, 3055, 3063 and above that 3067
RED BOXES:
Break above 3037 for 3040, 3047, 3050, 3055, 3063 and 3066 in extension of the move
Break below 3010 for 3006, 3000, 2997, 2990 and 2985 in extension of the move
This should give you an idea of your levels, please use them!
Please do support us by hitting the like button, leaving a comment, and giving us a follow. We’ve been doing this for a long time now providing traders with in-depth free analysis on Gold, so your likes and comments are very much appreciated.
As always, trade safe.
KOG

THE KOG REPORT - FOMCTHE KOG REPORT – FOMC
This is our view for FOMC, please do your own research and analysis to make an informed decision on the markets. It is not recommended you try to trade the event if you have less than 6 months trading experience and have a trusted risk strategy in place. The markets are extremely volatile, and these events can cause aggressive swings in price.
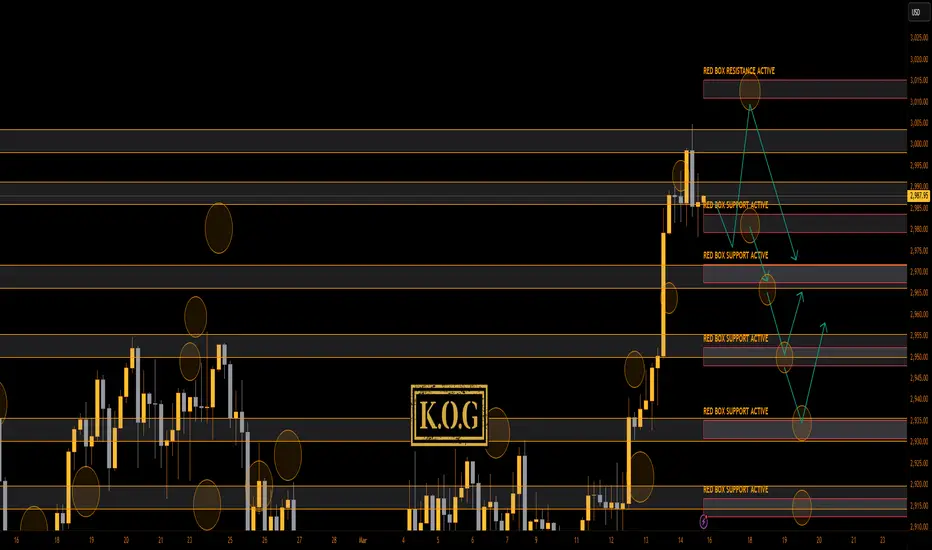
While gold is relatively new to this range we have to entail some caution if we’re even going to consider trading this FOMC. Markets are a little fragile, we’re at ATH’s and the moves are extremely aggressive. So, we’ll highlight the red box levels and the potential move we’ll be looking for, sticking to the extreme and key levels, ignoring the intermediate levels.
Looking at the chart we have a support region below 3010-15 which if spiked into and held can push this back up this time to break above 3030 and attempt to attack that 3050 region. That in our opinion would be the first point to start looking for price to exhaust, but it will only give us the flip so longer scalps are likely to be all we’ll get.
If we break above the 3055 region we’re likely to go higher giving us a red box resistance level of 3065-75. It’s this level we would ideally like to target from a lot lower down if we can get that entry. For that reason, we have given the level below on the break of 3010 sitting around 2990-80, we’ll have to wait and see, but if we can get down there a nice swing could present itself.
RED BOX INDICATOR:
Break above 3030 for 3050, 3055, 3063 and 3070 in extension of the move
Break below 3020 for 3912, 3006, 2996 and 2990 in extension of the move
Please do support us by hitting the like button, leaving a comment, and giving us a follow. We’ve been doing this for a long time now providing traders with in-depth free analysis on Gold, so your likes and comments are very much appreciated.
As always, trade safe.
KOG

THE KOG REPORT - UpdateEnd of day update from us here at KOG:
Not a bad start to the week with the lower Red box support which was active holding price and giving the push up early session completing the first red box target. Since that we've experience accumulation and ranging which allowed us a short trade on the indicator and then a nice long to end the day, which is now protected and managed.
We'll stick with the plan at the moment expecting a spike up with the first region being 3006 and above that 3010. Again, a bit high to even attempt a long as traders will want to see if we can hold above the 3000 level, until then, we'll look for the potential RIP.
KOG’s bias for the week:
Bearish below 2995 with targets below 2970, 2965, 2955 and below that 2950
Bullish on break of 2995 with targets above 3003, 3006, 3010, 3016 and above that 3020
RED BOXES:
Break above 2995 for 2997✅, 3003, 3009, 3016 and 3021 in extension of the move
Break below 2980 for 2975, 2971, 2965, 2959, 2955 and 2945 in extension of the move
Short and simple this week, let’s see how the week plays out and remember, your risk model is there to protect you, use it, keep your losers small and your winners big!
Please do support us by hitting the like button, leaving a comment, and giving us a follow. We’ve been doing this for a long time now providing traders with in-depth free analysis on Gold, so your likes and comments are very much appreciated.
As always, trade safe.
KOG

THE KOG REPORT THE KOG REPORT:
In last week’s KOG Report we said it would be a difficult one to decipher so we suggested traders wait for the break, trade into the levels given and then look for the RIPs. This worked particularly well for us giving us the move into the lower level as analysed on the break, using the red boxes for direction and then giving us the tap and bounce that we wanted to take the long trades back up into the new all time highs we witnessed towards the end of the week.
We managed to compete all of our bias level targets, getting a pin-point move from KOG’s bias and on top of that completing Excalibur targets and the red box targets. Not a bad week at all on Gold.
So, what can we expect in the week ahead?
For this week we’ll be looking for a retracement on the move, however, we are not discounting a curveball move from immediate support to clear liquidity from above. We have the resistance level above 2990 and lower support 2980 which could be the play for the opening. If we break above 2995, we’ll be looking for price to attempt that 3010 and above that 3020 region before attempting to short it again.
On the flip, if we do reject that higher level and can break below 2980, we’ll stick with the plan from last week where we’re looking to continue the retracement back down first into the 2965 level and below that 2950-55. If you look on the chart, we have highlighted a lower level which is sitting around 2935-20, an aggressive move downside can take us there on the manipulation move, so please trade with caution this week and keep an eye on the levels.
KOG’s bias for the week:
Bearish below 2995 with targets below 2970, 2965, 2955 and below that 2950
Bullish on break of 2995 with targets above 3003, 3006, 3010, 3016 and above that 3020
RED BOXES:
Break above 2995 for 2997, 3003, 3009, 3016 and 3021 in extension of the move
Break below 2980 for 2975, 2971, 2965, 2959, 2955 and 2945 in extension of the move
Short and simple this week, let’s see how the week plays out and remember, your risk model is there to protect you, use it, keep your losers small and your winners big!
Please do support us by hitting the like button, leaving a comment, and giving us a follow. We’ve been doing this for a long time now providing traders with in-depth free analysis on Gold, so your likes and comments are very much appreciated.
As always, trade safe.
KOG
THE KOG REPORT THE KOG REPORT:
In last week’s KOG Report we said we would be looking for price to tap into the lower red box region, give the long trade up into the red box resistance which was active and then give us the opportunity to short the market sticking to our bias and our bias target levels. Although we missed the precise entry by 30pips from the highs, we managed to get in and complete not only the bias target levels, KOG’s bias of the day target levels, Excalibur target algo levels and LiTE EA targets hitting 100% on those for the week.
A fantastic week on markets on just on Gold but on the other pairs we trade and analyse as well. Well done to our traders and team.
So, what can we expect in the week ahead?
After the move we witnessed last week we would expect there to be some retracement on the horizon, however, it all depends on this lower level of 2850-47 holding price up in the early sessions. If we do see a clean set up here an opportunity to take that potential long into the level above 2865-70 should be available. It these level above that are concerning, they need to break above for us to confirm this as a short term low, however, unless broken 2875-80 and above that 2895-2900 should be decent target levels for the longs and also pivotal points to watch for reversal to continue the move downside.
On the flip, we do have a level below sitting at 2805-10, which is also a bearish below level. If we continue this move downside from the opening, we’ll look to continue with the move downside on the daily red boxes and then look for an opportunity to take a swing long from lower down.
Key levels this week:
Resistance – 2890 / 2904
Support – 2850 / 2830 / 2810
Potential range – 2810 – 2880
KOG’s bias for the week:
Bullish above 2847 with targets above 2865, 2871, 2876, 2880 and above that 2904
Bearish below 2847 with targets below 2840, 2835, 2830 and below that 2810
RED BOXES:
Break above 2860 for 2865, 2872, 2874, 2885 and 2900 in extension of the move
Break below 2847 for 2840, 2836, 2831, 2823 and 2810 in extension of the move
Please do support us by hitting the like button, leaving a comment, and giving us a follow. We’ve been doing this for a long time now providing traders with in-depth free analysis on Gold, so your likes and comments are very much appreciated.
As always, trade safe.
KOG

THE KOG REPORTTHE KOG REPORT:
In last week’s KOG Report we said we would be looking for the market to open, test the high and then give us the short trade into the lower red box levels. We gave the levels of 2775 and 2755-60 to traders for potential RIPs of which the 2775 region gave us the tap and bounce that we wanted to get that long trade.
We mentioned our target level of 2828 which was active and as we saw, it not only completed but was surpassed. During the week, we updated traders with the plans for pull backs and red box target levels, of which again, nearly all were completed. That along with another 8 Excalibur targets just on Gold!
An extremely decent week on the markets in Camelot, not only on gold but the numerous other pairs we trade and analyse.
So, what can we expect in the week ahead?
For this week we’re in a similar situation to the last two weeks, price has close high and it’s too risky for us to attempt long trades up here unless we’re scalping the red boxes. We have the immediate resistance level above of 2865-8 which is a potential opening target if they take this upside from the open. This is a key level and needs to be watched, if rejected this could be the first opportunity to short again into the lower levels of 2855-50 and below that 2830-35. If broken, we’ll look higher at the 2895-2902 (target region) level for another attempt.
On the flip, ideally we want to see this go down into the first region 2830-5 for the bounce, and then flip the resistance to continue the move downside into the lower support and red box levels which is where we will be waiting again to swing this long.
In summary, expect ranging first part of the week, potential for 2885 resistance and 2855 support which are the levels that need to break to determine the next move. Don’t get carried away with trading it to the moon or shorting it to the core of the earth. Trade it how you see it on the day, follow KOG’s bias of the day and the red box targets which are proven to be effective for day traders and scalpers.
KOG’s Bias for the week:
Bearish below 2875 with targets below 2855, 2850, 2845 and below that 2835
Bullish on break of 2875 with targets above 2890, 2897, 2899 and above that 2902
RED BOXES:
Break below 2850 for 2847, 2844, 2839, 2835 and 2826 in extension of the move
Break above 2860 for 2865, 2872, 2874, 2890 and 2902 in extension of the move
Please do support us by hitting the like button, leaving a comment, and giving us a follow. We’ve been doing this for a long time now providing traders with in-depth free analysis on Gold, so your likes and comments are very much appreciated.
As always, trade safe.
KOG

THE KOG REPORT - NFPTHE KOG REPORT – NFP
This is our view for NFP, please do your own research and analysis to make an informed decision on the markets. It is not recommended you try to trade the event if you have less than 6 months trading experience and have a trusted risk strategy in place. The markets are extremely volatile, and these events can cause aggressive swings in price.
After another successful week on the markets, I would suggest traders take it easy on this one and let them do and take the market to where ever they want, we’ll find the better opportunities next week.
To start, looking at our indicators, we still have room for lower pricing, however, there is a key level above sitting around the 2903-10 region. So, we’ll start by saying if they push this up into that level and reject, as in wick, we feel that’s where a minor correction of the move up may start from. Support here stands at the 2860 level, if held that move may complete. Note, the weekly close is important, and If it want’s to close higher, they will need to hold this above the 2880 region, so if they want to break above we may only get scalps from there.
On the flip, if they take this down, we’re going to ignore the immediate levels and monitor the key levels below 2830-35 and below that on the break the level of 2810 and 2805. These lower levels are important for price to stay above and would represent opportunities to swing long.
Simple one this time, levels are on the chart, less experienced traders should definitely not get involved.
Red boxes:
Break above 2875 for 2883, 2887, 2900 and 2903 in extension of the move
Break below 2860 for 2855, 2850, 2835 and 2820 in extension of the move
Please do support us by hitting the like button, leaving a comment, and giving us a follow. We’ve been doing this for a long time now providing traders with in-depth free analysis on Gold, so your likes and comments are very much appreciated.
As always, trade safe.
KOG

THE KOG REPORT - UpdateEnd of day update from us here at KOG:
It wasn't quite exact, however, we managed to get the move down that we wanted for the short, stopped at our Red box support which was active, got the bounce, got a lovely long, then the short from the region we wanted....what an end to the day. We've completed our bias level targets for the day and the target of 2828 which we gave traders nearly two weeks ago and yesterday in the KOG Report.
A choppy opening with gaps across the markets, but Excalibur and the indicators were not threatened at all.
So, now we have the support level below 2807-10 and the resistance region 2830-5 region. We would like to see a retest of this new high so if we do pullback into the support level and hold, it's likely we will see a new all time high again in the sessions to come.
Can we long? Not recommended up here unless we get back down into 2775 regions. Otherwise, keep an eye on the levels above, looks like a curveball is on its way!
KOG’s Bias for the week:
Bearish below 2810 with targets below 2795✅, 2775✅ and below that 2755.
Bullish on break of 2810 with targets above 2820✅, 2824✅, 2828✅ and above that 2835
RED BOXES:
Break of 2810 for 2815✅, 2818✅, 2828✅, 2830✅ and 2834 in extension of the move
Break of 2790 for 2785✅, 2877✅, 2765 and 2755 in extension of the move
Please do support us by hitting the like button, leaving a comment, and giving us a follow. We’ve been doing this for a long time now providing traders with in-depth free analysis on Gold, so your likes and comments are very much appreciated.
As always, trade safe.
KOG

THE KOG REPORT - 3 months in the making!A different update this time as it's the end of the month and Gold has made ANOTHER ATH!
3 Months ago, pre-election we projected the move we anticipated, plotting the highs and the lows to target in order to capture the move into the new ATH. The red arrow is the projection from the 31st of Oct, the green arrows are the actual move. Pinned below are the original posts.
During the week, every week we update traders with our thoughts and projections, the KOG REPORT and again on an intra-day level managed to capture opportunities both on the sell side and buy side to capture this move.
We decided a month ago to call it complete however, as there were signs on the chart that gave us that deeper pullback, but, we managed to get back on track and here we are, not far from that target level.
We just wanted to take this opportunity to say thank you to all those who followed us on the reports, the bias level targets, the red box targets and the projections. We can honestly say it didn't go to badly.
Please do support us by hitting the like button, leaving a comment, and giving us a follow. We’ve been doing this for a long time now providing traders with in-depth free analysis on Gold, so your likes and comments are very much appreciated.
As always, trade safe.
KOG

THE KOG REPORT - NFPTHE KOG REPORT – NFP
This is our view for NFP, please do your own research and analysis to make an informed decision on the markets. It is not recommended you try to trade the event if you have less than 6 months trading experience and have a trusted risk strategy in place. The markets are extremely volatile, and these events can cause aggressive swings in price.
Quick report this week with the key levels to look for during the rest of the day. We had the 2630-35 region hold price down, giving us the move into the lower target regions completing all the bearish targets for the week, so now we’ll look for a similar move, or, simply stay out of it.
We have the level of 2670 still active from the KOG Report, maybe they have held back all week to swoop that level, so for that reason, that is where we will look to for a RIP and possible short attempt.
Circled below is a key level, 2625, any attempts at that region with rejection can give that push upside, unless broken. We did say yesterday a break of support will take us into those lower levels of 2610-15 which has already happened, so a similar move can not be discounted for a potential bounce from below.
Due to the range, the movement can be extreme, so please be careful, remember the trade comes after the event, let them move price to where they want, look for a clean reversal and you can capture the reversal.
RED BOXES:
Break above 2650 for 2661, 2664 and 2670 in extension of the move
Break below 2625 for 2615, 2610 and 2695 in extension of the move
Please do support us by hitting the like button, leaving a comment, and giving us a follow. We’ve been doing this for a long time now providing traders with in-depth free analysis on Gold, so your likes and comments are very much appreciated.
As always, trade safe.
KOG

THE KOG REPORT - UpdateEnd of day update from us here at KOG:
We wanted price to reject the high and give us the short into the red box defence during the early session levels 2730-35. We did get that move but it was achieved via the gap on open giving traders a couple of opportunities to take the long trade from the level following the path. We're yet to complete the first bullish target but we're on our way so we'll stick with the plan!
Based on the structure and range at the moment we're not discounting another dip into the low but will look for pull backs into the 2735 region to hold to continue the move upside.
Support 2735, resistance 2750 could give a reaction for the short scalp. Keep an eye on the red boxes, pinned below, they're working really well.
As always, trade safe.
KOG

THE KOG REPORTTHE KOG REPORT:
In last week’s KOG Report we wanted to short from the 2630-35 region into the lower levels, which worked but we only managed to get 2613 when we wanted 2610. Ideally, we wanted lower to then access the price action and look for the long, however, that long came early and we managed to capture the move both down and then up completing our bias target levels plus the extra pip capture into the highs to end the week.
A great week not only on gold but we completed 32 targets giving our traders a phenomenal pip capture across the markets. Nice, easy, clean trading!
So, what can we expect in the week ahead?
We've had some more geopolitical news over the weekend so there is a chance that we will see some opening gaps on the markets. We also have NFP this week, so towards the end of the week can expect the usual pre-event price action and ranging to form.
Now, due to us expecting these potential gaps, best practice is to let Monday early session do what it needs to do, instead plot the levels and look for the RIPs to capture the scalps, ideally on the red boxes.
We have the immediate levels above at 2665/7 resistance, which is a crucial level price needs to reject to continue the move downside! For that reason, we are giving a bias level of bearish below 2670 provisionally with an extension of the move into 2675 which is the flip. If we attack these levels, and get the reaction we need, we feel these levels will represent opportunities to short into the lower levels 2650-55 and below that 2630-35.
If broken above, we get that flip and we’ll be looking to target that 2701 level and above that we have 2707, which is where we may get further opportunities to attempt the short again.
Important: There is an extension of this downside move, and it’s below our bias level bullish above 2630-35. Oddly enough, we also have an Excalibur target sitting down there active! We will want to see how the market opens and what they do in the early session before we make up our minds on that move. NFP could through a spanner in the works for traders!
For now, we’ll stick with the above and as usual we’ll update traders through the week.
Look out for KOG’s bias of the day, KOG’s red boxes and the indicator levels which are published for the wider community.
KOG’s Bias for the week:
Bearish below 2670 with targets below 2650 and below that 2635
Bullish on break of 2675 with target above 2685 and above that 2701
RED BOXES:
2665 break above for 2672 / 2685 / 2701 / 2707
2650 break below for 2635 / 2624 / 2620
Please do support us by hitting the like button, leaving a comment, and giving us a follow. We’ve been doing this for a long time now providing traders with in-depth free analysis on Gold, so your likes and comments are very much appreciated.
As always, trade safe.
KOG

December 1 2023 - GBPUSD Buy Trade ActivatedHi guys!
I have here a simple trade this week, checking the daily TF of pound dollar, i noticed a supply above (nov. 29 2023) -Nov. 30 move.
After checking the bullish move on daily---> 4h---> 3h-->2h--> 1h. I checked for possible demand zone and set a pending order in my mt5 raw account.
Nov 30 2023--> it reacted to my POI (point of interest) . so i wait until my pending order was activated . Indeed it really touched the price im aiming for and then i look for validity and proof of the zone. wyckoff accumulation on 5 min and 15 min tf. (please check chart for reference.
RR: 1:8
1% of capital aiming for 8 % on this trade.
Another great trade and wisdom from GOD. :)
Patience is always the key.

Forex Trading Basics: Charting Your Way to SuccessIntroduction
Forex trading is the practice of buying and selling different currencies to profit from market fluctuations. This financial market is the largest in the world, with an average daily trading volume of $6.6 trillion, making it an attractive arena for traders. In this article, we'll cover some fundamental principles of forex trading, and show you where charts can help you understand and apply these principles.
Forex Trading Principles
Understanding Forex Market:
The Forex market is a decentralized global marketplace where participants buy, sell, exchange, and speculate on the value of different currencies. Currency pairs are traded, such as EUR/USD (Euro/US Dollar) or USD/JPY (US Dollar/Japanese Yen). The first currency in the pair is the base currency, and the second is the quote currency. Understanding how currency pairs are quoted and the concept of exchange rates is essential for Forex trading. Factors that influence the Forex market include economic indicators, geopolitical events, interest rates, inflation, and market sentiment. Traders need to keep abreast of these factors to make informed trading decisions.
Trading Strategy:
A Forex trading strategy provides a systematic approach to navigate the complexities of the market. It helps traders identify entry and exit points, manage trades, and minimize emotional decision-making. Different trading styles, such as day trading (short-term), swing trading (mid-term), and position trading (long-term), require distinct strategies. Some popular Forex trading strategies include trend following, breakout trading, range trading, and carry trading. Traders must align their chosen strategy with their risk tolerance, available time for trading, and personal financial goals.
Risk Management:
Effective risk management is vital to protect your capital and survive in the Forex market. It involves determining the appropriate position size based on your account balance and risk appetite. Setting stop-loss orders is crucial to limit potential losses if a trade goes against you. Additionally, traders should consider setting profit targets to secure gains and practice sound money management principles. Risk management ensures that no single trade or a series of losses can wipe out a substantial portion of your trading account.
Use of Indicators:
Technical indicators are tools used to analyze price charts and identify potential trading opportunities. Fractals, for example, are indicators that highlight potential reversal points in the market. They consist of five consecutive bars, with the middle bar showing the highest (or lowest) price. Traders can use other indicators like Moving Averages, Relative Strength Index (RSI), MACD, and Bollinger Bands, among others. However, it's essential not to rely solely on indicators but to combine them with other forms of analysis and market context for more accurate decision-making.
Applying Charts in Forex Trading
Identifying Patterns:
Forex charts are instrumental in recognizing chart patterns, which are recurring formations that can indicate potential market movements. The 'head and shoulders' pattern showed on the chart below is just one example. Other common patterns include double tops and bottoms, wedges, flags, and pennants. Each pattern has its own implications for price direction and can help traders anticipate trend reversals or continuations. Understanding these patterns and incorporating them into your analysis can significantly improve your trading decisions.
Using Indicators:
Indicators are mathematical calculations based on historical price and volume data, providing additional insights into market trends and potential entry or exit points. Besides fractals, traders often use indicators like Moving Averages, Relative Strength Index (RSI), Moving Average Convergence Divergence (MACD), and Bollinger Bands. These indicators help traders identify overbought or oversold conditions, trend strength, and potential trend changes. However, it's important to use indicators wisely and not overload charts with too many indicators, as it can lead to conflicting signals and confusion.
Determining Entry and Exit Points:
Charts serve as a primary tool for determining optimal entry and exit points for trades. Technical analysis tools, along with support and resistance levels, can guide traders in identifying areas of potential buying or selling interest. By combining technical analysis with their trading strategy, traders can time their entries and exits more effectively, enhancing the risk-reward ratio of their trades.
Risk Management:
Effective risk management is critical in Forex trading, and charts play a significant role in this aspect. By visualizing price movements and key levels on the chart, traders can determine appropriate stop-loss levels to limit potential losses. They can also calculate the position size based on their risk tolerance and the distance between their entry point and stop-loss level. Charts allow traders to assess the risk-reward ratio of a trade before executing it, ensuring they only take trades with favorable risk-to-reward profiles.
Conclusion
In conclusion, achieving success as a Forex trader requires a holistic approach that encompasses several critical elements. Understanding the basic principles of the Forex market sets the foundation for making informed decisions. Recognizing the role of currency pairs, exchange rates, and the factors influencing the market provides a solid framework for effective trading.
Developing a robust trading strategy tailored to your trading style and risk tolerance is paramount. Whether you opt for day trading, swing trading, or position trading, having a well-defined plan will guide your actions and protect you from impulsive decisions driven by emotions.
Charts serve as indispensable tools in Forex trading, enabling traders to visualize market data and identify key patterns and trends. Mastering the art of chart analysis empowers traders to spot potential opportunities, determine entry and exit points, and manage risk effectively.
However, success in Forex trading is not solely reliant on theoretical knowledge and technical skills. Consistency and discipline play a crucial role. Maintaining consistency in your trading approach and adhering to your trading plan even during challenging market conditions can lead to long-term success.
Discipline is essential in curbing the temptation to deviate from your strategy due to fear or greed. Practicing patience and avoiding overtrading are equally vital aspects of maintaining discipline.
Moreover, the Forex market is dynamic and subject to constant change. Staying updated with market trends, economic events, and geopolitical developments is indispensable. Continually refining your trading strategies and adapting to evolving market conditions will keep you ahead of the curve.
Additionally, never forget the importance of risk management. Preserving your trading capital through proper position sizing, setting stop-loss orders, and managing risk prudently is the key to surviving in the Forex market over the long term.
In conclusion, the journey to becoming a successful Forex trader is a continuous process of learning, analyzing, and improving. Embrace a comprehensive approach that combines knowledge, strategy, chart analysis, consistency, discipline, and risk management. By doing so, you position yourself for success in the ever-changing and exciting world of Forex trading.


ICHIMOKU AND RVI BEGINNERS PLAY BOOKNow ichimoku is relatively simple look for buys above the cloud and look for sells under the cloud. so when we backtest that over our 5/5 winners with rvi we get two less entrys, however as a beginner to avoid them whipsaw movements that isnt always a bad thing. The cloud itself offers dynamic support and resistance based of averages. price breaking through the cloud signals a breakout and a change in the trend usually. if new to trading I recommend learning about ichimoku on youtube, its not the all time great plan but if you have no plan its better than that. to keep discipline and entry requirements.

RVI TUTORIAL OIL EXAMPLE 5/5 WINNERSSo I am going to breakdown an indicator that I have featured alot in my trades, so if we look at the crude oil chart here, we can see that in total we have 5 notable crosses of the rvi indicator, 3 bearish trades and 2 bullish trades for a total of 510 pips, 5 winners out of 5. Now the magic of the indicator is that it is both an entry signal and an exit signal, enter on cross exit on cross to maintain maximum pips. Personally i find relative vigor index very useful when used in conjunction with good trading ideas and good structure analysis.
