BTCUSD SURELY DOWN Counter-Analysis (Disrupting the Bearish Outlook)
Bullish Continuation Instead of Rejection
If BTC breaks through the resistance zone near $87,792 instead of reversing, it could aim for $92,305 or higher.
A breakout with strong volume could lead to a new uptrend rather than a drop.
Strong Demand at Support Levels
The suggested bearish drop assumes that support levels will fail, but BTC could see significant buying pressure around $78,000–$74,000.
If buyers step in aggressively, the price may consolidate and push higher rather than continue downward.
Higher Low Formation Instead of Breakdown
The chart suggests BTC will drop below $70,000, but if it forms a higher low above $75,000, it could confirm an uptrend instead.
Trendline support or moving averages could prevent a deep correction.
Fundamental Factors Supporting BTC
Macroeconomic conditions, ETF inflows, or institutional demand could prevent a major sell-off.
If the Federal Reserve signals dovish policies, BTC could stay strong rather than droP
Forexlivesignal

xauusd sell now big down soonAlternative Disruptive Perspectives:
Bullish Continuation Instead of Reversal:
The current analysis suggests a drop after hitting resistance, but gold might break through resistance instead of reversing.
If gold sustains above $2,941 and breaks $2,992, it could target $3,020+ instead of falling.
A breakout confirmation would invalidate the bearish scenario.
Support Levels May Hold Stronger:
The projected decline assumes a clean break of key supports, but buyers may step in around $2,860 or $2,800, leading to a rebound.
If price action forms higher lows instead of lower lows, the bearish outlook weakens.
Fundamental Catalysts Could Favor Bulls:
Macroeconomic factors like inflation data, Fed policies, or geopolitical tensions might support gold prices instead of pushing them down.
A weakening dollar or dovish Fed stance could fuel further buying momentum.
Trend Structure Still Bullish:
The higher-timeframe trend remains intact, meaning that even if there’s a pullback, it could just be a correction before further upside

XAUUSD long term 1. Weakness at Support Zone (Bearish Risk)
The price is hovering around the identified demand zone (blue box), but buyers are not showing strong defense yet. If this zone breaks, we could see a deeper correction toward $2,840 - $2,800, invalidating the bullish projection.
The dotted red line suggesting an immediate bounce might be premature without a bullish confirmation candle or volume spike.
2. Trendline Breach (Bearish Confirmation)
The ascending trendline (starting from February lows) has already been broken and retested. This typically signals a trend reversal or deeper pullback.
If price remains below this trendline, the bullish continuation becomes less probable.
3. Possible Bear Flag Formation (Bearish Pattern)
The recent sideways action (consolidation within the demand zone) could be forming a bear flag, which is a continuation pattern for a move down.
A breakdown below $2,860 (flag bottom) would confirm this bearish pattern, targeting potentially $2,800 or lower.
4. Momentum Shift
RSI/MACD (if checked) may show bearish divergence from recent highs or weakening momentum, suggesting buyers are losing control.
Alternative Bearish Scenario (Disruption Path):
If price breaks and closes below $2,860 - $2,840:
Short-term target: $2,800 - $2,760.
Invalidates bullish target of $3,000 for now

XAUUSD BUY NOW this week big movement gold strongly bullish soonThanks for the clarification. Based on the chart you provided and the bullish bias toward the resistance target of 2950, here’s a "disruption" or alternative analysis—a contrarian scenario that challenges the bullish view:
Bearish Disruption Analysis:
1. False Breakout & Rejection Scenario:
Current price hovering around 2910.795 shows a struggle to break higher.
Price previously failed to sustain above the minor resistance zone near 2918–2920, showing rejection wicks.
This may indicate buying exhaustion, and if no fresh momentum comes in, price could reverse.
2. Support Weakening:
The 2906 support zone has already been tested multiple times.
Each retest of this support weakens the buyers' defense.
A break and close below 2906 would open doors to deeper pullbacks — potential targets:
First target: 2895 (psychological and historical intraday support).
Extended target: 2880–2885 zone.
3. Volume Divergence:
Noticeable reduction in buying volume on recent attempts to move higher.
Without increasing volume, it's hard for price to break out toward 2950.
4. Potential Bearish Formation:
Formation of a lower high pattern, suggesting a potential trend reversal from bullish to bearish in this short-term timeframe (H1)

GBPJPY STRONG BULLISH OPPORTUNITY 1. Range-Bound Market Assumption
The analysis assumes that price is bouncing between a horizontal range (support and resistance).
However, ranges don’t last forever—a breakout or breakdown is inevitable.
Instead of expecting a structured bounce, a fake breakout or a liquidity grab could occur.
2. Support Zone Over-Reliance
The expectation of multiple support bounces is risky because:
The more times price tests support, the weaker it becomes.
A stop hunt scenario could push price below support before reversing.
If buyers don’t step in with strong momentum, a breakdown might be more likely than the predicted bullish move.
3. Resistance Breakout Bias
The projection shows a clean breakout above resistance after consolidation.
However, GBP/JPY is highly volatile, meaning:
A fakeout above resistance could trap buyers before reversing.
A rejection at resistance might cause a sharp drop instead of a rally.
4. Missing Volume & Trend Confirmation
No volume analysis is provided—breakouts need high volume for confirmation.
No higher time frame confirmation (1H, 4H) is shown, making it unclear whether the trend is truly bullish or just ranging.
Alternative View
Instead of assuming a smooth upward breakout, consider:
Bearish Scenario: A false breakout above resistance followed by a strong reversal.
Liquidity Grab: A dip below support before an actual reversal.
Wait for confirmation: If price closes above resistance with volume, a buying opportunity is stronger

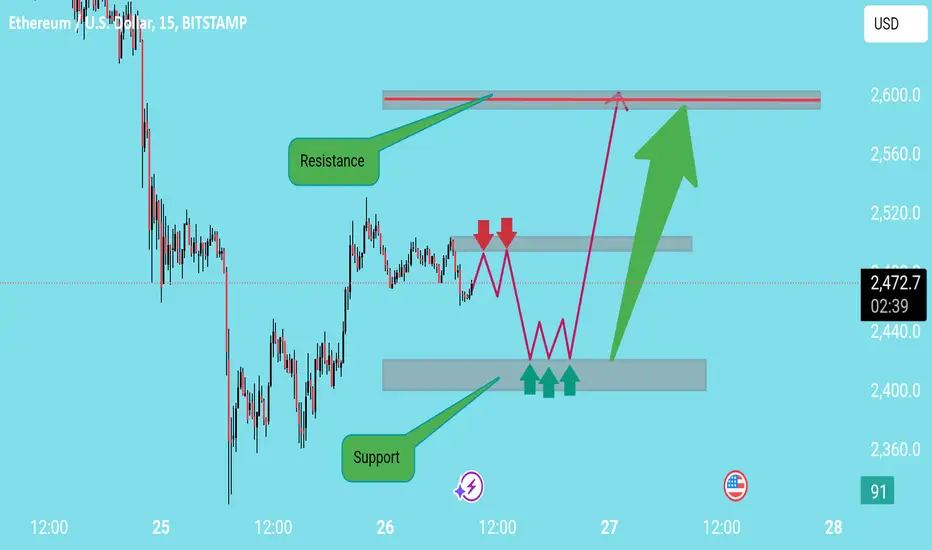
ETHUSD surely analysis 1. Support and Resistance Reliability
The analysis assumes a strong support zone at the lower level and a firm resistance at the top.
However, support and resistance levels are not static—they can be invalidated if momentum is strong
If the price revisits support too many times, it could break down instead of bouncing.
2. Repetitive Range-Bound Expectation
The chart predicts multiple rejections at the middle resistance before a breakout.
Markets don’t always behave in such a predictable pattern—sideways action could lead to a sudden breakdown instead of a breakout.
3. Lack of Volume & Trend Confirmation
There's no volume analysis to confirm if support and resistance levels are strong.
A higher time frame (1H or 4H) analysis would help validate if this is just consolidation or a genuine trend reversal.
4. Breakout vs. Fakeout Possibility
The projection assumes a clean breakout above resistance.
However, many breakouts turn into fakeouts, where price moves above resistance, traps buyers, and then reverses sharply.
A liquidity grab above resistance could lead to a drop instead of a rally.
Alternative Perspective
Instead of assuming a clear upward movement, consider two scenarios:
1. Bullish Case: If volume supports the breakout, enter after a successful retest of resistance as support.
2. Bearish Case: If the breakout fails (fakeout), expect a retest and breakdown, leading to a lower support level
XAUUSDHello traders ,what do you think about GOLD? After the sharp price growth on Monday, which was a false breakout, gold quickly returned below the broken zone and fell to the 2010 zone. It is currently trading below the resistance zone of 2050, which is expected to fall to the specified zone after the completion the pullback to the resistance zone . Today, ADP data can be the driving factor for gold.
If this post was useful to you, do not forget to like and comment.❤️

Overcoming Anxiety & FOMOMy next trade setup on NZDCAD is only based off of me seeing clearly after experiencing FOMO and Anxiety.
I pray Tradingview allows this type of conversation to happen because I truly feel like we don't talk about anxiety and Fomo enough in a spiritual manner.
If this resonates with you, please share how it helps you by commenting below. Don't forget to like the video as well.
Many thanks for watching this video. Thank you.
My trade idea on NZDCAD:
I'm awaiting for the daily candle closure. If it's bullish I'm buying back up to the -0.27 Fiboncaci Level
-Shaquan

sell xauusdgold pulled back to 2029 after the dropp during NFP last week. and the pull back to 2029 gave me confirmation, for continuation for the sell.

USDCHF| New Low, New Trade SetupYesterday, USDCHD made a new lower low. This is known as a trend continuation. I love trades like this. They are what I call, pretty areas because it's easy to money trading with the trend(my personal opinion).
So, I'm going setting up my new setup for a sell. You'll see me set my sell up in this video.
If you find video in this analysis please like the video and comment your key takeaway or questions if you have any.
Enjoy😍
Shaquan

Not Holding Your Trades? Chill & Watch ThisIf you want to hold trades longer to show off your swing trading skills rather it be the forex, crypto, or stock market, do these 3 things:
1. Eliminate time factor
2. Want to hold the trade
3. Set it and forget it
If you're not there yet its ok. Just start with holding 1 trade. It's worth it.

Teaching My Son How To Trade USDJPYIt's such an amazing joy that my son wants to learn how to trade. He sat by me this morning said, " mom I see higher highs and higher lows." We conversed a bit and this is our conversation from this morning.
I am a forex mom who loves trading. I love my children more. This is a skill that I'm grateful to pass down to them. I pray you do the same.

How to Analyze The Monthly Timeframe on USDCADHey Purpose Traders. As you know I am a swing trader. Being a swing trader means I am analyzing the higher timeframes such as the monthly, weekly, and daily, to find my trade setups. In this video, I am showing you how I'm analyzing USDCAD to find my next entry.
If you have any questions, I'd love to see them in the comments below so I can answer them. Remember to be kind and enjoy your summer trading.

GBPUSD SHORT SWING TRADE. Technical AnalysisOkay, Out DXY is at Weekly support, and Pound is at Weekly Resistance. This is our typical Textbook setup so I'll advise you to put your RISK OFF. And by that I mean we're putting our cash on the dollar. We're still risking one percent of our Account with a 25 or 30 pip stop. Entry at 1.36137. This setup has the possibility to be our weekly high, and if that's so, We'll be looking for ways to short this coming week, until we get to the monthly support at 1.34815.
Trade smartly!
Thank you for reading!
If you have a remark, feel free to drop a comment!
Follow our channel and Like this post, if you find this useful!

SPXUSD SELLSPXUSD H1 CHART
Hello Traders 👋If you find this analysis useful, please support me with your likes and comments.
If you have another analysis at this pair, please share in comments, I will be glad to discuss with you.

NZDUSD SELLNZDUSD H4 CHART
Hello Traders 👋If you find this analysis useful, please support me with your likes and comments.
If you have another analysis at this pair, please share in comments, I will be glad to discuss with you.

SILVER BUYSILVER DAILY CHART
Hello Traders 👋If you find this analysis useful, please support me with your likes and comments.
If you have another analysis at this pair, please share in comments, I will be glad to discuss with you.

SPXUSD SELLSPXUSD H4 CHART
Hello Traders 👋If you find this analysis useful, please support me with your likes and comments.
If you have another analysis at this pair, please share in comments, I will be glad to discuss with you.

LTCUSD BUYLTCUSD H4 CHART
Hello Traders 👋If you find this analysis useful, please support me with your likes and comments.
If you have another analysis at this pair, please share in comments, I will be glad to discuss with you.

EURUSD SELLEURUSD H4 CHART
Thank you very much that you support me with your likes and Comments
If you have another analysis at this pair, please share in comments, I will be glad to discuss with you.

GBPUSD SELLGBPUSD H4 CHART
PS: Thank you very much that you support me with your likes and Comments
If you have another analysis at this pair, please share in comments, I will be glad to discuss with you.

EURCAD SELLEURCAD H4 CHART
PS: Thank you very much that you support me with your likes and Comments
If you have another analysis at this pair, please share in comments, I will be glad to discuss with you.

USDCHF BUYUSDCHF H4 CHART
PS: Thank you very much that you support me with your likes and Comments
If you have another analysis at this pair, please share in comments, I will be glad to discuss with you.
