NZD/JPY: Bearish Breakdown from Ascending ChannelNZD/JPY has decisively broken below its ascending channel, signaling a shift from bullish structure to bearish momentum. This move aligns with fundamental headwinds for NZD and the potential for JPY strength amid intervention risks and global risk-off sentiment.
Technical Analysis (4H Chart)
Pattern: Breakout from ascending channel support confirms a bearish reversal.
Current Level: 87.12, trading below the broken trendline with strong selling pressure.
Key Support Levels:
86.00 – first bearish target and immediate support zone.
84.60 – extended bearish target if momentum continues.
Resistance Levels:
88.04 – previous support turned resistance.
89.06 – upper boundary and invalidation zone for bearish bias.
Projection: Price is expected to retest 86.00, and if broken, further decline toward 84.60 is likely.
Fundamental Analysis
Bias: Bearish.
Key Fundamentals:
NZD: Pressured by global tariffs and risk-off sentiment.
JPY: Supported by potential FX intervention from Japan’s Ministry of Finance and safe-haven demand.
US Data Impact: Weak NFP boosted Fed cut bets, but risk-off flows strengthen JPY against risk currencies like NZD.
Risks:
China stimulus or a risk-on shift could lift NZD.
Lack of BOJ action may weaken JPY temporarily.
Key Events:
RBNZ policy outlook.
BOJ comments or intervention signals.
US CPI influencing global risk sentiment.
Leader/Lagger Dynamics
NZD/JPY is a lagger, reacting to risk sentiment and JPY moves, with JPY strength leading the pair lower.
Summary: Bias and Watchpoints
NZD/JPY is bearish, with a clear technical break from its ascending channel. The pair targets 86.00 initially and 84.60 on extended downside. Key watchpoints include BOJ FX policy, RBNZ stance, and global risk sentiment, especially if markets move deeper into risk-off mode.
Forexmarket
Economic Factors That May Affect the Forex MarketEconomic Factors That Affect the Forex Market
The foreign exchange market is influenced by a wide range of economic factors which have a significant impact on currency exchange rates. Knowing about these factors is crucial for anyone looking to trade in the forex market, as they can help analyse price movements.
This article explores some key factors that may affect the forex market and lead to changes in the rates of currency pairs. You’ll learn about the influence of macroeconomic statistics, capital markets, economic data, and more. These factors collectively contribute to the volatility and dynamics of the forex market.
Economic Factors
These economic factors interact with each other in complex ways, and forex traders use a combination of analysis and research to make informed trading decisions. Understanding how these factors impact currency movements is essential for participants in the forex market.
Economic Health
Macroeconomic statistics fall into a category of factors affecting the currency market. The term refers to a set of main indicators that provide insights into the overall performance and health of an economy. These are GDP data, unemployment rates, trade and current account balances, interest rates, and inflation data. Countries with strong economic indicators are typically more attractive to foreign investors. This leads to an appreciation of their currencies. On the contrary, poor economic performance can lead to a decline in a country’s currency value.
Central Bank Policies
Central bank monetary policy decisions, including quantitative easing, forward guidance, and open market operations, can have a direct impact on a country's currency. Announcements and statements by central bank officials are closely monitored by forex traders.
Interest rates are among the most popular central bank tools. Central banks around the world set and regularly change them, and these rates have a direct impact on the value of a country’s currency. In most cases, higher interest rates attract foreign investment. The increased demand for the currency can cause its value to appreciate. In contrast, lower interest rates can lead to a decrease in the value of a currency as investors seek higher returns elsewhere.
The Influence of the Capital Markets
One of the factors affecting the foreign exchange market that we should remember is the influence of the capital markets. Commodity, stock, bond, and other markets also have a strong influence on exchange rates. To illustrate, when a country experiences a rise or sell-off in securities, this may indicate a change in its economic outlook. This typically affects investor sentiment and capital flows.
Traders try to stay updated to apply the most efficient strategy and avoid large losses. They can learn about these events through various sources, including news outlets, financial websites, and even trading platform blogs and news sections.
Imports and Exports
Other significant factors that affect forex trading are imports and exports. When a country’s exports exceed imports, a trade surplus occurs, which strengthens the economy and causes the value of the currency to rise. This happens because foreign consumers buy foreign currency to purchase exported goods. Conversely, when imports exceed exports, a trade deficit occurs, and the country is forced to sell its currency to buy imported goods. This may lead to a decline in the value of the domestic currency.
Government Debt
Government debt is not necessarily a bad thing; however, a government with high debt may find it more difficult to obtain foreign capital if it isn’t seen as reliable by investors. Conversely, a government with low debt and a history of not defaulting is likely to be considered more stable, which can positively impact its currency value. Traders can find information on government debt in financial news outlets, on economic research websites, and in other national sources.
Trade-Weighted Index
A Trade-Weighted Index (TWI) is a measure used in international economics and finance to assess the relative strength or value of a country's currency against a basket of other currencies. Unlike a simple exchange rate, which reflects the value of one currency in terms of another, a Trade-Weighted Index takes into account a country's trade relationships with multiple trading partners.
A Trade-Weighted Index provides a more comprehensive view of a country's currency value because it considers the impact of its trade relationships with multiple partners. It is particularly useful for countries heavily involved in international trade and can be used by policymakers, investors, and economists to gauge currency competitiveness and evaluate the potential impact of currency movements on a country's trade balance.
Final Thoughts
Experienced traders carefully consider factors influencing the forex market and explore their potential impact on exchange rates. It is critical to note that these economic factors do not operate in isolation, and their impact on the forex market can be complex. For example, while high interest rates may attract foreign investment in a certain country and cause its currency to appreciate, they can also lead to decreased consumer spending and economic slowdown, which may ultimately lead to a depreciation of the currency.
Often, traders rely on both economic indicators and technical analysis tools, considering previous price movements in the market. They can compare historical quotes of currency pairs and track what news or indicators were associated with the changes.
This article represents the opinion of the Companies operating under the FXOpen brand only. It is not to be construed as an offer, solicitation, or recommendation with respect to products and services provided by the Companies operating under the FXOpen brand, nor is it to be considered financial advice.
U.S. Dollar Index (DXY) – 15M Chart Analysis | Aug 8, 20251. Market Structure:
DXY is trading in a short-term range between 98.471 resistance and 97.952 support, following a sharp downtrend from the 99.072 high.
2. Supply Zone Pressure:
The 98.471 level acts as a strong intraday supply, repeatedly rejecting price and limiting bullish momentum.
3. Demand Zone Cushion:
The 97.952 level is holding as immediate support. Below that, the yellow zone around 97.60–97.45 is a major demand area where buyers may step in.
4. Momentum Bias:
Lower highs from the recent peaks signal ongoing bearish pressure. Short-term rallies are getting sold into, suggesting sellers control the market.
5. Next Move:
Bullish: Break above 98.471 opens path to 98.829–99.072 .
Bearish: Break below 97.952 targets the 97.60–97.45 demand zone.
GBPNZD Breakout from Consolidation Bullish Momentum BuildingGBPNZD has broken out of its recent consolidation pattern and is showing signs of bullish continuation. Strong GBP fundamentals combined with NZD weakness from global risk-off sentiment and tariffs support this technical move.
Technical Analysis (4H Chart)
Pattern: Breakout from a descending channel with bullish follow-through.
Current Level: 2.2418, trading above the breakout level, confirming momentum shift.
Key Support Levels:
2.2294 – recent breakout support and invalidation point for bulls.
2.2222 – secondary support if a deeper pullback occurs.
Resistance Levels:
2.2500 – near-term resistance and potential target for the breakout.
2.2690 – extended bullish target if momentum continues.
Projection: Likely to continue higher toward 2.2500, with room for 2.2690 if GBP strength persists.
Fundamental Analysis
Bias: Bullish.
Key Fundamentals:
GBP: Supported by BOE’s cautious stance on inflation and the relative resilience of the UK economy.
NZD: Pressured by global tariffs, weaker risk sentiment, and limited domestic growth catalysts.
USD Factor: Fed rate cut expectations indirectly support GBP crosses against risk currencies like NZD.
Risks:
Hawkish surprise from RBNZ could strengthen NZD.
BOE dovish signals could stall GBP upside.
Key Events:
BOE meeting and UK CPI.
RBNZ policy decision.
Risk sentiment trends globally.
Leader/Lagger Dynamics
GBP/NZD is a leader among GBP crosses, with GBP strength and NZD weakness driving momentum. It also aligns with EUR/NZD upside moves, reinforcing the bearish NZD outlook.
Summary: Bias and Watchpoints
GBP/NZD is bullish, having broken consolidation with upside targets at 2.2500 and 2.2690. The main drivers are GBP’s policy support, NZD’s risk-off weakness, and global tariff concerns. Watch for BOE and RBNZ updates as potential volatility triggers.
Forex Market Structure and Factors Affecting ItForex Market Structure and Factors Affecting It
The forex market, a vast and dynamic financial arena, operates uniquely as a decentralised over-the-counter network. This article delves into its intricate structure, exploring the roles of various participants and the influence of technology. Understanding these elements is essential for anyone looking to navigate and succeed in the world of forex trading.
Understanding Market Structure in Forex
The structure of the foreign exchange market, commonly known as the forex market, is uniquely decentralised and operates over-the-counter (OTC). Unlike traditional markets with a central exchange, forex is a vast network of dealers, brokers, and financial institutions globally. This setup allows for 24-hour trading five days a week, accommodating various time zones and providing constant access to market participants.
Each participant plays a pivotal role in shaping the basic market structure of forex, with banks and financial institutions primarily acting as market makers, providing liquidity and setting prices for retail traders and brokers. This complex web of interactions and the decentralised nature of the market ensure constant movement in currency values, offering numerous opportunities for trading and speculation.
Participants in the Forex Market
In the diverse landscape of forex trading, the structure is made up of a range of participants. Each group influences the market's dynamics in unique ways:
- Central Banks and Governments: They regulate monetary policies and currency supply, impacting prices. For example, the US Federal Reserve significantly influences the value of the US dollar.
- Commercial Banks: As intermediaries, they facilitate transactions and engage in speculative trading, contributing to liquidity.
- Multinational Corporations: Involved in cross-border transactions, these entities engage in trading to manage currency risks.
- Retail Traders: Individual traders speculate on currency movements using online platforms, forming a significant market portion.
- Institutional Traders: Entities like hedge funds and asset management firms, which trade with sophisticated strategies and considerable resources.
Market Tiers and Interactions
The forex market's structure is defined by distinct tiers and interactions among its participants. Each tier plays a unique role:
- Tier 1: Major Players - This top tier includes large banks, financial institutions, and central banks. They have the most significant impact on market dynamics, often setting trends and liquidity standards.
- Tier 2: Intermediaries - Comprising smaller banks and financial firms, they serve as intermediaries, facilitating transactions and linking Tier 1 entities with smaller participants.
- Tier 3: Retail Market - At this level are individual investors, small businesses, and retail traders. They interact with the market primarily through brokers and online platforms, influenced heavily by the actions of the upper tiers.
These tiers illustrate the varied types of market structure in forex, reflecting the complexity and diversity of trading interactions.
Central Bank's Role in Market Structure
Central banks play a pivotal role in shaping the advanced market structure in forex. They influence the market through several key mechanisms:
- Monetary Policy: Central banks determine monetary policy, which directly influences interest rates. This, in turn, affects the attractiveness of a country's currency, thereby impacting forex rates and market dynamics.
- Market Stabilisation: In times of volatility, central banks can intervene in currency markets to stabilise currencies. Interventions involve buying or selling their own currency to influence exchange rates, directly affecting market structure.
- Regulatory Oversight: Central banks often have a regulatory role, overseeing banking and financial systems. Their regulations can influence accessibility, liquidity, and transparency, which are critical for a well-functioning forex market.
- Economic Signalling: Central banks release economic data and policy decisions that serve as key indicators for traders. This information can lead to anticipatory moves in the markets, shaping prices based on perceived economic strength or weakness.
- Foreign Exchange Reserves Management: Central banks manage significant foreign exchange reserves. Their strategies in managing these reserves, including decisions on when and how much to buy or sell, have a substantial impact on forex liquidity.
Technology’s Impact on Market Structure
Technological advancements have significantly reshaped the market structure in forex, introducing new dynamics and efficiencies. Electronic trading platforms, like electronic communication networks (ECNs), have revolutionised access to the forex market. Before these platforms, trades were often executed via traditional methods like phone calls.
Algorithmic trading uses computer programs for automatic trade execution, enabling fast, consistent transactions. High-frequency trading (HFT), a subset of algorithmic trading, executes thousands of trades per second, enhancing liquidity and reducing transaction costs but also raising concerns about market stability.
Furthermore, big data and analytics allow traders to analyse large datasets for price trends, refining their strategies. Mobile trading has democratised access, enabling trading from virtually anywhere, which has increased competition among brokers and accessibility for retail traders. These technological developments have increased efficiency and accessibility, contributing to a more interconnected and dynamic market.
The Bottom Line
Understanding the forex market structure is crucial for successful trading. This decentralised OTC network thrives on the interactions among various participants, influenced by central banks' policies and technological advancements. As traders navigate this dynamic environment, the right tools and knowledge are key.
This article represents the opinion of the Companies operating under the FXOpen brand only. It is not to be construed as an offer, solicitation, or recommendation with respect to products and services provided by the Companies operating under the FXOpen brand, nor is it to be considered financial advice.
Gold Retraces to OTE and Breaks ResistanceEyes on Swing Highs!Gold Market Update
The gold market declined from its previous bullish leg and retraced below the 50% level, reaching into the Optimal Trade Entry (OTE) zone. It also tapped into a Bullish Price Rejection (BPR) area. Following that, price broke above the trendline resistance. Currently, it is advisable to wait for a potential retest of the breakout level. If confirmed, the market could continue its upward movement toward the previous swing highs.
Do Your Own Research (DYOR)
EUR/USD Market Analysis (4H Timeframe)In this analysis of the EUR/USD currency pair, I have meticulously identified key market zones and potential price movements:
Resistance Zone (1.1800 - 1.1850):
A critical level where previous upward momentum faced rejection, indicating strong selling pressure.
Support Zone (1.1400 - 1.1450):
A solid base where buyers have historically stepped in, preventing further decline.
Fair Value Gaps (FVG):
Lower FVG (1.1450 - 1.1500): The market is expected to fill this imbalance first as part of its natural price action.
Upper FVG (1.1650 - 1.1700): Once the lower gap is filled, the price is likely to push upward to fill this imbalance.
Projected Movement:
The price is currently consolidating, suggesting a potential downward move to fill the lower FVG. Following that, a bullish surge toward the upper FVG is anticipated.
By leveraging these insights, traders can strategically position themselves for optimal entry and exit points.
EUR/NZD - Triangle Breakdown In PlayThe EUR/NZD pair has formed a classic Triangle Pattern on the 1H timeframe, indicating a period of consolidation before a potential breakout.
🔎 Key Technical Insights:
Price is compressing within the triangle, showing lower highs and higher lows.
Bearish bias is anticipated as price approaches the apex, suggesting a potential breakout to the downside.
Break below the triangle support opens the door for a move toward the target zone near 1.9425.
Resistance remains firm at 1.9619, capping bullish attempts.
🎯 Target Point: 1.9425
This aligns with previous structure and projected move size from the triangle’s base.
📌 Watch For:
Clear bearish breakout candle below triangle
Volume confirmation or follow-through momentum
This setup offers a solid opportunity for traders watching for continuation patterns and breakout plays.
GBPUSD: Bearish Momentum vs. Fundamental Repricing – Key LevelsGBPUSD is at a critical juncture, balancing a clear technical breakdown with a fundamental backdrop favoring near-term volatility. The pair has slipped from its rising wedge structure and is now testing key retracement zones while markets reprice expectations for Fed rate cuts after weak US jobs data. Traders are closely watching whether this bearish momentum will extend toward the 1.3128 support or if a rebound from oversold conditions could trigger a corrective bounce.
Technical Analysis (8H Chart)
Pattern: Clear breakdown from a rising wedge, confirming bearish bias.
Current Level: Price sits near 1.3278, struggling to reclaim the 1.3300 resistance zone.
Key Support Zones:
1.3128 (61.8% Fibonacci retracement) – main bearish target.
1.2945 (78.6% retracement) – extended downside target if selling pressure deepens.
Resistance Levels:
1.3300 (immediate resistance, prior support now flipped).
1.3380 (secondary resistance if a retracement rally occurs).
Projection: Likely bearish continuation toward 1.3128, with a potential retest of 1.3300 before continuation.
Fundamental Analysis
Bias: Bearish in the short term, but Fed policy and risk sentiment remain key drivers.
Key Fundamentals:
USD: Weak NFP (73K), higher unemployment (4.2%), and downward revisions boost Fed cut bets (~75% for September), typically a USD-negative factor.
GBP: BOE maintains a cautious stance due to sticky inflation but lacks clear hawkish conviction as growth slows.
Tariffs: US tariffs add a mild negative weight on GBP trade sentiment.
Risks:
Hot US CPI could slow Fed cut bets, supporting USD.
Hawkish BOE comments could limit GBP downside.
Global risk sentiment shifts could either favor USD (risk-off) or weaken it further (risk-on).
Key Events:
US CPI and PPI for USD direction.
BOE policy updates and UK CPI.
US jobless claims and Fed commentary.
Leader/Lagger Dynamics
GBP/USD is a lagger, mainly reacting to USD shifts. However, its moves directly influence GBP crosses such as GBP/JPY and GBP/CHF.
Summary: Bias and Watchpoints
GBP/USD remains in a bearish phase, targeting 1.3128 with a potential corrective bounce toward 1.3300 first. The primary driver is the technical breakdown, while fundamentals add volatility around US CPI and BOE policy. If CPI surprises lower, the bearish outlook could reverse into a short-term rebound; if CPI is hot, downside momentum could extend. You should monitor USD-driven events closely as GBP/USD sets the tone for broader GBP movements.
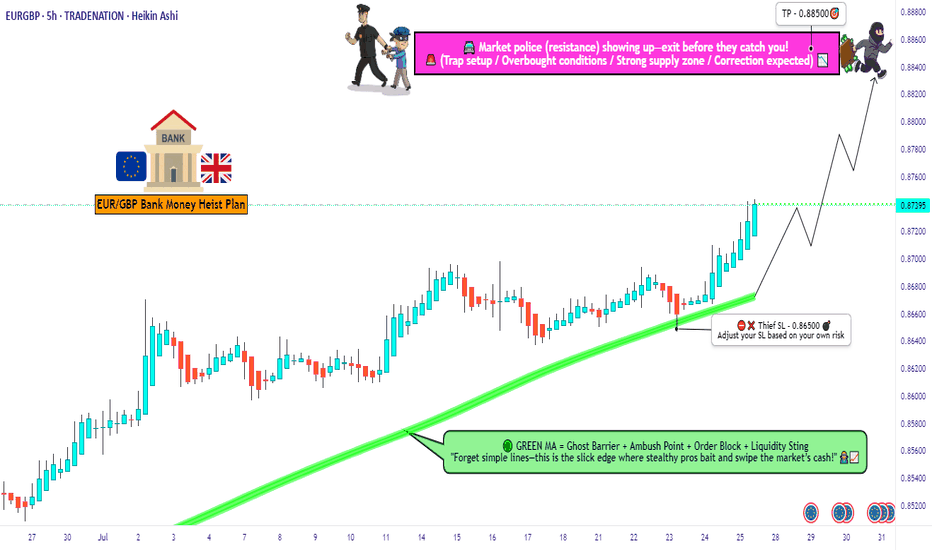
EUR/GBP Thief Trade: Swipe Profits Before Overbought Trap!🦹♂️ EUR/GBP "THE CHUNNEL HEIST" – BULLISH LOOT IN PROGRESS! 🚨💰
(Thief Trading Strategy – Escape Before the Cops Arrive!)
🎯 DEAR MARKET PIRATES & PROFIT SNATCHERS,
Based on our 🔥Thief Trading Style Analysis🔥, we’re executing a bullish heist on EUR/GBP ("The Chunnel"). The vault is wide open—time to swipe the loot before the high-risk resistance police barricade (aka overbought trap) shuts us down!
📜 THE MASTER PLAN:
✔ Entry (📈): "The Bullish Vault is Unlocked!"
Buy Limit Orders (15-30min TF) near recent swing lows/highs.
Thief’s DCA Trick: Layer entries like a pro robber—multiple limit orders for max loot.
✔ Stop Loss (🛑): "Hide Your Stash Wisely!"
SL at nearest 4H candle wick (0.86500)—adjust based on your risk appetite & lot size.
Remember: A good thief always has an escape route!
✔ Target (🎯): 0.88500 (or escape earlier if the cops get suspicious!)
🔎 SCALPERS & SWING BANDITS – LISTEN UP!
Scalpers: Stick to LONG-ONLY heists! Use trailing SL to protect profits.
Swing Thieves: If you’re low on cash, join the slow robbery—DCA & hold!
📡 WHY THIS HEIST IS HOT:
Bullish momentum in play (but BEWARE of overbought traps!).
Fundamental Drivers: Check COT Reports, Macro Data, & Sentiment.
🚨 TRADING ALERT: NEWS = POLICE RAID RISK!
Avoid new trades during high-impact news.
Trailing SL = Your Getaway Car! Lock profits before volatility strikes.
💥 BOOST THIS HEIST – STRENGTHEN THE GANG!
👉 Smash the LIKE & BOOST button to fuel our next market robbery!
👉 Follow for more heists—profit awaits! 🚀💰
🦹♂️ Stay Sharp, Stay Ruthless… See You on the Next Heist!
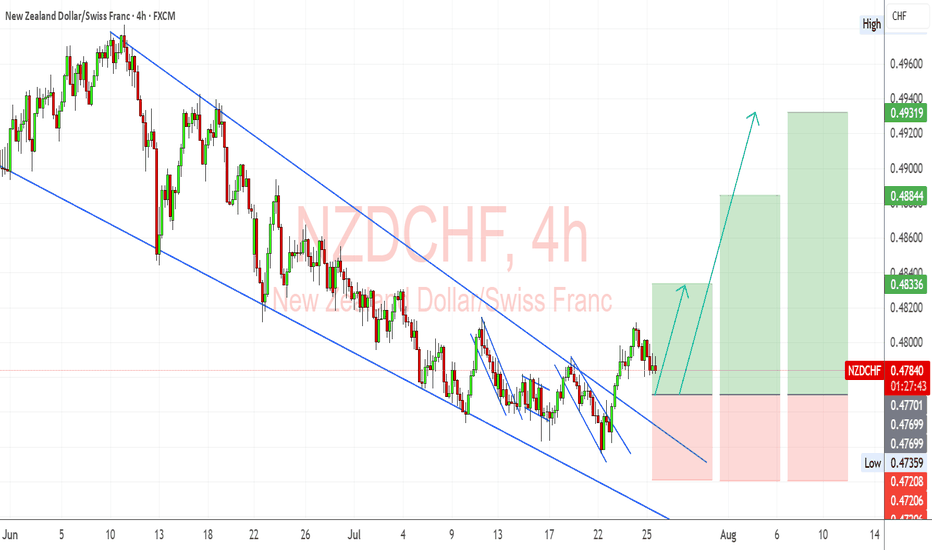
NZDCHF – Bullish Breakout Sets Stage for ReversalNZDCHF has broken decisively out of a long-term descending channel, signaling a potential trend reversal. Price action confirmed multiple bullish flags within the falling structure, followed by a clean breakout and higher low retest, supporting a bullish continuation bias.
Currently, the pair is stabilizing just above prior resistance turned support around 0.4760–0.4780, forming a potential launchpad for the next leg higher.
Upside Targets:
TP1: 0.48336
TP2: 0.48844
TP3: 0.49319
Invalidation Zone:
A drop below 0.4720 would invalidate the breakout structure and expose the downside.
Fundamental Drivers:
🇳🇿 NZD Strength: RBNZ remains relatively hawkish compared to other central banks, and the Kiwi may gain from improving risk sentiment and easing global recession fears.
🇨🇭 CHF Weakness: Swiss Franc is under mild pressure as safe-haven flows weaken amid improving tone on US-China-EU trade headlines and fading ECB rate cut bets.
🗓️ Macro Flow: Upcoming risk events (Fed comments, trade updates, and NZ economic prints) could inject momentum into the pair, especially if risk appetite improves.
Bias: ✅ Bullish (Buy)
Confidence: ★★★★☆
Watch for: Clean hold above 0.4770 zone + bullish momentum continuation.
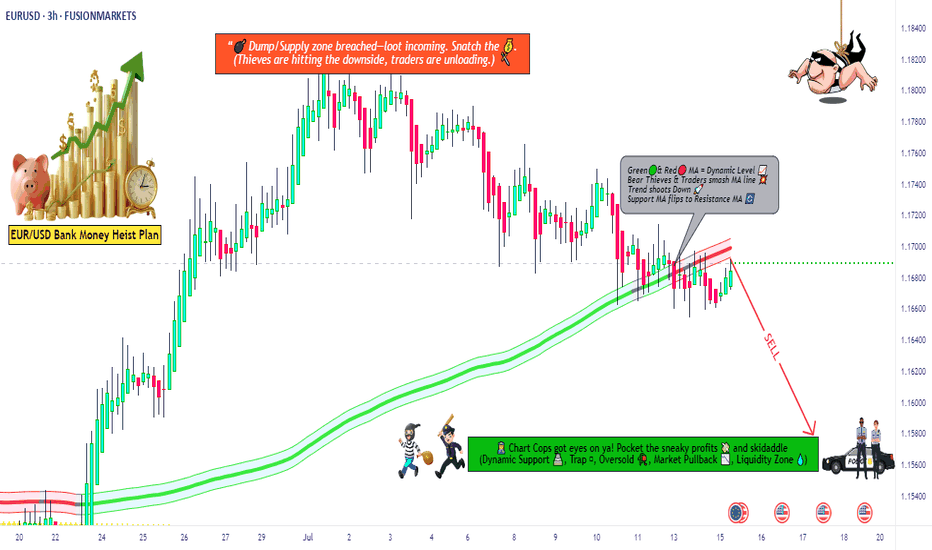
EUR/USD Robbery Blueprint Bear Strike Activated!💣🎯Operation Fiber Down: EUR/USD Robbery Blueprint (Day Trade Edition) 💰🔫
🚨 Thieves, Hustlers & Chart Bandits Assemble! 🚨
🌍 Hi! Hola! Ola! Bonjour! Hallo! Marhaba! 🌍
Welcome back to another Thief Trading Operation, where the money never sleeps—and neither do we. Let’s break into the vault of EUR/USD “The Fiber” with surgical precision. 🧠💼🕶️
🧨 THE MASTER ROBBERY PLAN: EUR/USD SHORT STRIKE 🔍💸
💀 Market Bias: Bearish – Trend Reversal + Supply Trap Setup
🎯 Target: 1.15800
🛑 Stop-Loss: Near Swing High (around 1.17400 – 3H chart view)
🕓 Timeframe Focus: 15m / 30m / 3H
🧭 ENTRY ZONE:
👣 Plan your entry from recent high retests—that’s where the big money bulls get trapped.
🎯 Use Sell Limit Orders (DCA style / Layered Limit Orders) like a true thief setting up tripwires.
💼 RISK STRATEGY:
💡 SL should match your lot size and order count—not one-size-fits-all!
📌 Place above key structure or swing level (e.g. 1.17400) based on timeframe.
🔍 BEHIND THE SCENES – THE WHY:
The EUR/USD "Fiber" pair is showing all the classic signs of a trend shift and bear raid setup, including:
📰 Fundamentals weakening the Euro
💣 COT Report reveals institutional exits
🍂 Seasonal Bias points to downward trend
📉 Intermarket Pressure from bond yields & USD strength
📊 Sentiment turning overly bullish = trap zone
⛽ Storage & Inventory imbalances adding fuel
📌 Reminder: Before any robbery, study the layout—Macro, Fundamentals, Sentiment, and Intermarket are your blueprint.
🚨 HEIST ALERT – PROTECT THE LOOT:
🕰️ High-Impact News Events? Tighten up!
💼 Don’t take fresh entries during releases.
🔐 Use Trailing SLs to lock in profits.
🎯 Exit with grace before the sirens start.
⚡🔥JOIN THE CREW, BOOST THE LOOT🔥⚡
💥 Smash the Boost Button 💥 if you're vibing with the Thief Trading Movement.
We ain’t just trading—we’re executing strategic robberies on the market’s weaknesses.
🧠💪 Every like = more power to the crew. Every comment = a new map to a vault.
We rob, retreat, and repeat. Let’s make money with skill, not luck. 🕶️💰🚁
⚠️ LEGAL COVER (For the Lawyers 😏):
This plan is not investment advice, just an organized heist blueprint by chart robbers.
Always manage your own risk and update your plan as the market evolves.
🕶️ Stay ready for the next master plan... Until then, keep your charts clean and your stops tight. 🕶️💣📉
– Thief Trader Out 🐱👤🚀
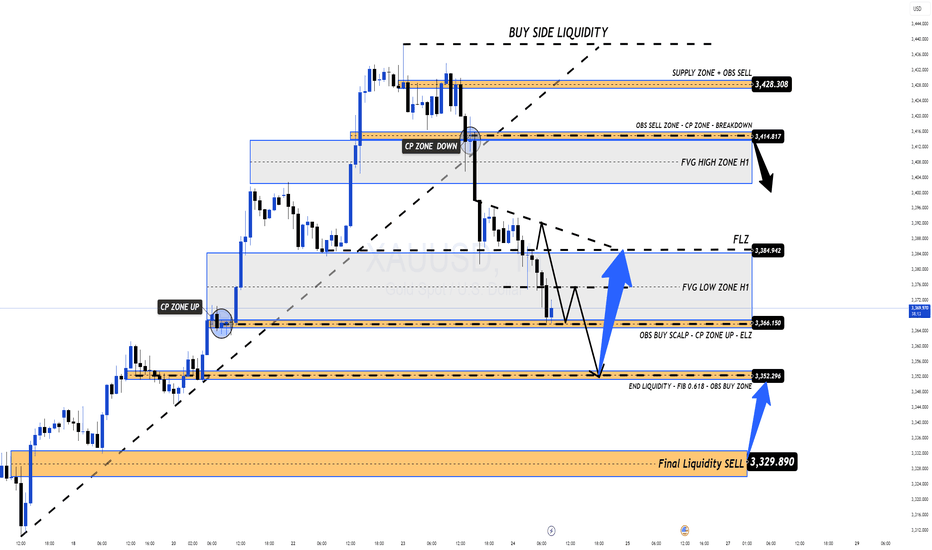
Correction in Play, Long-Term BUY Opportunity Ahead XAUUSD 24/07 – Correction in Play, Long-Term BUY Opportunity Ahead
🧭 Market Outlook
Gold has dropped sharply from the 343x region, exactly as outlined in yesterday’s plan. Price has broken below the ascending trendline on the H1 chart and is now tapping into lower liquidity zones (FVG + OBS), signaling continuation of the short-term bearish move.
Key context to watch:
Traders are awaiting final decisions on US global trade policy agreements.
Next week’s FOMC meeting may confirm expectations of an interest rate cut.
Later today, markets will react to US PMI data and Jobless Claims, which could trigger volatility.
📊 Technical View
While the higher timeframe trend (D1/H4) remains bullish, the short-term structure has broken, and the market is now exploring unfilled liquidity pools below. Once these are swept, we anticipate a strong long-term BUY opportunity.
🎯 Trading Plan for Today
📌 Short-Term Strategy:
Look for short-term SELL setups on retracements toward resistance zones. Wait for clear rejection signals before entering.
📌 Mid/Long-Term Strategy:
Prepare to BUY from major Key Levels once price taps into deep liquidity zones. Ensure confluence and good risk/reward before entering.
🔎 Key Levels to Watch
🔺 Upper Resistance Zones:
3393 – 3404 – 3414 – 3420 – 3428
🔻 Lower Support Zones:
3375 – 3366 – 3352 – 3345 – 3330
🔽 Trade Setups
✅ BUY ZONE: 3352 – 3350
SL: 3345
TP: 3356 → 3360 → 3364 → 3370 → 3375 → 3380 → 3390 → 3400
🔻 SELL ZONE: 3414 – 3416
SL: 3420
TP: 3410 → 3406 → 3400 → 3395 → 3390 → 3380
⚠️ Risk Reminder
No major economic news is scheduled for today, but unexpected political statements or geopolitical tensions could cause price spikes.
✔️ Always follow your SL/TP strictly.
✔️ Avoid entering without solid confirmation.
✔️ Watch how price reacts to the levels above.
📣 Follow MMF on TradingView
If this trading roadmap helps your strategy,
📌 Follow the MMF team on TradingView for daily actionable setups, real levels, and no-nonsense analysis based on real market conditions.
🎯 Real trades. Real zones. Real discipline.
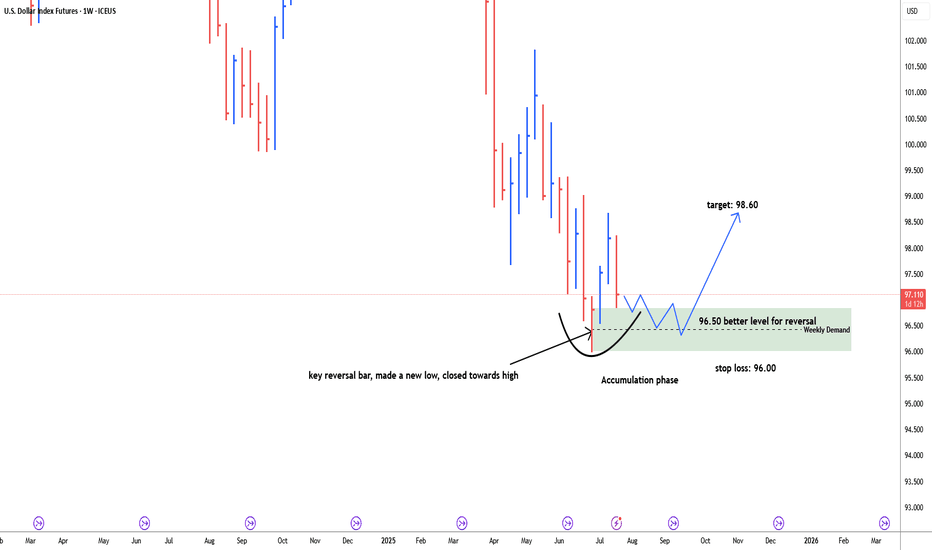
USD Dollar index possbile bullish reversal#usddollarindex, last weekly bar of the month of June is key reversal bar, made a new low and closed towards high. price retracing back down to test weekly demand zone. discount zone of demand is 96.50. possible bullish reversal target: 98.60. Stop loss below 96.00. price need time to build energy for bullish momentum. 96.50-96.00 is more secure level for long.
EURUSD Bearish Ahead as US Resilience Meets Eurozone FragilityEURUSD has shifted into bearish territory, pressured by growing divergence between a resilient US economy and a struggling Eurozone. The pair recently rejected the 1.1700 zone, forming multiple bearish structures on the 4H chart. With sticky US inflation, Trump’s renewed tariff agenda, and a dovish ECB, EUR/USD appears poised for a deeper move toward 1.1527 and possibly 1.1445 in the coming sessions. This setup is both technically and fundamentally aligned, but key event risk remains.
🔸 Technical Structure (4H)
Clear rejection from the 1.1700–1.1710 zone.
Bearish pennants and wedge patterns confirm continuation lower.
Downside targets:
🔹 First: 1.1637
🔹 Second: 1.1527
🔹 Final: 1.1445
Risk zone: Above 1.1785 (invalidates short bias if broken cleanly).
🧭 Key Fundamentals
🇺🇸 Dollar Strength: Sticky inflation, stable labor market, and geopolitical risk all favor USD demand.
🇪🇺 Euro Weakness: ECB dovish tone persists amid weak data, soft PMIs, and stagnating growth.
Yield Spread: US-Euro real yield spread supports further EUR/USD downside.
Tariff Pressure: Trump’s 50% tariff plan and tensions with the EU weigh on EUR.
⚠️ Risks to Watch
A surprise dovish pivot from the Fed.
Weak US CPI or disappointing retail sales.
Major risk-on flows that trigger broad USD weakness.
New EU fiscal stimulus or Germany/France recovery surprises.
📆 Key Events Ahead
🇺🇸 US Core CPI – A hot print supports USD strength.
🇺🇸 Retail Sales & Powell testimony – Watch tone on rate cuts.
🇪🇺 German ZEW Sentiment, Eurozone HICP inflation – Weak readings would further drag EUR.
🔄 Leader or Lagger?
EUR/USD is a lagger to GBP/USD, often following UK-driven USD moves.
Acts as a leader for EUR/JPY, EUR/AUD, EUR/CHF – weakness here cascades across EUR crosses.
Tracks broad USD sentiment – dovish Fed pricing boosts EURUSD, while rate hike fears drag it.
✅ Summary: Bias and Watchpoints
EUR/USD is bearish below 1.1700 as economic divergence, sticky US inflation, and rising geopolitical tensions favor the dollar. ECB policy remains soft, offering little support to the euro. Key risk lies in a dovish Fed pivot or softer US data. Watch US CPI and Powell for clues. This pair is likely to lag GBP/USD moves, but will lead EUR crosses lower if the downside momentum continues.
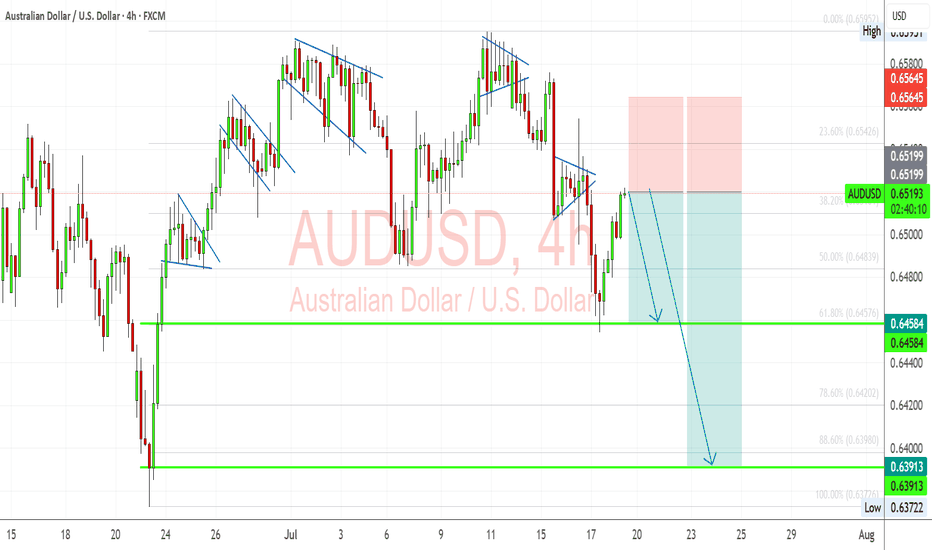
AUDUSD: Bearish Flag Retest Within Macro HeadwindsAUDUSD is developing a clean bearish technical setup just as macro fundamentals increasingly weigh on the Australian dollar. The pair recently completed a rising wedge breakout and is now retesting broken structure within a larger downtrend. With risk sentiment shaky due to U.S. tariff threats and dovish repricing of the RBA’s outlook, Aussie bulls may struggle to sustain momentum. A confirmed breakdown below 0.6458 could open the door toward June’s swing low near 0.6390.
🧠 Technical Breakdown:
✅ Bearish Flag Structure:
The chart shows a sequence of bearish flags and rising wedges, all of which have historically broken lower. The latest breakout to the downside was sharp, and the current rally appears corrective.
✅ Fib Levels & Confluence:
Price is hovering near the 38.2% retracement (0.6510) from the last leg down. The invalidation zone around 0.6565 aligns with a supply zone, making it an ideal SL area.
✅ Target Zones:
First support: 0.6458
Measured move: 0.6390 - 0.6370
These coincide with Fib 61.8% & 100%, adding technical confluence.
📉 Fundamental Drivers:
Dovish RBA Signals: Labour data missed expectations, and June inflation slowed (4.8% vs. 4.9% expected), softening the RBA’s hawkish stance.
Stronger USD Outlook: Powell’s reappointment risk and rate-cut delay pricing have supported the dollar. U.S. data (Retail Sales, CPI) still signal sticky inflation and strong labor.
Tariff Risk from Trump: With the U.S. floating global 10% tariffs, risk assets like AUD (a high-beta currency) face downside pressure.
⚠️ Risks to Bearish Bias:
Stronger-than-expected China stimulus could support AUD as a proxy.
A dovish Fed pivot or soft U.S. data might undercut USD strength.
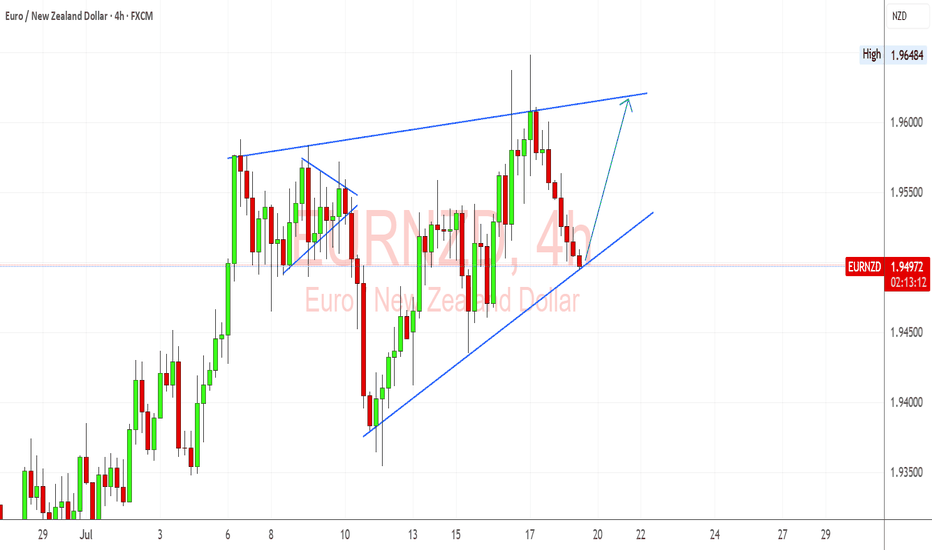
EURNZD Trendline & Hawkish ECB Bias Support Bullish ContinuationEURNZD is holding beautifully above the ascending trendline on the 4H, and I’m watching this level closely for a bounce continuation setup. Fundamentally, the euro remains supported by sticky inflation and hawkish ECB commentary, while the kiwi is showing softness after dovish signals from the RBNZ and mixed jobs data. If this trendline holds, I’ll be targeting a retest of the upper wedge resistance near 1.9640.
🔍 Technical Setup (4H):
Structure: Ascending triangle forming – price is pressing into dynamic support.
Support Zone: Around 1.9480 trendline area – price rejected this level several times in July.
Resistance Target: 1.9640 highs – double top and triangle resistance.
Bullish Confirmation: Rebound with bullish engulfing or strong 4H close above 1.9525 could trigger long setup.
Invalidation: Clean break below trendline and 1.9440 invalidates bullish scenario short-term.
💡 Fundamental Insight:
EUR Drivers:
ECB members remain cautious about declaring victory on inflation.
German and Eurozone CPI data remain above target, supporting higher-for-longer ECB stance.
Speculation that ECB won't cut aggressively compared to RBNZ.
NZD Weakness:
RBNZ minutes show concern over downside inflation risks.
Labor market cooling, and migration pressures remain high.
Commodity and China-linked sentiment weakening NZD.
⚠️ Key Risks:
If Eurozone inflation or PMI data surprises to the downside, EUR may weaken.
RBNZ hawkish pivot or surprise tightening would flip sentiment toward NZD.
Global risk-on could favor NZD as a high-beta currency.
🧭 Summary:
I’m bullish on EURNZD as long as price holds above the trendline near 1.9480. The technical structure shows a clean ascending pattern, and the fundamentals currently favor EUR strength over NZD. My eyes are on a potential move toward 1.9640, especially if upcoming ECB rhetoric stays hawkish. EURNZD tends to lead NZD-crosses like NZDJPY or NZDCHF in risk-off regimes and could signal euro strength if it breaks out. Watching closely for price action confirmation.
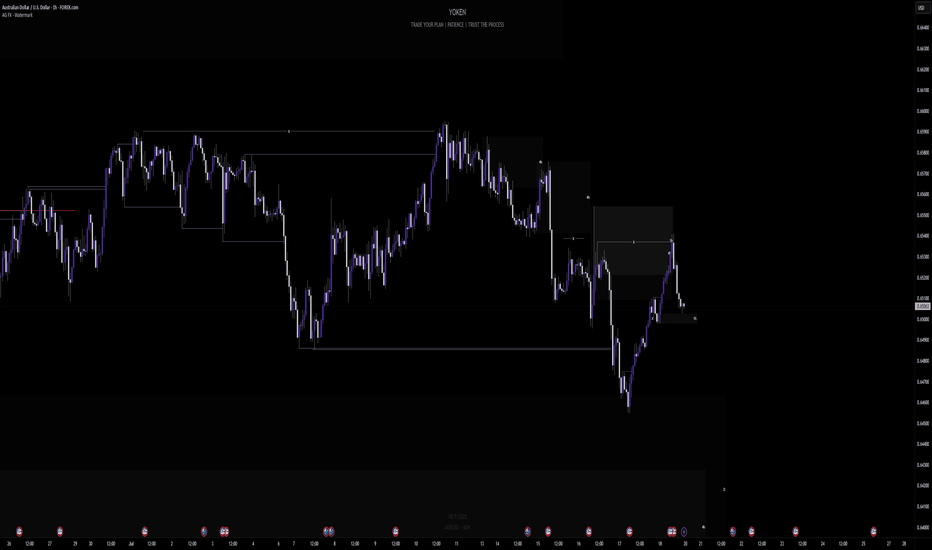
Week of 7/20/25: AUDUSD AnalysisLast week's price action was bearish and this week I will follow bearish order flow unless internal 1h structure continues to be bullish. I'm going to look for shorts after 1h internal structure is broken as confirmation, then take trades down to the daily demand zone and then look for bullish signals.
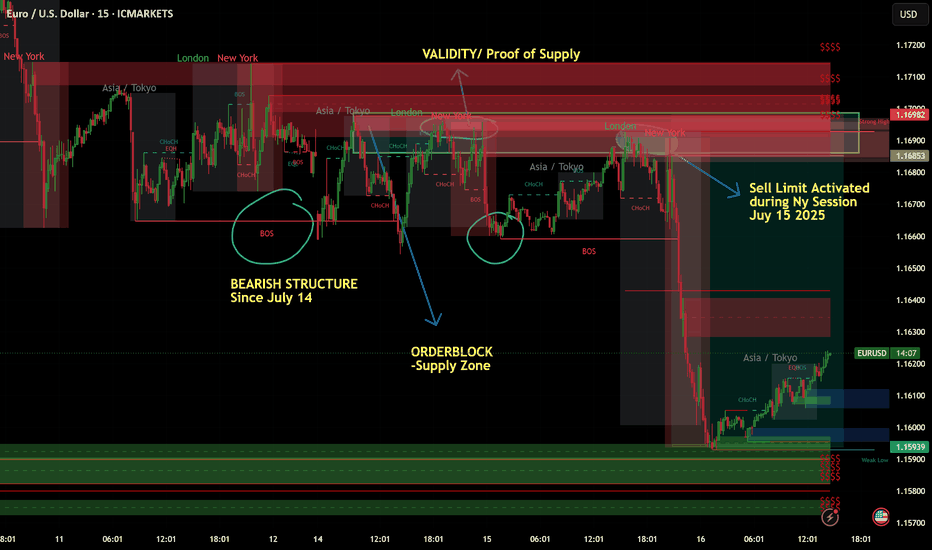
July 15 2025 -Sell Limit ActivatedGood day, folks!
Just sharing another learning from my ideas here:
EURUSD has been in a bearish structure since July 14, 2025 (1H Intraday). As you know, I always look for clear supply or demand validation before placing a sell or buy limit order. On the chart, you can see a valid supply zone that was generated on Monday. After that, I waited for a clear move during the Tuesday London and New York sessions, with the CPI news release acting as a catalyst for more volatility. The trade came to fruition during the New York session on Tuesday. (See chart for the complete breakdown of the movement and entry.)
RR: 1:3
Another Wyckoff schematics and structure analysis.
USDJPY 1H - market buy with a confirmed structureThe price has bounced from a key support zone and is showing early signs of recovery. A clear base has formed, and the MA50 is starting to turn upward, indicating a shift in short-term momentum. While the MA200 remains above the price, the overall structure suggests a potential continuation of the bullish move.
Trade #1 — entry at market, target: 145.939, stop below recent local low.
Trade #2 — entry after breakout and retest of 145.939, target: 148.000, stop below the retest zone.
Volume has stabilized, and the reaction from support is clear. As long as price holds above the last swing low, buying remains the preferred strategy.
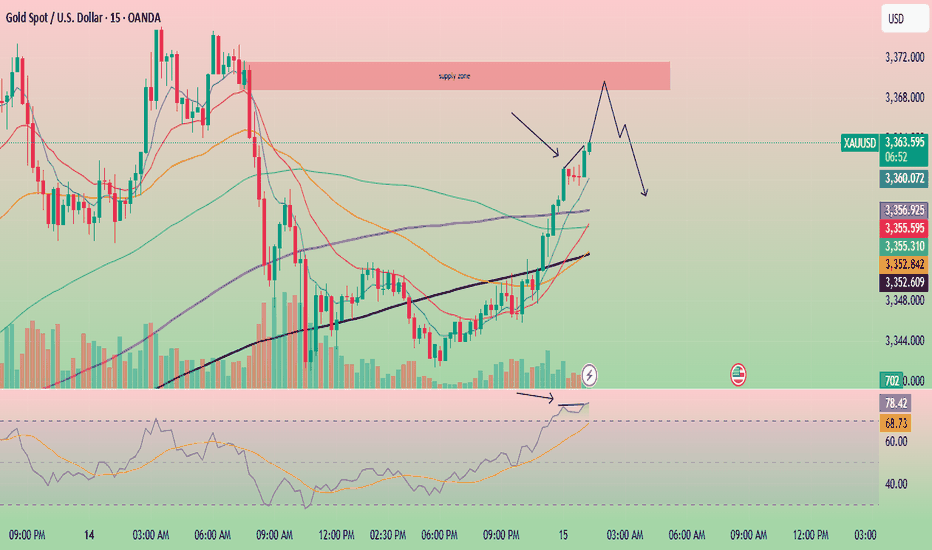
Gold is showing signs of bearish RSI divergence.🚨 Gold Update – Potential Selling Opportunity Ahead 🚨
Gold is showing signs of bearish RSI divergence on the 15-minute chart, while the RSI is already in the overbought zone. The price is also approaching a key supply zone, which could trigger a reversal.
📉 Multiple confirmations are pointing toward a potential sell setup:
Bearish RSI divergence
Overbought RSI condition
Approaching a strong supply zone
If price breaks below the 8 EMA with a bearish engulfing candle, it may confirm downward momentum.
⚠️ Watch closely — This setup is shaping up with solid confluence.
🔍 Always do your own research (DYOR) – This is not financial advice.


