(iFVG) before continuing its fall.EUR/USD is now ready to move downward. The market has already cleared out all the liquidity above, which suggests that it's now in the mood to drop. Earlier, on the 4-hour timeframe, the market had formed a bullish Fair Value Gap (FVG), but that has now been broken to the downside.
Currently, there are chances that the market might touch the imbalance (iFVG) before continuing its fall. Keep an eye on that level and observe how the market reacts there. It could be an important zone.
Do Your Own Research (DYOR)! This is not financial advice.
Forexmarkets

Forex Trading Time Zones: Market Hours and OverlapsForex Trading Time Zones: Market Hours and Overlaps
In the world of forex trading, understanding the dynamics of different time zones is paramount. This article delves into the intricate web of currency trading time zones, exploring the 24-hour cycle, major trading hours, and the nuanced opportunities each presents.
The 24-Hour Cycle of Forex Market Time Zones
The forex market's distinctive feature of being open 24 hours a day, five days a week, is a testament to its unparalleled accessibility, dynamics, and decentralised nature. Unlike traditional financial markets constrained by fixed trading hours, the forex market operates continuously, commencing in Asia on Monday and concluding in North America on Friday.
Major financial centres in different time zones steer the dynamics of the forex market, acting as the primary drivers of market activity during their respective business hours. That complex interplay creates distinct trading periods, each characterised by unique market conditions and opportunities.
Key Forex Session Time Zones
Knowing the trading hours of the major forex trading hours is fundamental for any trader aiming to capitalise on the dynamic nature of the market.
Winter time:
- London Session: From 8:00 AM to 5:00 PM UTC
- New York Session: From 1:00 PM to 10:00 PM UTC
- Sydney Session: From 09:00 PM to 6:00 AM UTC
- Tokyo Session: From 11:00 PM to 8:00 AM UTC
Summer time:
- London Session: From 7:00 AM to 4:00 PM UTC
- New York Session: From 12:00 PM to 9:00 PM UTC
- Sydney Session: From 10:00 PM to 7:00 AM UTC
- Tokyo Session: From 11:00 PM to 8:00 AM UTC
Different Time Zones in Forex Trading Create Opportunities
The diverse forex trading time zones offer a rich tapestry of opportunities, each session presenting distinct characteristics that traders can strategically exploit.
London Session
The London session time provides opportunities for traders to engage in high-liquidity markets. Currency pairs involving the euro (EUR) or the British pound (GBP), such as EUR/USD and GBP/USD, tend to be particularly active during this period. The early morning volatility during the London session trading time can be harnessed for quick trades or trend-establishing moves.
New York Session
As the New York session time kicks in, currency pairs involving the US dollar (USD) or other currencies of countries in the same time zone take centre stage. Pairs like USD/MXN and USD/CAD experience heightened volatility and amplified market activity.
Sydney Session
While the Sydney session may exhibit lower volatility, it sets the stage for the day's trading. Currency pairs tied to the Australian dollar (AUD) and the New Zealand dollar (NZD), like AUD/USD and NZD/USD, can witness initial movements during this period, creating opportunities for strategic positioning.
Tokyo Session
The Tokyo session focuses on the Japanese yen (JPY) pairs, offering traders the chance to tap into the unique characteristics of this market. Currency pairs like USD/JPY and EUR/JPY may see increased activity, presenting opportunities for trend-following or counter-trend strategies.
Session Trading Strategies
The convergence of major financial hubs during specific currency trading time zones creates a unique environment that can be exploited strategically. Let’s examine three strategies for each major forex time zone.
London Session Breakout Strategy
The London Session Breakout strategy is based on the significant increase in trading volume and volatility when the London market opens, specifically between 7:00 AM and 10:00 AM UTC (summer time) or 8:00 AM and 11:00 AM UTC (winter time). However, most focus is often placed on the range between 8:00 AM and 9:00 AM summer time or 9:00 AM and 10:00 AM winter time. This surge during the London trading session often leads to notable price movements, particularly in forex pairs like GBP/USD and EUR/USD, making it an ideal time for breakout strategies.
Entry
- Traders monitor the early London trading hours. The idea is to look for a specific range with clear high and low boundaries during this time.
- They set buy stop orders slightly above the high of this range and sell stop orders slightly below the low, aiming to capture the breakout direction.
Stop Loss
- Stop losses are strategically placed slightly below the most recent swing low for buy positions and vice versa, offering potential protection against false breakouts.
Take Profit
- Some traders may prefer to close the position as the New York session begins, as reversals are common during this session overlap.
- Alternatively, trailing stops might be employed to take advantage of extended price movements if the trend continues strongly after the breakout.
New York Reversal Strategy
The New York Reversal strategy exploits the heightened volatility and liquidity that occur at the start of the New York session. While there isn’t a perfect correlation, it’s common to see the initial London trend extended early into the New York session before a reversal, usually between 12:30 PM and 2:00 PM UTC summer time and 1:30 PM and 2 PM UTC winter time. This strategy is particularly effective due to the influx of trading activity and market orders when the US markets open.
Entry
- Traders often monitor the market around the first couple of hours of the New York forex session time, looking for signs of reversal. This may be a divergence between a price and a momentum indicator, a reaction from a significant support or resistance level, a candlestick or chart pattern, and so on.
- Once the trader has confirmation that the London trend may be reversing, they enter a position.
Stop Loss
- Stop losses are generally placed just beyond the nearest swing high or low. This helps potentially protect against losses if the anticipated reversal does not occur.
Take Profit
- Traders frequently set profit targets at significant support or resistance levels established during the London session.
- Alternatively, traders might trail their stop loss to follow the market movement and maximise potential gains.
Tokyo Volatility Breakout Strategy
The Tokyo Volatility Breakout strategy leverages the increased trading activity and liquidity at the start of the Tokyo session time. This strategy is best suited to JPY pairs like USD/JPY, EUR/JPY, and GBP/JPY, which often see significant price movements due to the influx of market participants at Japan’s forex market open time.
Between 9:00 PM and 10:00 PM UTC summer time (8:00 PM and 9:00 PM UTC winter time), volume and liquidity dry up significantly as the New York session closes. 10:00 PM and 11:00 PM UTC summer time (9:00 PM and 10:00 PM winter time) sees some activity as Sydney session time begins, but the start of the Tokyo session forex time, between 11:00 PM and 12:00 AM, can kickstart a new trend and break out from the typical ranging conditions from the previous few hours.
Entry
- Traders often monitor the market and look for breakouts as the Tokyo session begins.
- Bollinger Bands can be used to identify these breakouts, typically characterised by the bands squeezing together before the price closes strongly outside the upper or lower band, potentially indicating the start of a trend.
Stop Loss
- Stop losses are generally placed beyond the nearest swing high or low or beyond the opposite side of the Bollinger Band. This helps potentially protect against losses if the breakout does not result in a sustained trend.
Take Profit
- Profit targets are often set at significant support or resistance levels established in previous sessions.
- Alternatively, positions might be closed at the start of the London session (around 7:00 AM - 8:00 AM UTC) to avoid potential reversals that occur with the increased liquidity and trading volume as European markets open.
Tailoring Your Trading Schedule to Forex Currency Time Zones
Crafting an effective trading schedule involves a personalised approach, taking into account a trader's individual location and trading style objectives.
Different Trading Styles: Maximising Opportunities
Forex time zones often determine specific forex rate behaviours. For day traders, the volatility and liquidity during overlapping activity can provide ideal conditions for executing rapid trades. The heightened volatility and liquidity are even more advantageous for scalpers seeking to capitalise on rapid price movements by executing trades with precision.
Overlapping sessions also often mark key points where trends may continue or reverse. Traders employing trend-following or breakout-based strategies can capitalise on that momentum.
Swing traders, on the other hand, who aim to capture trends over a slightly longer timeframe, may take advantage of the distinct characteristics of individual sessions, such as the so-called stability of the Sydney session or the high volatility of the London session.
Economic Events and News Releases
Traders also consider the timing of major data releases and align that with their specific geographic location. During the London session, major European economic indicators and policy announcements can set the tone. Then, the market may respond to data from the United States that can significantly influence USD pairs, followed by economic reports from the Asia-Pacific region. The interconnectedness of the world economy can have cascading effects on currency values across the globe.
Currency Market Correlations
Currency pair correlations exhibit dynamic shifts depending on the timing and may lead to specific patterns. For example, the correlation between USD/JPY and EUR/USD can shift throughout the trading day, starting from positive during the Tokyo session and then shifting into negative during European and New York trading hours. Traders can leverage correlation analysis as a powerful tool for making informed trading decisions.
Final Thoughts
Navigating the dynamic world of forex trading requires a multifaceted understanding of the market's 24-hour cycle, the overlapping of major trading sessions, and the intricate interplay of economic events and currency correlations.
FAQ
What Are the 4 Forex Sessions?
The forex market operates 24 hours a day, divided into four main sessions based on key financial centres: the Sydney session forex time (10:00 PM to 7:00 AM UTC in the summer and 9:00 PM to 6:00 AM UTC in the winter), the Tokyo session forex time (11:00 PM to 8:00 AM UTC in the summer and winter), the London session forex time (7:00 AM to 4:00 PM UTC in the summer and 8:00 AM to 5:00 PM UTC in the winter), and the New York session forex time (12:00 PM to 9:00 PM UTC in the summer and 1:00 PM to 10:00 PM UTC in the winter).
When Does the London Session Start?
The London session starts at 7:00 AM UTC during summer and at 8:00 AM UTC during winter due to daylight saving time adjustments. This session is crucial for its high liquidity and significant overlap with other major sessions.
What Time Is the New York-London Session Overlap?
The overlap between the New York trading session time and the London session occurs from 12:00 PM to 4:00 PM UTC in summer and from 1:00 PM to 5:00 PM UTC in winter.
Do Tokyo and London Sessions Overlap?
The Tokyo and London sessions do not overlap significantly. The Tokyo session ends at 8:00 AM UTC, while the London session starts at 7:00 AM UTC in the summer. The minimal overlap from 7:00 AM to 8:00 AM UTC sees limited trading activity. In winter, sessions don’t overlap.
This article represents the opinion of the Companies operating under the FXOpen brand only. It is not to be construed as an offer, solicitation, or recommendation with respect to products and services provided by the Companies operating under the FXOpen brand, nor is it to be considered financial advice.

What Is a Spot Rate and How It Is Used in Trading?What Is a Spot Rate and How It Is Used in Trading?
Spot rates are a cornerstone of trading, reflecting the real-time price for immediate settlement of assets like currencies and commodities. They provide traders with crucial insights into market conditions and influence strategies across various domains. This article explores what spot rates are, how they work, and their role in trading.
Spot Rate Definition
The spot rate is the current price at which an asset, such as a currency, commodity, or security, can be bought or sold for immediate delivery. In essence, it’s what the market says something is worth right now, reflecting real-time supply and demand. Unlike future prices, which are influenced by expectations and contracts for later delivery, this type of pricing is all about the present.
Spot rates are especially crucial in highly liquid assets like forex and commodities, where prices can change rapidly based on global events. To use an example, if the rate for the euro against the dollar is 1.1050, that’s the price at which traders can exchange euros for dollars at that moment. It’s dynamic, adjusting instantly to factors like economic news, interest rate changes, and geopolitical developments.
Spot pricing also serves as a benchmark in derivative contracts, such as futures, influencing how traders and businesses hedge against potential price movements. For instance, a gold producer might monitor these quotes closely to decide when to lock in prices.
Spot Rate vs Forward Rate: What's the Difference
The spot and forward rates (or spot rate vs contract rate) are both used to price assets, but they serve different purposes. While the spot rate is the current price for immediate settlement, the forward rate is the agreed-upon price in a transaction set to occur at a future date.
The former reflects conditions right now—shaped by immediate supply and demand. Forward rates, on the other hand, factor in expectations about future conditions, such as borrowing cost changes or potential economic shifts. For example, if a company expects to receive payments in a foreign currency within a certain period, it can use a forward rate to guarantee the amount it will receive and avoid adverse exchange rate fluctuations.
One key link between the two is that forward rates are derived from spot pricing, adjusted by factors like interest rate differentials between two currencies or the cost of carrying a commodity. In forex trading, if borrowing costs in the US are higher than in the eurozone, the forward rate for EUR/USD may price in a weaker euro relative to the dollar.
Specifically, a forward rate is determined by three factors: its underlying spot rate, interest rate differential, and the contract’s time to expiry.
Backwardation and Contango
Backwardation and contango are terms used to describe the pricing structure of futures markets, specifically the relationship between spot prices and futures contract prices. These concepts help traders understand broader expectations and supply-demand dynamics.
In backwardation, the spot price of an asset is higher than its future prices. This often happens when demand for immediate delivery outweighs supply. In the oil market, backwardation might occur if there’s a short-term supply disruption, causing the current price to spike while future prices remain lower, reflecting expectations of supply returning to normal.
On the other hand, contango occurs when future prices are higher than spot quotes. This can indicate that holding costs, such as storage fees or insurance, are factored into the future price. For instance, in gold, contango might be typical since storing gold involves costs, which are priced into future contracts.
These structures aren’t just theoretical—they directly affect trading strategies. CFD traders can use these concepts to anticipate market movements and hedge against adverse price changes. By understanding market sentiment and expectations, traders can speculate on the direction of prices.
How Spot Rates Are Determined
Spot prices are dynamic and reflect the immediate balance of supply and demand. They fluctuate based on several key factors that shape trading activity and market conditions.
- Supply and Demand Dynamics: When demand for an asset outpaces its supply, the rate rises, and vice versa. For example, a spike in demand for oil due to geopolitical tensions can push its price higher.
- Economic Indicators: Inflation data, GDP growth, and employment figures heavily influence spot quotes, particularly in forex. A strong economic report can lead to currency appreciation, while weak data may have the opposite effect.
- Interest Rate Differentials: In forex, differing interest rates between countries impact currency spot rates. Higher borrowing costs in one country can attract investment, driving up demand for its currency and its price.
- Liquidity: Highly liquid assets, like major currency pairs, might have more consistent prices. Less liquid assets can see greater price volatility due to fewer participants.
- Geopolitical Events: Elections, wars, and natural disasters can cause sudden price shifts by disrupting supply chains or altering economic outlooks.
Types of Spot Markets
Spot markets are where assets are traded for immediate settlement, offering real-time pricing and instant transactions.
- Forex: The largest spot market, where currencies like the euro or dollar are exchanged at the current rate, often used by traders to capitalise on short-term price movements.
- Commodities: Includes trading raw materials like gold, oil, or wheat. Buyers and sellers agree on the spot price for immediate delivery, reflecting current supply-demand dynamics.
- Equities: Shares of publicly traded companies are bought and sold at the prevailing market price on exchanges like the London Stock Exchange or NYSE.
- Cryptocurrencies*: Although not mentioned earlier, these involve buying and selling digital assets like Bitcoin at current prices and receiving an instant ownership transfer.
What Spot Rates Mean for Traders and Markets
Spot rates are effectively snapshots of reality, reflecting the current balance of supply and demand. For traders, they provide a critical context for decision-making and deeper insights.
Market Sentiment and Timing Opportunities
These rates offer a real-time lens into market sentiment. Sudden price movements often signal shifts in supply, demand, or broader economic conditions. For instance, a rapid rise in the spot price of oil might indicate geopolitical tensions affecting supply chains, which could have knock-on effects across energy-related sectors. Traders monitoring these shifts can identify potential opportunities to capitalise on short-term volatility or avoid unnecessary exposure.
In addition, spot rates reveal liquidity levels. Highly liquid markets, such as major forex pairs like EUR/USD, typically have tighter spreads and more consistent prices. By contrast, less liquid assets might exhibit greater price discrepancies, signalling caution or potential opportunities to analyse deeper.
Impact on Strategy and Broader Markets
Spot rates directly influence trading strategies, especially in markets tied to commodities or currencies. Futures pricing, for instance, is often built upon the spot quote. Traders use these quotes to gauge whether hedging or speculative strategies align with current dynamics. A mismatch between spot and futures prices can indicate a contango or backwardation scenario, providing insight into whether traders are expecting costs or supply changes in the near term.
Beyond individual strategies, they also ripple through broader markets. For businesses and investors, they act as barometers in cost evaluating and pricing. For example, airlines keep a close eye on the current price of jet fuel to decide when to secure future contracts, directly impacting operational costs and profitability. Similarly, multinational companies use spot pricing in forex to manage cross-border expenses or revenue.
The Bottom Line
Spot rates are at the heart of trading, offering real-time insights into market conditions and influencing strategies across financial markets. Understanding how they work can help traders navigate potential opportunities and risks.
Whether you trade forex, commodities, stocks or other markets, choosing the right broker is essential. Open an FXOpen account to access competitive trading conditions, 700+ markets, and user-friendly platforms and trade CFDs designed for all levels of traders.
FAQ
What Is a Spot Rate?
A spot rate represents the price at which an asset, such as a currency, commodity, or security, is currently available for immediate settlement. Traders and businesses often use these prices as benchmarks in transactions and to assess market conditions.
What Does Spot Price Mean?
The spot rate meaning refers to the exact market price for an asset at a specific moment in time. It’s the price buyers are willing to pay and sellers are willing to accept for immediate delivery. These prices are dynamic, changing with broader conditions.
When to Use Spot Rate?
Spot rates are commonly used when immediate delivery of an asset is required. Traders often rely on them in short-term positions, while businesses might use them for immediate currency exchanges or raw material purchases. They’re also used as reference points when evaluating forward contracts and derivatives.
How Are Spot Exchange Rates Determined?
Spot exchange rates are determined by the forces of supply and demand. Factors like interest rates, economic data, geopolitical events, and liquidity can influence them.
Is Spot Trading Risk Free?
No, all trading carries risks. Prices can be volatile, and unexpected market events may lead to losses. Understanding these risks and using proper risk management techniques can help potentially mitigate losses.
*Important: At FXOpen UK, Cryptocurrency trading via CFDs is only available to our Professional clients. They are not available for trading by Retail clients. To find out more information about how this may affect you, please get in touch with our team.
Trade on TradingView with FXOpen. Consider opening an account and access over 700 markets with tight spreads from 0.0 pips and low commissions from $1.50 per lot.
This article represents the opinion of the Companies operating under the FXOpen brand only. It is not to be construed as an offer, solicitation, or recommendation with respect to products and services provided by the Companies operating under the FXOpen brand, nor is it to be considered financial advice.

The Wildest Forex Stories You Won’t Believe Actually HappenedIf you think the forex market is all about boring spreadsheets, economic data, and mind-numbing chart patterns, think again. Beneath the surface of the world’s largest financial market lies a treasure trove of jaw-dropping, laugh-out-loud, and occasionally heart-wrenching tales.
Some of these stories will make you double-check your stop-losses, while others might tempt you to try your hand at trading—if only for the adrenaline rush.
Here’s a whirlwind tour of the forex market’s wildest moments. Spoiler alert: truth really is stranger than fiction.
The “Flash Crash” That Shook the Yen
Imagine logging into your trading platform, coffee in hand, only to see the yen skyrocket in a matter of minutes. That’s precisely what happened on January 3, 2019, when the USD/JPY pair nosedived by 4% in less than 10 minutes. The culprit? A rare combo of thin holiday liquidity, panicked algorithms, and a trigger-happy market reacting to Apple’s earnings warning .
Traders watching the carnage were left rubbing their eyes in disbelief as billions of dollars evaporated faster than you can say “where’s my stop loss.” Some savvy players profited handsomely, while others were left staring at margin calls and wondering if they’d just witnessed a glitch in the Matrix.
Lesson learned : Low liquidity markets can be as risky as walking on thin ice.
George Soros: The Man Who Made $1 Billion in a Day
No list of wild forex stories is complete without the ultimate trading flex: George Soros’s legendary short against the British pound in 1992. Dubbed “Black Wednesday,” this was the day Soros and his Quantum Fund went toe-to-toe with the Bank of England—and won.
Convinced by his partner Stanley Druckenmiller that the pound was overvalued and would be forced out of the European Exchange Rate Mechanism (ERM), Soros bet billions on its decline. The result? A cool $1 billion profit in a single day, a humiliated Bank of England, and Soros’s elevation to trading legend.
Lesson learned : Never underestimate the power of conviction—or billions in leverage.
The Swiss Franc Tsunami
On January 15, 2015, the Swiss National Bank (SNB) shocked the world by unpegging the Swiss franc from the euro . In the blink of an eye, the EUR/CHF pair plummeted as much as 19%, and chaos erupted across the forex market. Brokers went under, traders were wiped out, and even the most seasoned professionals were left scrambling for answers.
Lesson learned : Central banks play by their own rules, and when they change the game, expect pandemonium.
The Trader Who Bet Against the Euro—and Won Big
Meet John Taylor, the founder of currency hedge fund FX Concepts and one of the original forex market wizards. In the early 2000s, Taylor made a name for himself by betting against the euro when everyone else was bullish. Armed with a combination of macroeconomic analysis and a deep understanding of market psychology, he rode the euro’s decline to rack up massive profits.
His contrarian approach earned him a reputation as a forex maverick, proving that going against the herd can pay off big—if you’ve done your homework. But not for long. Long story short: FX Concepts got up to $14 billion in assets in 2008 and declared bankruptcy in 2013.
Lesson learned : In forex, sometimes the best trades are the ones no one else sees coming. But also—it’s tough to know when to call it quits.
The Currency Crash That Inspired a Coup
In 1997, the Asian Financial Crisis sent shockwaves through global markets, but few places felt it as acutely as Indonesia. The rupiah lost more than 80% of its value , sparking widespread economic turmoil and political unrest that ultimately led to the resignation of President Suharto after 31 years in power.
While most forex traders were focused on the numbers, the crisis served as a stark reminder that currencies aren’t just lines on a chart—they’re the backbone of entire economies.
Lesson learned : Forex trading can shape history in ways few other markets can.
The Pound’s Post-Brexit Rollercoaster
In June 2016, the Brexit referendum sent the British pound on a ride so wild it could rival any theme park attraction. As the "Leave" vote defied polls and pundits, the pound plummeted 10%, hitting levels not seen since the 1980s . Traders who had been banking on a "Remain" victory were left scrambling, while those betting against the pound made a killing.
The chaos didn’t stop there. In the months and years that followed, every Brexit-related headline became a market-moving event. Negotiation updates? Pound down. Political drama? Pound down. A tiny glimmer of clarity? Pound up—until the next twist.
This wasn’t just a currency reacting to uncertainty; it was a masterclass in how politics can take control of forex markets.
Lesson learned : Currencies are deeply tied to national identity and global sentiment. And when politics enters the mix, expect fireworks.
What’s Your Wildest Forex Story?
The forex market is a place of extremes—extreme risk, extreme reward, and extreme stories that prove truth is stranger than fiction.
Have your own wild forex story to share? Maybe you caught the Swiss franc wave or survived a flash crash with your account intact. Drop your tale in the comments and let’s get talking!

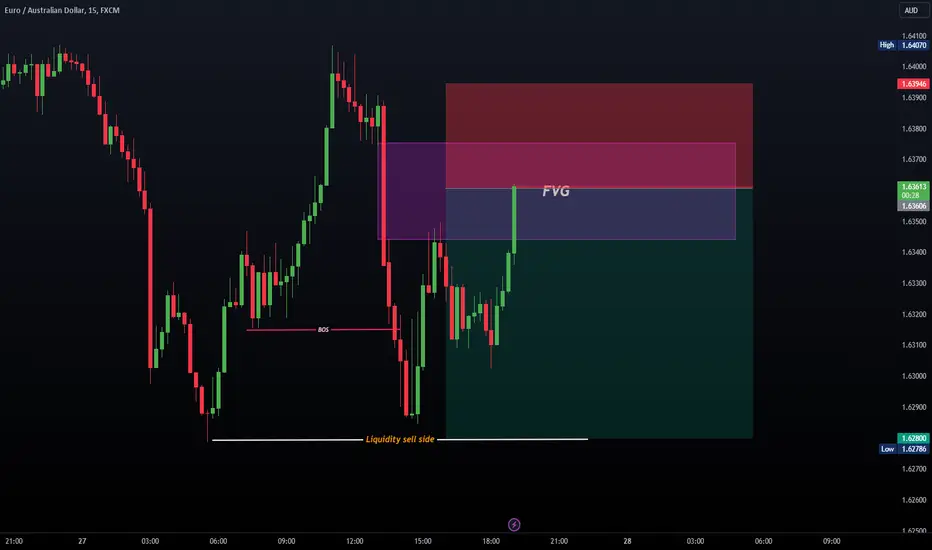
EURAUD TradeAtfer berakout of structure we will see a continuation of the downtrend to taken liquidity of the sell side we consider FVG an entry point
- Trading is probality control you risk management
Good Luck !
EURJPY TradeAtfer taken liquidity of the buyside and change of character we will see a continuation of the downtrend we consider FVG an entry point
- Trading is probality control you risk management
Good Luck !

My current Plan for EUR/USD, GBP/CAD, EUR/HUFThis is my plan for the next few Quarters. My main focus is on the EUR/USD. If price is able to hit the 1.05 level, I will need to decide if I want to place a stop at 1.06 and ride price lower, or exit at 1.05 and move my focus over to the GBP/CAD and EUR/HUF. I might place a tighter stop and see if price is able to maintain the momentum lower on the EUR/USD. The GBP/CAD, I do want to get into a 50k position before price pushes lower. I think this pair is going to take a while to push lower, but it is only a matter of time. If I am able to get into a max position on the GBP/CAD and have a stop at 1.60, my conviction will be strong is holding onto the pair until the 1.50 level. The EUR/HUF, again, I like the positive rollover interest, so if price ranges, I am fine with price doing that. If price does push lower, I may add to my positions, but I am just thinking about it for now. The GBP/CAD has negative rollover, so the EUR/HUF and EUR/USD with there positive rollover is offsetting the negative rollover on the GBP/CAD. If I am correct on the GBP/CAD and EUR/HUF, Silver is becoming extremely enticing to get into next, especially if price pushes below the 20 level. I think Silver will be able to hit the $50 level, but that will likely happen in 2025 because space, robotics, AI, medical, electric vehicles, and so on will require a ton of Silver, which is a better conductor than copper.

GBPJPY H4 - Long Trade SetupGBPJPY H4 - Amended the resistance price here and pushed it up a little to accommodate for the recent attempts upside (which we are now classing as resistance). A break above 140.600 and retest of 400 could set us up for a break and retest for upside continuations.

GBPCHF H4 - Long SetupGBPCHF H4 - Broke the interim support zone but now testing the more major zone, really strong RR here, we talk about this in the rundown now coming through.

EURCHF H4 - Short Trade SetupNow sitting on resistance, lets see what the eastern brings, if resistance holds and we see consolidation, this may be something we short tomorrow, EJ also on resistance after failing to set new highs.

AUDCAD H4 - Long Trade SetupAUDCAD H4 - I've marked on the bullish structure here because of the support significance, I think we should see a bullish reaction before breaking the neckline and potentially filling the double bottom, big fan of buying from support more so than selling from resistance, so usually catch an eye for these setups more than short setups. Just need to be patient for price to reach support and see what factors could influence (data/headlines/etc).

GBPAUD H4 - Long Trade SetupGBPAUD H4 - Still a little short from resistance, but looking for very similar play here to USDCAD, really nice RR, nice clean support zone, lets see if we can get some candlestick confirmation from support and trade back upside again.

EURGBP H4 - Long Trade SetupEURGBP H4 - Hasn't moved much, still hugging that trendline support and local support zone. Lots of consolidation over the last couple of days, gearing up for a nice break or burst soon I imagine.

EURNZD H4 - Short SetupEURNZD H4 - One from last week, just need to break current price/top to then push to the more significant S/R zone, from here we could prepare to take a short position.

EURGBP H1 - Short/Long SetupEURGBP H1 - Kind of ranging between the zones at the moment, support and resistance that is... Ideally looking to buy from support and sell from resistance as always, relatively clear zones, with just one support fakeout which we saw yesterday.

NZDUSD H1 - Long Trade SetupNZDUSD H1 - NFP later on today, so this may well cause a disturbance to ***USD pairs and USD*** pairs ahead of the data event. I'm personally inclined to just sit out of markets until NFP. Grab a scalp and wrap the week up and prepare for the next.

GBPJPY M30 - Short SetupGBPJPY M30 - Struggling to maintain this upside momentum on GJ. Could see a break of support, retest and correction down to our H1/H4 trendline support zone. Really nice RR if this breaks and retests nicely.

USDSEK hitting the support of channel | A good long opportunityPriceline of US Dollar / Swedish Krona forex pair is moving within an up channel and now hitting the channel's support.
MACD is strong bearish and stochastic is still not oversold so I would suggest to wait for MACD to turn weak bearish or for stochastic to give bull cross then take long position.
I have used Fibonacci sequence to set the targets:
Sell between: 9.71141 to 9.83034
Regards,
Atif Akbar (moon333)

USDTHB fomred bullish butterfly | Upto 4.5% bull move.Priceline of US Dollar / Thai Baht forex pair has formed a bullish butterfly pattern and entered in potential reversal zone to hit the sell target soon insha Allah.
This PRZ area is also a stop loss point, in case of complete candle stick closes below this area.
MACD is turning bullish, it was strong bearish now turned weak bearish.
RSI is oversold.
Stochastic is oversold.
Volume profile of complete pattern is showing less interest of traders at this area.
I have used Fibonacci sequence to set the targets:
Buy between: 30.772 to 30.397
Sell between: 31.064 to 31.770
Enjoy your profits and regards,
Atif Akbar (moon333)

AUDJPY to watchOANDA:AUDJPY
AUDJPY is approaching two important resistance levels on the 1hr.
Keep an eye out on a possible bounce from the current resistance level, or a push up to the higher resistance level.


usdchf quickk shorta great play here at the moment for USDCHF ... will continue to consolidate in the box. move stops to breakeven as quickly as possible for this trade as it is on a lower time frame of 1hr

