USD/CAD - 6C1! : Trade update FundamentalThe US dollar index (DXY) gained strength against major currencies on Monday following a landmark trade agreement between the United States and the European Union. During the meeting in Scotland on Sunday, President Donald Trump and European Commission President Ursula von der Leyen announced a new trade framework, which includes a 15% import tariff on EU goods—half of the 30% rate Trump had initially threatened to impose starting August 1.
The DXY opened higher at the start of the week, and it’s clear that most currencies are likely to see a decline in response. This trend also extends to pairs like the 6C1! (USDCAD), where the USD has been increasing its long positions. Last week, non-commercial traders added to their holdings, while commercial traders remain at their highest levels since 2021. Based on this setup, we are maintaining a bullish outlook and expect the continuation of our long position strategy.
Previous Idea :
✅ Please share your thoughts about USD/CAD in the comments section below and HIT LIKE if you appreciate my analysis. Don't forget to FOLLOW ME; you will help us a lot with this small contribution.
Forexn1

Copper: Trump Signs Tariffs on Imports Amid National Security...President Donald Trump signed a proclamation on Wednesday that imposes tariffs on copper imports, citing concerns over national security.
The White House announced that the new policy will introduce a 50% tariff on semi-finished copper products and other copper-derived goods that are highly dependent on the metal.
These tariffs are scheduled to come into effect on August 1, as outlined in a White House fact sheet.
In terms of market dynamics, copper is currently within a monthly demand zone, with a daily demand area also identified for setting pending orders. The potential impact on prices could be twofold: a possible upward movement driven by the discount effect on the metal, or continued decline following President Trump's announcement.
What are your thoughts on how these tariffs might influence copper prices moving forward?
✅ Please share your thoughts about HG1! in the comments section below and HIT LIKE if you appreciate my analysis. Don't forget to FOLLOW ME; you will help us a lot with this small contribution.

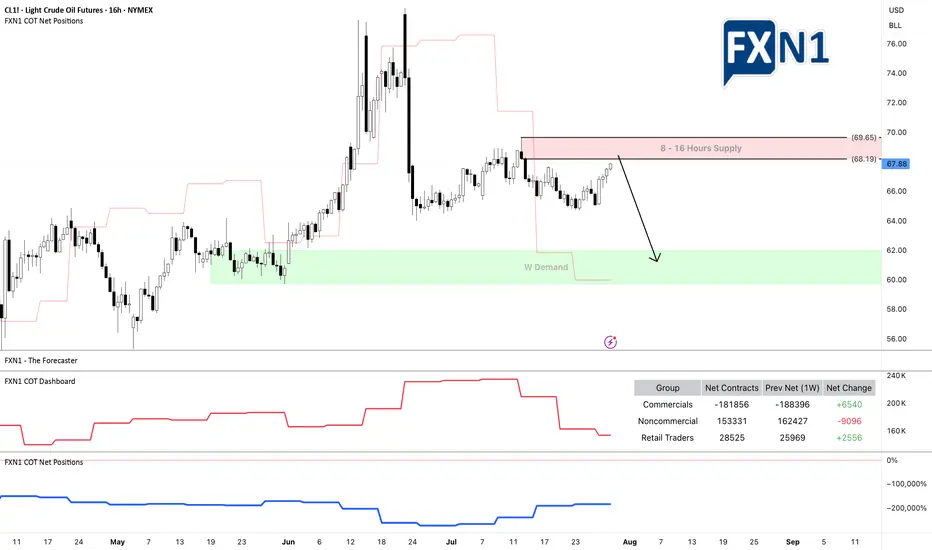
Oil Market Sentiment Shifts After Trump’s Urgent Warning, but...On June 23, 2025, at 9:35 AM, President Donald J. Trump issued a stark warning via social media:
"EVERYONE, KEEP OIL PRICES DOWN. I’M WATCHING! YOU’RE PLAYING RIGHT INTO THE HANDS OF THE ENEMY. DON’T DO IT!"
Since his post, oil prices experienced a notable bullish impulse. From both fundamental and technical perspectives, the market is now approaching a 16-hour supply zone, which could serve as a potential resistance area.
Additionally, I’ve observed a divergence in trader positioning: non-commercial traders increased their short positions significantly last week, while retail traders remain long. This divergence between price action and non-commercial positions suggests a possible shift in momentum, and I am currently eyeing a short setup.
As always, I encourage traders to conduct their own analysis. The trader featured below operates on the D1 timeframe and focuses on scalping, which can be useful for short-term entries.
Stay cautious and keep an eye on how the market reacts near the identified supply zone.
✅ Please share your thoughts about CL1! in the comments section below and HIT LIKE if you appreciate my analysis. Don't forget to FOLLOW ME; you will help us a lot with this small contribution.
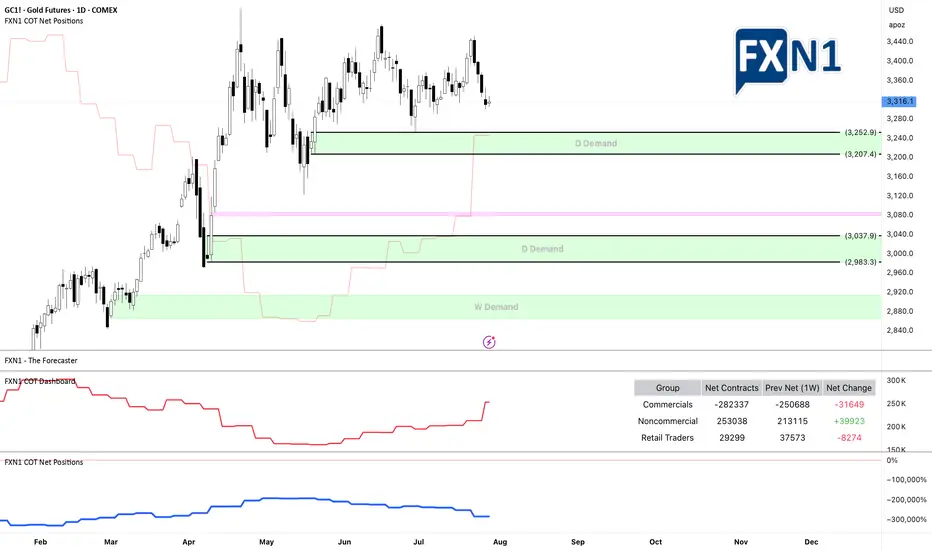
Gold Price Analysis (GC1! or XAU/USD): Challenges and OutlookSince reaching a historic high of $3,509 on April 22, 2025, gold has struggled to maintain its upward momentum. On the daily timeframe, the price experienced a sharp rejection spike after touching that peak, prompting a sideways range as the market seeks a clearer direction.
From a technical perspective, a stronger US dollar typically puts downward pressure on gold, making it a more expensive investment for holders. However, examining the chart of GC1! * alongside the DXY shows that even during periods of a robust dollar, gold has continued to rise. Additionally, recent years have seen seasonality effects on gold largely ignored, with the yellow metal persistently climbing. The underlying reasons are multifaceted, but a key factor is gold’s status as a safe-haven asset—investors prefer to hold gold during times of uncertainty and economic turmoil.
* GOLD and DXY correlation
Looking ahead, investors are awaiting the Federal Reserve’s upcoming monetary policy announcement scheduled for Wednesday. According to the CME FedWatch tool, the consensus is that the Fed will keep interest rates steady at 4.25%-4.50%, marking the fifth consecutive meeting with unchanged rates.
From both fundamental and technical viewpoints, recent data suggest a cautious outlook. Notably, non-commercial traders added nearly 40,000 long contracts last week, indicating bullish sentiment. Conversely, retail traders have reduced their positions, which could signal a potential shift in market dynamics.
The key question remains: where might be a strategic entry point if gold resumes its upward trend?
In the chart, I’ve highlighted two daily demand zones and a strong weekly demand area. There’s a possibility that the price may not revisit the weekly demand zone to accommodate new longs, instead triggering entry signals from one of the daily demand zones. I recommend adding these zones to your watchlist as potential entry points.
What are your thoughts? I look forward to your insights!
✅ Please share your thoughts about GC1! in the comments section below and HIT LIKE if you appreciate my analysis. Don't forget to FOLLOW ME; you will help us a lot with this small contribution.
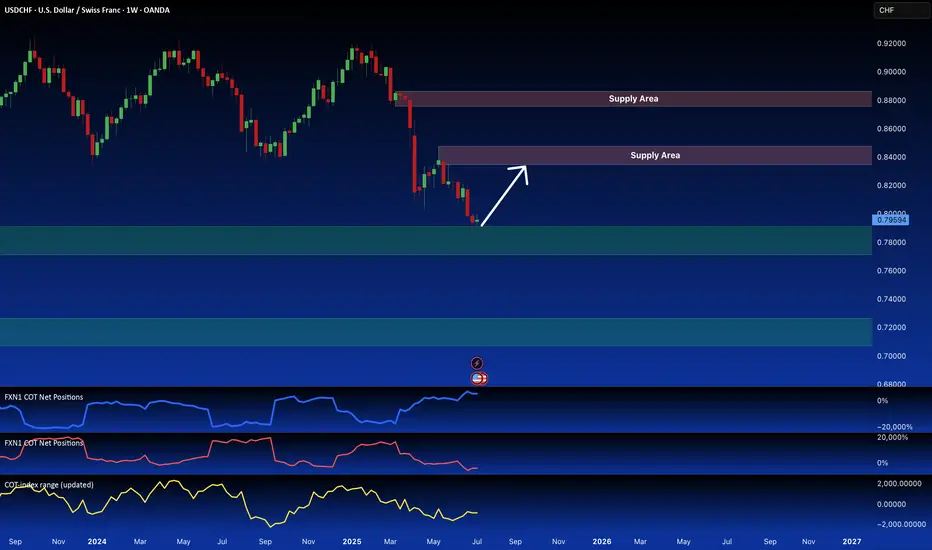
6S1! Futures Divergence Signals USD/CHF Long OpportunityI'm anticipating a bullish USD/CHF move. We're seeing a retest of a key daily demand zone, which is reinforced by a weekly supply area from the futures market (6S1! contract). Futures data suggests significant retail investor bullishness, contrasting with bearish positioning from commercial and hedge funds. This divergence suggests a potential long opportunity. I've also highlighted the next key demand area on the CFD USD/CHF chart.
✅ Please share your thoughts about 6S1! in the comments section below and HIT LIKE if you appreciate my analysis. Don't forget to FOLLOW ME; you will help us a lot with this small contribution.
DXY: USD Flexes Muscle - Pairs SlideFriday, July 25, 2025
The foreign exchange markets are experiencing a pronounced USD bullish session this morning, with the US Dollar Index (DXY) showing robust gains of +0.35% while simultaneously pressuring all major currency pairs into negative territory. The Japanese Yen (JPY) is bearing the brunt of this dollar strength, currently registering losses between -0.4% to -0.66% across JPY pairs. This market behavior suggests traders should pay particularly close attention to DXY dynamics, as its movements will likely dictate price action across all major currency pairs in today's session.
Technical Perspective: DXY at Critical Inflection Point
A detailed examination of the Dollar Index reveals several compelling technical factors that market participants should consider:
1. Weekly Demand Zone Reaction
- The DXY has demonstrated a strong rejection from a significant weekly demand area
- The subsequent bullish spike indicates potential continuation of upward momentum
- This price action suggests institutional buyers are defending this key level
2. Commitment of Traders (COT) Report Insights
Non-commercial traders (typically hedge funds and speculators) have increased their positions from a bottom level not seen since June 2021 meanwhile the Commercial traders (often corporations hedging FX exposure) show opposing extreme positioning. This stark divergence between trader categories often precedes significant market moves
3. Seasonal Patterns Favor USD Strength
- Historical seasonal analysis indicates the current period typically supports dollar appreciation
- The combination of technical and seasonal factors creates a potentially powerful bullish setup
✅ Please share your thoughts about DXY in the comments section below and HIT LIKE if you appreciate my analysis. Don't forget to FOLLOW ME; you will help us a lot with this small contribution.

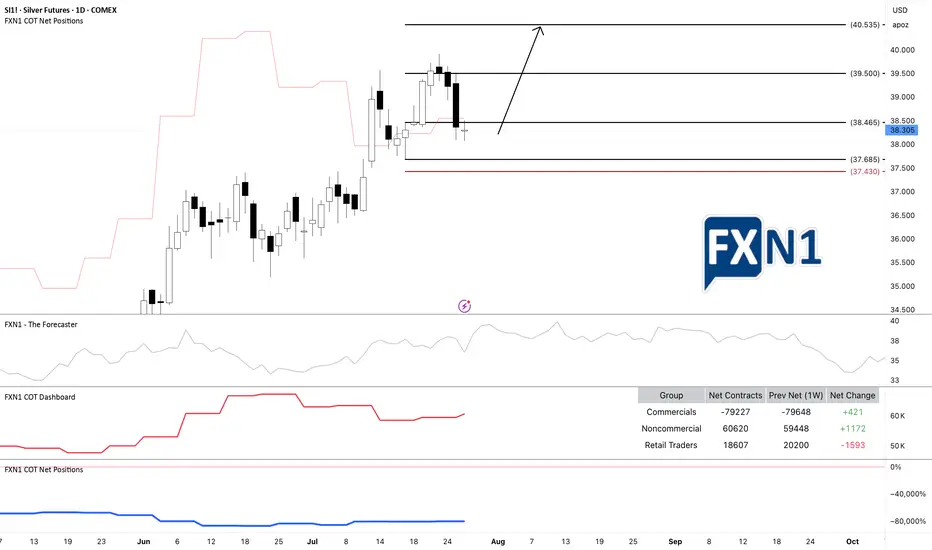
SI1!: Silver Demand Zone: Possible Bullish ContinuationI am currently observing a potential long-term continuation on SI1! Silver (XAG/USD), as the Commitment of Traders (COT) data indicates an increase in positions from both commercial and non-commercial traders. The price is approaching a demand zone on the daily chart, suggesting a possible bullish move.
The recent price action originated from an initial spike in the monthly supply zone, but there’s a possibility that the price could continue to rise further before reaching the next supply zone where a reversal might occur. Given the daily timeframe, I view this setup as suitable for a scalp trade. In my opinion, this presents an opportunity for short-term traders to capitalize on the potential upward movement.
✅ Please share your thoughts about SI1! in the comments section below and HIT LIKE if you appreciate my analysis. Don't forget to FOLLOW ME; you will help us a lot with this small contribution.
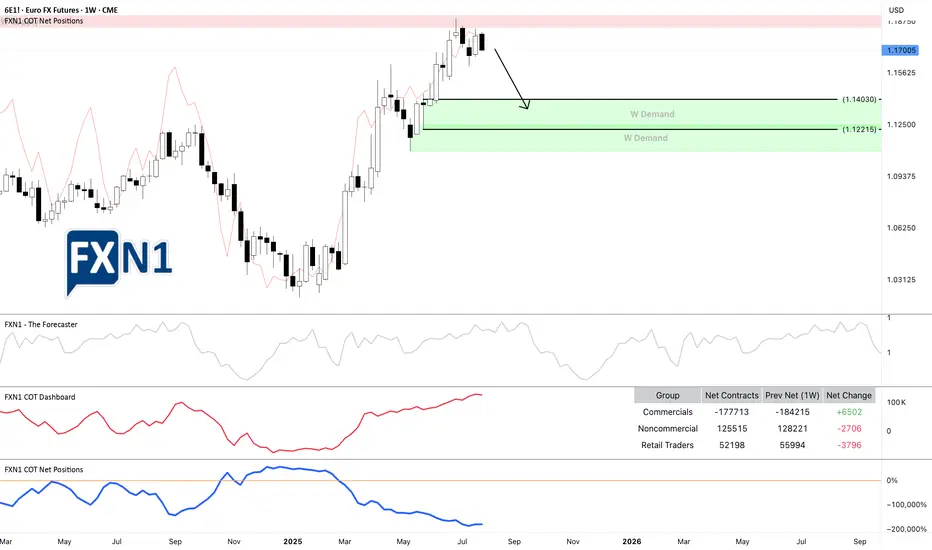
6E1!: Rebound at Weekly Supply Sparks Potential ReversalThe EURUSD (6E1! futures) experienced a rebound from a weekly supply zone * and now appears to be approaching a potential reversal toward a demand area. The overall picture is clear: we already capitalized on the rebound off the previous weekly supply zone, and at this point, we're simply observing the price as it approaches another key area of interest. It may be too late to initiate new short positions at this stage, but traders still holding shorts could potentially benefit from a continued move downward.
From a fundamental perspective, our Friday analysis of the DXY ** indicated the possibility of a bullish impulse, and today the US Dollar opened the session with a 0.58% gain. Currently, both commercial and non-commercial traders are aligned with the prevailing scenario. The most optimistic outlook suggests the price could decline to around 1.14030 over the coming weeks.
*
Previous analysis on EURUSD 6E1!
**
DXY Analysis
✅ Please share your thoughts about 6E1! in the comments section below and HIT LIKE if you appreciate my analysis. Don't forget to FOLLOW ME; you will help us a lot with this small contribution.
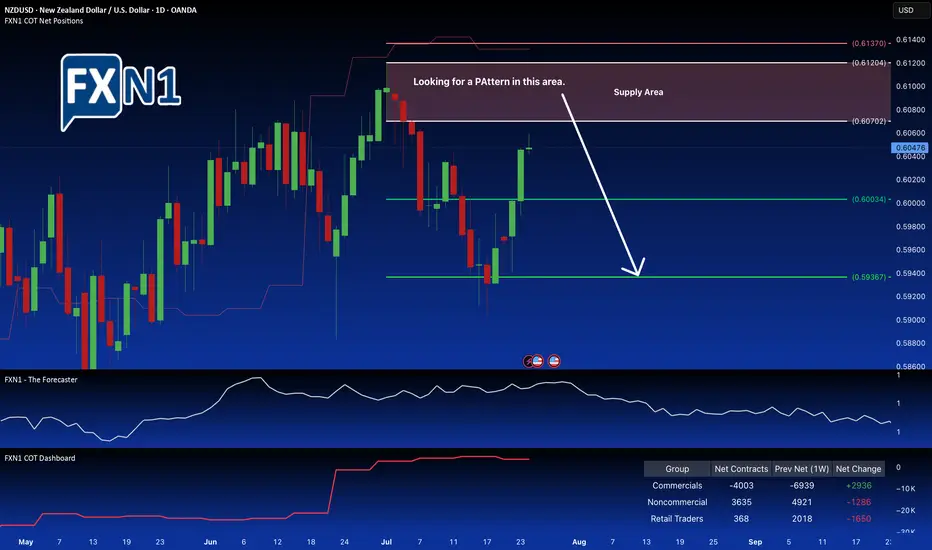
NZD/USD Weekly Bearish Trend Faces Critical Supply LevelThe NZD/USD pair is nearing a significant supply zone near 0.6070, where notable market activity is unfolding. Non-commercial traders are beginning to trim their holdings, signaling a potential shift in market sentiment. Conversely, commercial traders are at their lowest net positions since August 2024 and are starting to accumulate again, creating a divergence between these two groups.
This divergence, combined with the presence of a defined supply area and seasonal factors, suggests a possible reversal point in the current downtrend. On the weekly chart, the overall trend remains bearish, but the confluence of these technical and seasonal signals points toward a potential reversal pattern forming within the supply zone.
Traders may consider monitoring this area for signs of a reversal, potentially setting up for a short position if a clear pattern confirms the shift in momentum. Overall, the setup indicates a cautious opportunity for a bearish trade, provided the price action confirms the anticipated reversal.
✅ Please share your thoughts about NZD/USD in the comments section below and HIT LIKE if you appreciate my analysis. Don't forget to FOLLOW ME; you will help us a lot with this small contribution.
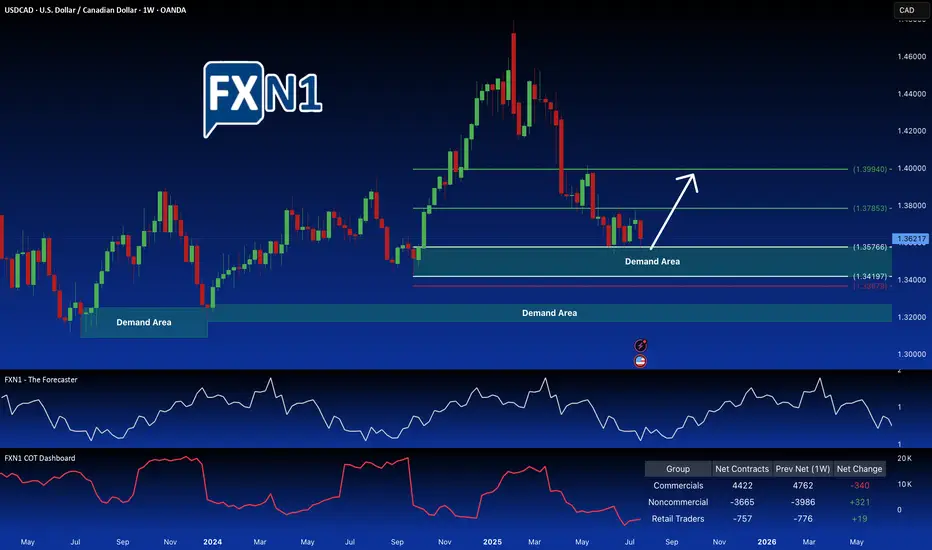
USDCAD Trade Idea: Potential for Further GainsI've initiated a long position on USDCAD at the retest of the key demand zone at 1.35766. Positive indicators support this trade: non-commercial traders are also accumulating long positions, and a notable shift is observed in the CAD futures market, with commercials moving from a bearish to a potentially bullish stance. Furthermore, seasonal trends favor a USD strengthening against the CAD. A further drop in price could present another attractive entry point at a lower demand zone.
✅ Please share your thoughts about USD/CAD in the comments section below and HIT LIKE if you appreciate my analysis. Don't forget to FOLLOW ME; you will help us a lot with this small contribution.
Cocoa Futures: CC1! Potential Pullback at Familiar Supply ZoneCocoa futures (CC1) are approaching a key demand zone previously tested in March 2025. This area, highlighted on the chart, presents a potential for a pullback, fueled by likely buy orders from commercial traders, as indicated by bullish sentiment evident in the latest Commitment of Traders (COT) report. We're watching for a reversal pattern within these highlighted zones, signaling a shift from the current upward trend. This anticipated pullback, driven by commercial market participation, could offer a compelling entry point for traders looking to capitalize on a potential reversal in the agricultural commodity.
✅ Please share your thoughts about CC1! in the comments section below and HIT LIKE if you appreciate my analysis. Don't forget to FOLLOW ME; you will help us a lot with this small contribution.

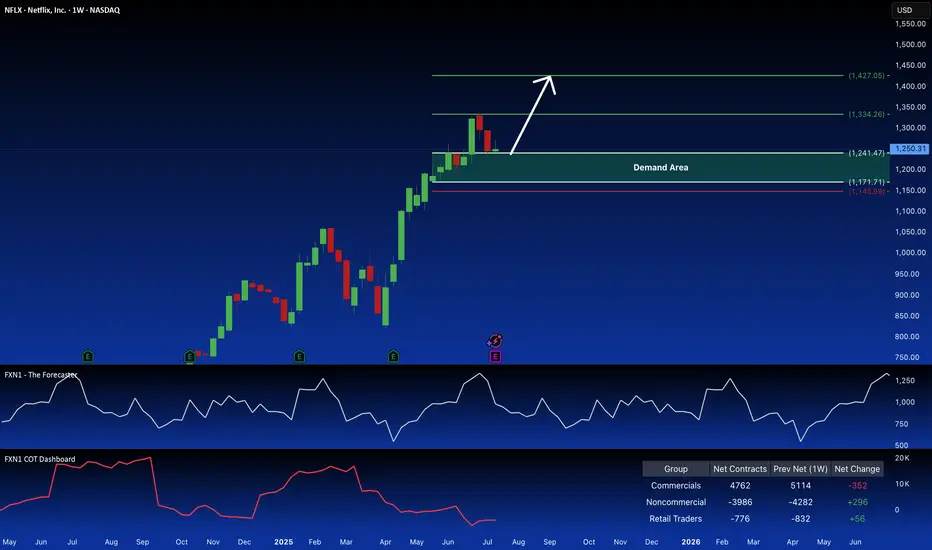
NFLX: Bullish Signal in Demand ZoneNetflix (NFLX) recently retraced within a key weekly demand zone, potentially presenting a long opportunity. Non-commercial traders are also accumulating long positions in the stock. This suggests a possible bullish setup. Your thoughts?
✅ Please share your thoughts about NFLX in the comments section below and HIT LIKE if you appreciate my analysis. Don't forget to FOLLOW ME; you will help us a lot with this small contribution.
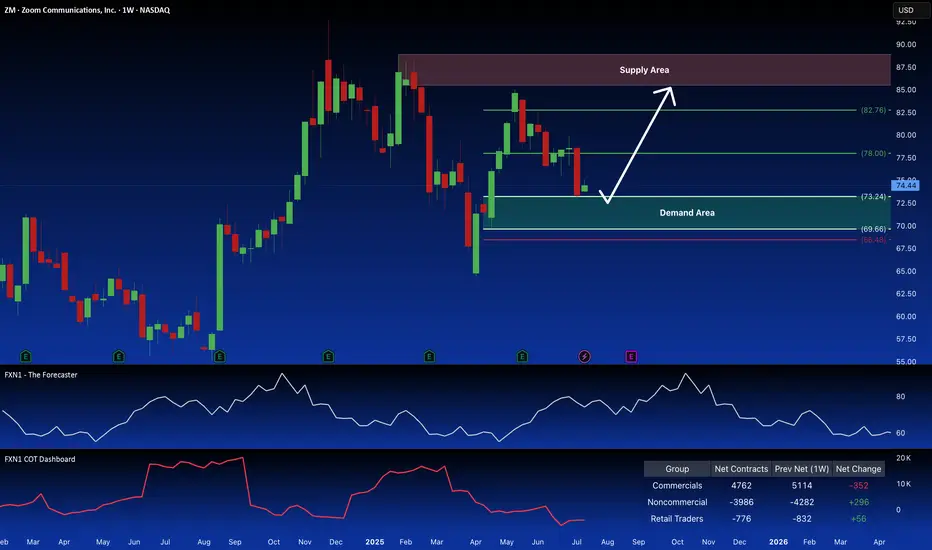
Zoom (ZM): Potential Long Setup at Demand ZoneZoom Video Communications (ZM) recently experienced a rejection at a key demand zone on its weekly chart. Non-commercial traders have increased their long positions, and forecasts suggest a potential upward trend. I'm considering a long trade setup based on a retest of that demand zone. What are your thoughts?
✅ Please share your thoughts about ZOOM in the comments section below and HIT LIKE if you appreciate my analysis. Don't forget to FOLLOW ME; you will help us a lot with this small contribution.
EUR/USD: Potential Decline Amidst US Dollar Strength and Econ...EUR/USD: Potential Decline Amidst US Dollar Strength and Economic Developments
As we delve into the forex markets, one of the most watched currency pairs, EUR/USD, is facing mounting pressures that could lead to further depreciation of the euro against the US dollar. A confluence of economic indicators, political shifts, and technical analysis suggests that the outlook for the euro may not be optimistic in the near term.
US Dollar: Strength from Political Winds
Recent trade activity surrounding the US dollar has gained traction, particularly as the Republican Party appears positioned to exercise substantial influence over the economic agenda. With a focus on implementing expansive tax cuts and trimming government spending, the potential for an invigorated US economy grows. This could lead to increased investor confidence in the greenback, bolstering demand and ultimately driving the EUR/USD pair lower.
Moreover, support for the US dollar may be further fortified by upcoming economic announcements. Today's schedule is packed with significant economic data, including the unemployment claims, the Federal Funds Rate decision, the FOMC Statement, and the FOMC Press Conference. Each of these factors will provide insight into the health of the US economy and the potential direction of monetary policy, likely impacting the dollar's trajectory.
Impact of Trump Tariffs on Europe
The economic climate in Europe could face challenges as the repercussions of Trump-era tariffs continue to reverberate. Concerns regarding sluggish growth rates in key Eurozone economies may prompt the European Central Bank (ECB) to adopt an even more accommodative stance. Analysts speculate that the ECB could consider cutting interest rates to near zero by 2025 if economic expansion remains tepid. Such a move would further weigh on the euro, making it less attractive to investors compared to a potentially rising dollar.
Technical Analysis: Possible Demand Area
From a technical perspective, the EUR/USD pair appears to be approaching another critical demand area. Recent Commitment of Traders (COT) data highlights a contrasting sentiment in the market, with retail traders predominantly holding bearish positions, while "smart money" seems to be accumulating long positions. This divergence can be a strong indicator of upcoming price movements.
Analysis of the daily footprint suggests that the price has recently reached and confirmed this demand zone, which may provide a potential reversal opportunity. In line with seasonal forecasting, traders may want to keep an eye on historical patterns that indicate a possible bullish surge.
Daily Footprint 6E1!
Crafting a Trading Plan
Given the myriad of factors at play, traders should align their strategies with their trading rules and risk tolerance. As the economic landscape evolves, the decisions made in the coming days and weeks will be crucial.
Monitor Economic Data: Pay close attention to today's economic releases. Positive data could further bolster the USD, while any sign of weakness in the Eurozone could hasten the depreciation of the euro.
Watch Technical Indicators: Keep an eye on key support and resistance levels. A sustained move below the current demand area could signal a bearish continuation.
Consider Seasonal Trends: Be aware of seasonal patterns that might indicate a potential bullish retracement. Market dynamics can shift quickly, so having a flexible plan is essential.
In conclusion, while the EUR/USD pair is currently under pressure, the interplay between political developments, economic indicators, and technical signals may create opportunities for discerning traders. Staying informed and adaptable is key as the market navigates through this evolving landscape.
Previous Idea closed:
✅ Please share your thoughts about EUR/USD in the comments section below and HIT LIKE if you appreciate my analysis. Don't forget to FOLLOW ME; you will help us a lot with this small contribution.

AUD/USD Maintains Strength Amid Positive Economic IndicatorsThe Australian Dollar (AUD/USD) continues to trade at elevated levels after experiencing notable gains in the previous session, predominantly fueled by the release of encouraging Purchasing Managers Index (PMI) data on Tuesday. This uptick in the currency reflects an optimistic outlook on Australia’s manufacturing and service sectors, bolstered by better-than-expected economic performance.
In a significant policy decision, the Reserve Bank of Australia (RBA) has opted to maintain the Official Cash Rate (OCR) at 4.35%. This decision marks the eighth consecutive month in which the RBA has paused its rate adjustments, signaling a careful approach as the central bank navigates the complexities of the current economic landscape. Analysts speculate that the RBA is likely to hold the current rates in its upcoming policy meeting, aiming for stability amid evolving economic conditions.
From a technical analysis perspective, recent price movements have indicated a rebound from key demand zones in the market, suggesting a potential shift toward a new bullish trend. Traders are paying close attention to seasonal patterns and the Commitment of Traders (COT) report, which reveals that retail investors continue to push for lower prices. This behavior often provides valuable insights into market sentiment and could indicate that a reversal may be on the horizon.
The confluence of improved economic indicators, steady monetary policy, and technical analysis suggesting a bullish trend makes the AUD/USD an asset worth watching. As investors remain alert to shifts in economic data and global market conditions, the Australian Dollar could present opportunities for those looking to capitalize on potential upward momentum in the near term.
In summary, the outlook for the Australian Dollar remains robust as it navigates through strong economic signals and a stable policy environment. Market participants are keenly observing developments in both the macroeconomic landscape and technical formations, which could shape trading strategies in the weeks to come.
✅ Please share your thoughts about AUD/USD in the comments section below and HIT LIKE if you appreciate my analysis. Don't forget to FOLLOW ME; you will help us a lot with this small contribution.

GBP/USD Strengthens Amid BoE Rate Cut Speculations and U.S. DataOn Friday, the GBP/USD currency pair exhibited a notable rise against its major counterparts, driven by a reassessment among traders regarding the anticipated interest rate cuts from the Bank of England (BoE) for the remainder of the year. Market sentiment has shifted as analysts speculate that the BoE is poised to implement a rate reduction in one of its forthcoming meetings in November or December. According to recent insights from Reuters, traders are now factoring in an 80% likelihood that the BoE will lower its key borrowing rates by 25 basis points (bps) on Thursday, bringing them down to 4.75%.
This potential rate cut comes amidst a backdrop of economic considerations that have traders on alert, particularly with the release of key U.S. employment figures today. The market will focus on the USD Average Hourly Earnings month-over-month data, Non-Farm Employment Change, and the Unemployment Rate. These indicators are critical and are expected to bring strong volatility to the markets. Current forecasts suggest a headwind for the USD, which could concurrently bolster the GBP against the euro and impact other pairs correlated with the DXY.
From a technical analysis perspective, GBP/USD has recently approached a significant demand area, which could serve as a springboard for upward movement. The Commitment of Traders (COT) report reflects a bearish sentiment among retail traders, indicating a broader market consensus that may be shifting. In contrast, "smart money"—institutional investors—appear to be accumulating long positions, potentially signaling a bullish outlook.
Adding another layer of complexity are seasonal trends, which historically suggest that the GBP/USD pair could be on the brink of a new bullish rally. Traders are now posed with a critical question: is the current price level the optimal entry point for long positions, or should they await a potential dip to a lower demand zone before committing their capital?
The outcome of today’s economic data releases will likely play a pivotal role in determining the short-term trajectory of the GBP/USD pair. Should the U.S. data disappoint, it may further sway sentiment toward the pound, while strong U.S. figures could dampen enthusiasm for the GBP, sparking further discussions around additional BoE rate cuts as the year draws to a close.
In conclusion, the interplay between central bank policies, economic data, and market sentiment is creating an intricate landscape for traders navigating the GBP/USD pair. With potential rate cuts on the horizon for the BoE and significant U.S. economic indicators set to be released, volatility is inevitable and positions are likely to adjust in response to these developments. As the trading day unfolds, all eyes will remain glued to the charts and economic reports, seeking clarity and direction in what promises to be a dynamic session.
✅ Please share your thoughts about GBP/SD in the comments section below and HIT LIKE if you appreciate my analysis. Don't forget to FOLLOW ME; you will help us a lot with this small contribution.

USD/CAD Analysis: Potential Retracement on Supply Area ContactThe USD/CAD has recently moved into a key supply area, prompting a watchful stance for a potential retracement. According to the latest Commitment of Traders (COT) report, there’s a clear divergence between retail and institutional sentiment: while retail traders remain bullish on USD/CAD, institutional investors, or "smart money," have started building bearish positions, indicating a possible shift in momentum.
Seasonal Forecast and Technical View
Seasonal analysis suggests an increased probability of bullish price action in USD/CAD, but given our current position in a supply area, the focus is on a corrective retracement rather than a sustained reversal. This is especially relevant for short-term traders looking to capitalize on minor pullbacks.
From a technical perspective, USD/CAD’s proximity to supply suggests a temporary exhaustion of the recent uptrend, allowing for a pullback within a controlled risk-reward framework. A tight stop loss is recommended here to protect against potential reversals should bullish seasonal tendencies overpower short-term retracement forces.
Trading Strategy
With a setup offering a strong risk-to-reward ratio, traders might consider a short position on USD/CAD with a focus on the retracement rather than a deep decline. Monitoring economic releases and potential changes in institutional positioning will be essential in determining whether the supply area holds, as well as to gauge the sustainability of any bearish retracement.
✅ Please share your thoughts about USD/CAD in the comments section below and HIT LIKE if you appreciate my analysis. Don't forget to FOLLOW ME; you will help us a lot with this small contribution.

WTI Dips as Israel Avoids Targeting Iran’s Oil: What’s Next?The West Texas Intermediate (WTI), the US crude oil benchmark, is trading around $70.60 during Thursday's London session. The price edged lower following reports that Israel has assured the United States it will not target Iran’s nuclear or oil facilities in its planned retaliatory attacks. This news, as reported by senior Biden administration officials and the Wall Street Journal, came after the US sought to prevent further escalation in the Middle East to avoid a potential surge in oil prices.
Geopolitical Tensions in the Middle East and Oil Prices
Oil markets have been on edge due to geopolitical tensions in the Middle East, particularly following the conflict between Israel and Hamas. Any potential retaliation involving Iran has been closely watched, given Iran’s role as a major oil producer in the region. Had Israel planned to target Iran’s oil infrastructure, it could have led to significant supply disruptions, pushing oil prices higher. For now, traders are breathing a sigh of relief with the promise from Israel to avoid targeting these facilities, but geopolitical tensions still remain a key factor that could influence WTI in the near future. Should tensions escalate further, WTI prices could quickly rebound on supply concerns.
OPEC and IEA Cut Global Oil Demand Forecasts
This week also brought another major development for oil markets as both the Organisation of the Petroleum Exporting Countries (OPEC) and the International Energy Agency (IEA) lowered their forecasts for global oil demand growth in 2024. The IEA now estimates global oil demand will grow by 1.2 million barrels per day (bpd), bringing total demand to 104.3 million bpd next year, which is 300,000 bpd below previous estimates.
These cuts are being driven by several factors, including the weakening global economic outlook and persistent challenges in key oil-consuming regions. In particular, China’s economic stimulus measures have failed to provide a meaningful boost to oil demand, further weighing on oil prices. This downward revision in demand growth expectations has created additional headwinds for crude oil prices, contributing to the recent decline in WTI.
Technical Outlook: Bearish Sentiment But Potential Long Retracement
From a technical standpoint, WTI is currently trading within a key demand area, suggesting that some buyers may step in to support prices. While the forecast based on seasonality points toward a bearish trend in the near term, there are some indications that a deeper long retracement could occur.
The Commitment of Traders (COT) report shows that institutional investors, also known as "smart money," are maintaining long positions, indicating potential underlying support for oil prices. This dynamic suggests that while prices may experience further pressure in the short term, a retracement to the upside could occur if demand for oil begins to pick up or if geopolitical tensions resurface with greater intensity.
Conclusion: WTI Traders Remain Cautious Amid Mixed Signals
For now, WTI remains in a delicate position, influenced by a mix of geopolitical risks, lower global demand forecasts, and technical factors. The assurance from Israel that its retaliatory strikes will avoid targeting Iran’s oil infrastructure has alleviated some immediate concerns about a spike in oil prices. However, the ongoing geopolitical situation remains fluid, and any sudden escalation could quickly reverse the current price trajectory.
At the same time, the reduced demand growth outlook from both OPEC and the IEA creates a bearish overhang for crude prices. With China’s stimulus measures failing to spark a meaningful recovery in demand, traders will be closely watching for any new developments that could shift the balance of supply and demand in the oil market.
In summary, WTI may continue to face downward pressure in the short term, but a potential long retracement remains on the table, especially if market conditions or geopolitical tensions shift in the coming days. For now, traders are likely to stay cautious, awaiting clearer signals before taking decisive positions.
✅ Please share your thoughts about WTI in the comments section below and HIT LIKE if you appreciate my analysis. Don't forget to FOLLOW ME; you will help us a lot with this small contribution.

EUR/USD Starts Tuesday with Optimism Amid Mixed Dollar StrengthThe EUR/USD pair opened Tuesday with a positive sentiment, trading at 1.08230 as of this writing. This follows a shaky start to the week for the US Dollar (USD), which initially showed strength but saw limited momentum as investors opted for caution, especially in the absence of major economic data or fundamental drivers early in the week.
ECB’s Cautious Tone Amid Inflation Progress
On Monday, ECB Vice President Luis de Guindos offered insights into the central bank’s view on inflation, noting that while there has been substantial progress in reducing inflation, it's premature to assume that the battle is over. His statements suggested that the ECB will maintain a flexible stance on monetary policy, leaving room for adjustments depending on economic developments. This cautious, yet open stance by the ECB may lend some support to the euro, as markets interpret the ECB's careful monitoring of inflation as a signal that interest rate hikes could still be in the realm of possibility.
Focus on U.S. JOLTS Job Openings Data
Later in the day, the US Bureau of Labor Statistics will release the JOLTS Job Openings data for September, which may influence USD sentiment. Markets are anticipating job openings to slightly decrease to 7.99 million, from 8.04 million in August. However, should the reading exceed expectations, particularly if it reaches 8.5 million or higher, it could reinforce USD strength as it would indicate continued labor market resilience—a key factor for the Federal Reserve's policy decisions. Conversely, a reading below 7.5 million might dampen USD appeal, as it would suggest cooling in the labor market, potentially leading the Fed to reconsider its tightening pace.
Technical Overview: EUR/USD Positioned Near Demand Zone
From a technical perspective, EUR/USD is showing some resilience around a demand zone, though it isn’t the strongest of support levels. The pair’s recent reaction in this area suggests some buying interest that could offer temporary support. Given this positioning, a long position might be worth considering if the upcoming JOLTS data provides a supportive backdrop by coming in below expectations, potentially weakening the USD.
On the other hand, if the data surprises on the upside, EUR/USD might test lower levels, and the demand zone’s strength could be challenged.
Conclusion
In summary, the EUR/USD outlook today hinges significantly on the JOLTS report, with the euro finding slight support from the ECB's cautious optimism on inflation. A supportive labor report could provide USD strength, but a weaker-than-expected report may favor euro bulls, positioning EUR/USD for further upside near current demand levels. With this dynamic, traders might consider waiting for the JOLTS data before committing to positions, using it as a potential trigger for directionality in this volatile environment.
✅ Please share your thoughts about EUR/USD in the comments section below and HIT LIKE if you appreciate my analysis. Don't forget to FOLLOW ME; you will help us a lot with this small contribution.

GBP/USD Turns Bearish: Analyzing the Key Factors Behind DeclineThe GBP/USD pair has recently turned bearish after reaching a significant Supply area around 1.3228. This level, clearly visible on the weekly chart, has proven to be a formidable resistance, halting the pair's upward momentum and reversing its course. As of today, GBP/USD is trading around 1.3125, marking a notable decline from the previous highs.
Weekly Chart
Economic Calendar and Market Sentiment
Today’s economic calendar highlights the USD ISM Manufacturing PMI, a critical indicator of economic health in the United States. As a leading indicator, the PMI reflects the purchasing managers' outlook, which can offer valuable insights into the overall economic sentiment. Businesses tend to react swiftly to market changes, making this data particularly relevant for understanding the current economic landscape.
In contrast, the UK's economic calendar is sparse this week, offering little to support the GBP. The lack of high-impact economic data leaves GBP traders focusing on external factors, particularly from the US. The US economic calendar, however, is packed with significant data releases, including the US Purchasing Managers Index (PMI) figures spread throughout the week. However, the spotlight remains on US labor data, with key prints scheduled for Thursday and Friday.
Thursday’s US ADP Employment Change will be the first major data release, serving as a precursor to Friday’s highly anticipated Non-Farm Payrolls (NFP). This week's labor market updates are crucial as they represent the last significant data points before the Federal Reserve's rate decision on September 18th.
Before these critical releases, the market will also be watching the US JOLTS job openings, scheduled for Wednesday. The JOLTS data is expected to remain steady near 8.1 million for July, closely aligning with the previous month’s figure of 8.184 million.
Technical and Sentiment Analysis: Indicators of Further Decline
From a technical perspective, the recent rejection from the 1.3228 Supply area signals a potential continuation of the bearish trend. In addition to this, the Commitments of Traders (COT) report reveals an interesting dynamic. Retail traders are currently extremely bullish on GBP, which often serves as a contrarian indicator, suggesting that a reversal might be on the horizon.
Seasonal trends also support the bearish outlook for GBP. Historically, this period tends to favor a continuation of the downtrend, aligning with the current market sentiment and technical indicators.
Conclusion: A Confluence of Factors Supporting the Bearish Outlook
The confluence of technical resistance at the Supply area, bearish seasonal trends, and contrarian sentiment indicators all point towards a continuation of the GBP/USD decline. As the market awaits critical economic data from the US, traders should remain cautious of further downside risks. The alignment of these factors underpins our bearish outlook on GBP/USD, reinforcing the idea that the pair may continue to trade lower in the near term.
OUR PREVIOUS FORECAST
✅ Please share your thoughts about GBP/USD in the comments section below and HIT LIKE if you appreciate my analysis. Don't forget to FOLLOW ME; you will help us a lot with this small contribution.

AU:Will Positive Aussie Labor Data Hold as US Retail Sales Loom?The Australian Dollar (AUD) found support on Thursday following the release of positive labor market data. Australia's Employment Change rose by 64.1K in September, bringing total employment to a record-high 14.52 million. This strong labor data has provided a temporary boost to the AUD, despite broader market uncertainties. However, traders remain cautious ahead of the anticipated US Retail Sales data, which is expected to show a 0.3% increase for September, up from 0.1% in the previous month.
Technical Analysis and Market Positioning
From a technical perspective, the Commitment of Traders (COT) report shows a clear divergence in market sentiment. Retail traders appear to be strongly bullish on the AUD/USD, while smart money (institutional investors) has taken a bearish stance. This discrepancy often signals the potential for market reversals, as institutional players are generally more adept at positioning ahead of key market moves.
Additionally, when looking at seasonality trends from the Forecaster and considering key Supply and Demand areas, there’s a possibility that the AUD/USD could experience a new drop. However, this is likely to occur after a brief retracement, as the market digests both the Australian labor data and the upcoming US economic figures.
Outlook and Strategy
For now, we are adopting a wait-and-see approach. Given the mixed signals from the COT report and the seasonal factors at play, we prefer to remain on the sidelines until the situation becomes clearer. The upcoming US Retail Sales data, along with other market-moving news, will likely provide further direction for the AUD/USD in the days ahead. Once the market reacts to these key events, we will reassess and consider potential trade setups accordingly.
Patience is key, as the next few days could bring more clarity after the news impacts play out.
✅ Please share your thoughts about AUD/USD in the comments section below and HIT LIKE if you appreciate my analysis. Don't forget to FOLLOW ME; you will help us a lot with this small contribution.

EUR/USD: Euro Gains Amid German Growth, Weak US GDPOn Wednesday, the Euro extended its rally, driven by positive economic data from Germany and the dampening effect of a weaker-than-expected US GDP figure. Germany’s Gross Domestic Product (GDP) recorded a modest 0.2% growth, indicating resilience in Europe’s largest economy. Furthermore, annual inflation in Germany, measured by the Consumer Price Index (CPI), showed a significant rise, moving up to 2% in October’s preliminary estimate from 1.6% in September. This uptick in inflation adds to the bullish sentiment surrounding the Euro, as it hints at economic stability and a possible need for continued monetary tightening in the Eurozone.
From a technical analysis perspective, the Euro remains in a profitable position from our identified demand area, where a reversal pattern was noted. The DXY (US Dollar Index) continues to retrace, suggesting potential weakening of the USD, while the COT (Commitments of Traders) report further supports our bullish Euro outlook. Given the ongoing trend, a negative reading in today’s US Unemployment Claims report could provide additional momentum for the Euro’s upward trajectory, potentially solidifying the current trend in favor of the Euro.
✅ Please share your thoughts about EUR/USD in the comments section below and HIT LIKE if you appreciate my analysis. Don't forget to FOLLOW ME; you will help us a lot with this small contribution.

Gold Price Hits New All-Time High Near $2,757 - Have a Look NextGold has once again proven its status as the ultimate safe-haven asset, recently reaching an all-time high just shy of the $2,757 mark. This surge comes amid rising geopolitical tensions and increasing expectations for further rate cuts by the US Federal Reserve. Despite a rise in US Treasury yields, the yellow metal's upward momentum remains strong as investors flock to it during times of uncertainty, highlighting its enduring appeal as a store of value.
Factors Behind Gold’s Historic Surge
1. Geopolitical Tensions
Global geopolitical risks have escalated recently, leading to a rush toward safe-haven assets like gold. Heightened conflicts in the Middle East and lingering tensions in Eastern Europe have fueled fears of broader market instability. Gold, historically seen as a hedge against geopolitical uncertainty, has been one of the primary beneficiaries as investors seek to protect their portfolios.
2. Expectations of Further Fed Rate Cuts
Market sentiment is increasingly tilting toward additional rate cuts by the Federal Reserve. The anticipation of lower interest rates typically supports gold prices, as lower rates reduce the opportunity cost of holding non-yielding assets like gold. With economic data pointing to slower growth and possible deflationary pressures, the Fed may be inclined to continue its dovish stance, further boosting gold’s appeal.
3. US Treasury Yields and Safe-Haven Demand
Even as US Treasury yields have risen, signaling expectations of a stronger US economy, gold's ascent has not been hindered. This decoupling suggests that other factors, like risk aversion and safe-haven demand, are currently driving the metal’s price. Growing fears of a potential Trump presidency in 2024 have added an extra layer of uncertainty, prompting investors to seek the stability that gold provides.
Technical Analysis: Is a Retracement on the Horizon?
From a technical standpoint, the recent surge in gold prices suggests that the metal may be poised for a near-term pullback. Here’s why:
Commitment of Traders (COT) Report Analysis:
According to the latest COT report, retail traders remain heavily bullish on gold, a potential contrarian indicator that often precedes a short-term price reversal. Meanwhile, the so-called "smart money" appears to be scaling back on long positions, suggesting a potential shift in sentiment.
Seasonal Forecast:
Seasonality patterns indicate that gold might be approaching a reversal phase. Historically, gold has shown a tendency to retrace after significant rallies, especially when retail sentiment becomes overly bullish. This seasonal forecast aligns with technical signals that suggest a possible correction.
Potential Retracement Levels:
If gold begins to retrace from current levels, key support zones to watch would include $2,700 and $2,650, where previous resistance levels could now act as support. Traders should keep a tight stop-loss to protect against potential downside risks, especially given the ongoing volatility in global markets.
Trading Strategy: Cautious Optimism with a Tight Stop-Loss
While the long-term outlook for gold remains bullish due to ongoing geopolitical uncertainties and monetary easing expectations, short-term traders should exercise caution. With the potential for a near-term pullback, the ideal strategy may involve waiting for a retracement to key support levels before considering new long positions.
Risk Management: Given the current elevated price levels, it’s crucial to maintain a tight stop-loss to manage potential downside risk.
Potential Reentry: If a retracement occurs, investors could look for signs of stabilization around the $2,650–$2,700 range before reentering the market.
Final Thoughts: A Bullish Long-Term Outlook with Short-Term Caution
Gold’s recent surge to near $2,750 highlights its role as a global safe haven amidst uncertainty. However, with retail sentiment leaning heavily bullish and the possibility of a technical correction looming, traders should remain cautious in the short term.
Despite the potential for a pullback, gold’s long-term fundamentals remain intact, driven by geopolitical risks, monetary policy expectations, and overall global economic uncertainty. As always, a balanced approach, considering both the fundamental and technical factors, will be essential to navigating the evolving landscape of gold trading.
✅ Please share your thoughts about GOLD in the comments section below and HIT LIKE if you appreciate my analysis. Don't forget to FOLLOW ME; you will help us a lot with this small contribution.
