BTC Ready to Start to 125KMorning folks,
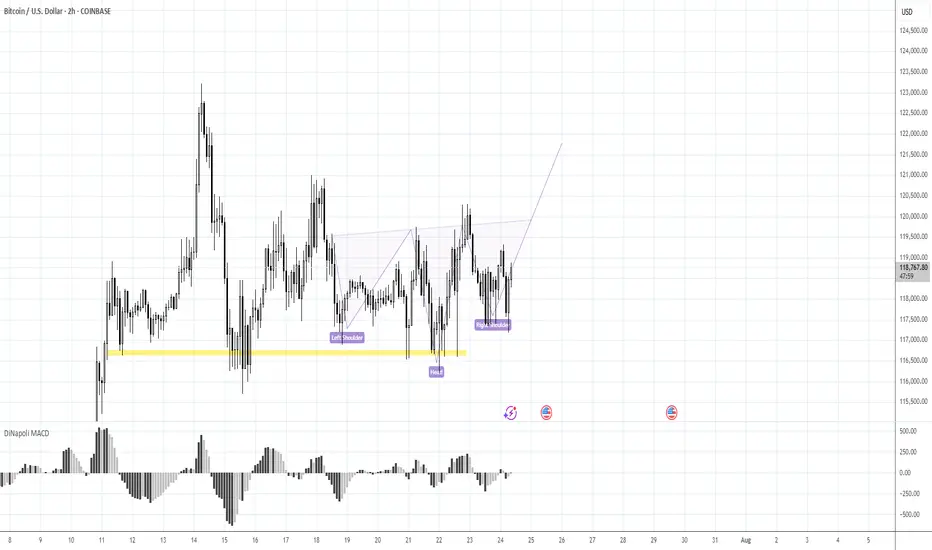
Better if you combine this update with previous idea. Now it seems that BTC stands in swamp action, flirting around 116K, which might be looking a bit bearish.
But by our view, this is not quite so. First is, triangle patterns as on daily chart as on 4H chart are look great and quite bullish. Pay attention that on 4H chart all sell-offs were bought out.
Our 1.16 lows that we set as vital ones for this scenario area still intact. So, it means that butterfly with 125K target that we discussed last time is also intact. I would say more. If you take a careful look at 1H chart - you could recognize reverse H&S pattern that could trigger all this stuff. It means that we're not in swamp, but at the point where the decision on long entry has to be made...
Take care
S.
Forexpeacearmy
Risk 116. Target 123-125KMorning folks,
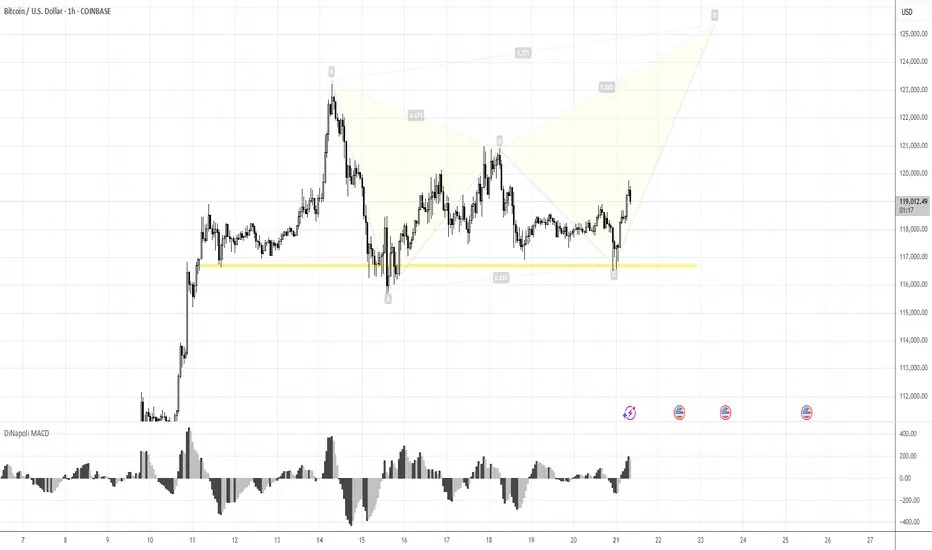
Prior 1H H&S was done, we were watching on 120K resistance area, as we said last time. Now, on 1H chart H&S is showing signs of failure - too extended right arm, no downside breakout. Price is taking the shape of triangle . All these signs are bullish. Because butterflies very often appear on a ruins of H&S, we suggest that this one could be formed here...
The risk level for this scenario is 116K lows - BTC has to stay above it to keep butterfly (and triangle) valid, otherwise, deeper retracement to 112K area could start.
Upside target starts from 123K top and up to 125K butterfly target.
120K is the Key.Morning folks,
Our last plan worked perfect - market re-tested 117K support and jumped out. If you have longs - you could keep it.
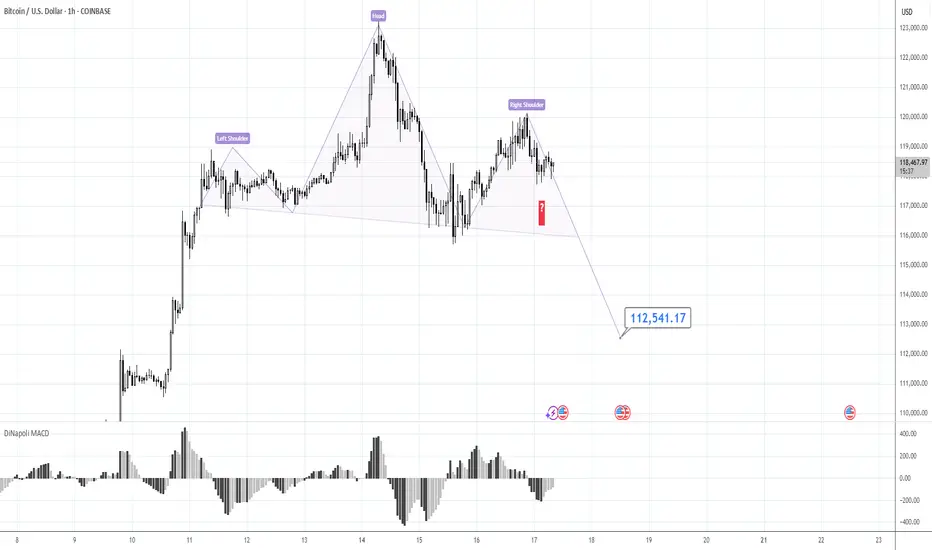
We consider now two alternative scenarios, although we think that this one with triangle is more probable, we do not exclude the H&S shape on 1H chart that could lead BTC down to 112-113K support area.
So, if you do not know how to deal with this - keep an eye on the 120K area and top of the right arm. Upside breakout will confirm H&S failure and triangle scenario. Otherwise, until market stands under 120K - consider H&S as a basic scenario, just for safety.
Take care, S.
127KMorning folks,
So, BTC shows even better performance that we thought, although it obviously something stands behind, this is not market-natural motion. Anyway, we consider 127K level as all-time nearest target that stands on monthly chart.
If any pullback starts (BTC now is at daily overbought and near Yearly Resistance Pivot), we keep an eye on 117.2K and 113.5K levels to decide on long entry

115.70K is the next one, 107K - RiskMorning folks,
Just to keep it short... our butterfly worked perfect, we've got our 111.65K target. Overall sentiment stands bullish. But - we do not want to see just stops grabbing around the top (aka Wash&Rinse). We want stable standing above broken daily trendline out of the flag consolidation .
So BTC has to stay above 107K lows to keep bullish context valid. That's why, if you plan to buy - you do not need to consider too far standing levels and lows for stop placement.
If, still, BTC drops under 107K, we suggest deeper retracement, under 100K level.
Conversely, if everything goes as we plan, next upside target is 115.70K.
So, if you plan to Buy: use local deeps on 1H chart and control 107K lows. This is your invalidation point.
If you want to sell: watch for clear signs of W&R of the top - engulfing patterns, spikes etc and following reversal patterns on 1h chart. Say, H&S, or any other.
For now I mark this setup as bullish.

111.65 against 105KMorning folks,
So we've got great entry with our H&S but it is early to relax. To avoid long explanations - BTC has to stay above 105K lows to keep current tendency valid. So, if you still plan to buy BTC here - you do not need to watch for too deep standing Fib levels.
If BTC will still drop below 105K, we could get extended downside action to 100K and maybe even deeper.
Nearest upside target with our current plan is 111.65K.

Wait for something more reliableMorning folks,
Since our last update action was anemic. Nothing has changed seriously. BTC was able to show just minor upside action. Based on current performance, I do not want to take long position right here and prefer to wait for something more reliable. Because BTC action stands rather different from the one that we expected to see.
For example it might be H&S pattern on 1H chart. Thus, an area around 103K seems the one that we will keep an eye on.

110K, maybe 112K at the bestMorning folks,
So, previous setup is done perfect, and BTC even reached 108K area. Now we think that upside potential is limited, at least in short-term. Price is coming to resistance area around 110K and previous top. Some intraday targets point on 112K area as well, but I wouldn't count now on something more extended.
The point is US Dollar stands at record monthly Oversold. So, its weakness in short term is limited as well. Besides, we're coming to very bumpy period of tariffs negotiations from 9th of July, debt ceil discussion and BBB voting, as early as tomorrow...
So for now, uncertainty and risk overcome the upside potential on BTC.

103 to 101K trade and reverse H&S patternMorning folks,
So, our Thu setup is done perfect, both targets are met and even more. Now we consider two different fast trades on BTC.
Now context remains bearish and 103K is rather strong 4H resistance area. So, first trade is scalp "Sell" from ~ 103K with "at least" target of 101K. In fact, choosing of 101K as a minimal target is based on the 2nd trade.
2nd trade is potential reverse H&S is sentiment on the market will start changing. But this is not the fact yet. That's why I place downside arrow here as well, if H&S will not be formed or start failing, BTC could drop lower so, downside trade might be even better.

99K and 97.5K potential targetsMorning folks,
As you can see, not occasionally last time we chose only nearest 107K and 109K targets. Market indeed looks a bit heavy. Now short-term context turns bearish and we consider reaching of 99K target as rather high. Next potential target area is 97.K - butterfly target and daily Fib support.
Obviously now we do not consider any new longs and need some clear signs of sentiment changing, that we do not have by far. Let's see what will happen around support area

107.6-107.8 and 109-110KMorning folks,
So, position taking stage is done, now let's take a look at targets. In general we have a sequence of a few targets, starting from 107.6-107.8, 109-110, 113 and 116K. But in current situation I would watch for only first two.
Daily overbought is around 114, so 116K target seems too far. 113K is possible, but with rather extended downside action last week, it seems as very optimistic. That's why, more or less base case seems around 109-110K, while the easiest target is 107.6-107.8K.
So, once the first target will be reached - think about partial profit booking, if you want to continue trading. Say, take off 30-40% and move stops to the breakeven on the rest.

106.5K and 104.5KMorning folks,
As we've suggested upward action happened. Now overall situation stands relatively easy to understand. 100K seems like short-term vital area for upside tendency. While two support levels of 106.5K and 104.5K are those which market has to hold to keep tendency intact.
I would even prefer 106.5K area because this is also natural support line and because it agrees with downside AB-CD 1.618 extension target.

BTC 1H Reverse H&S Morning folks,
So, drop is done due to Trump-Musk conflict, although we haven't called to trade it. Anyway, current picture is much better and doesn't need a lot of comments. We have reverse H&S in progress, with potential area for entry around 102.5-103K where we expect the right arm should appear. Invalidation point is ~100K (bottom of the head).

Weak bearish contextMorning folks,
Not many changes since our last discussion. Yes BTC moved slightly lower, as we suggested, but you can see by yourself - action is very slow and lazy. Usually when bears control the market, action has to be stronger.
It means that overall context remains bearish but it is weak and not very attractive for trading, although it is not forbidden of course. We consider upside breakout of 107-108K area as a vital moment for this context. While downside target is around 97-98K.

98-101KMorning folks,
Last time BTC was not able to provide the direction as it was standing in triangle and we prepared "neutral" update, waiting for triangle breakout.
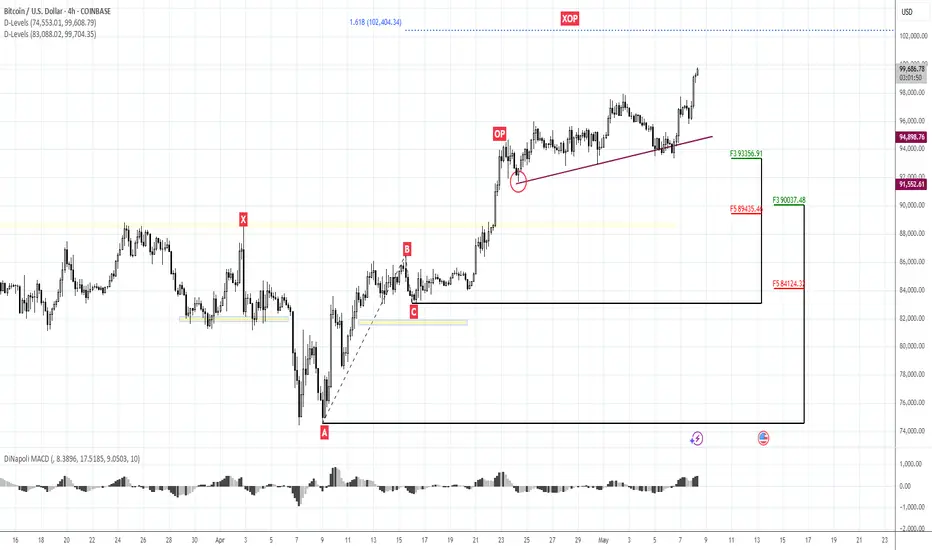
Now we see that this has happened to the downside and market just stands slightly above XOP target. So we consider 98-101K area as the nearest target.
Second, once (and if) this action will be over - take look at H&S, and it could trigger stronger downside retracement. This it turn might be quite welcome for weekly reverse H&S pattern .
That's being said, the first step that we're watching - is down to the potential neckline around 98-101K. Then we decided for to do next.

Minor advantage on the bullish sideMorning folks,
So, downside AB-CD action is started as we suggested. But, it is very slow and going heavy. Appearing of triangle shape here and early signs of bullish dynamic pressure on daily chart turns the balance slightly on the bullish side.
Still, we do not have yet any clear patterns that makes us sure. So, if you're conservative - it would be better to wait a bit. If you still want to buy inside the triangle - it would be better to place initial stop below OP target, just not to be washed out occasionally, if AB=CD will be completed. Because it doesn't break the bullish context but could give us "222' Buy instead.

Intraday scenariosMorning folks,
Now we do not see yet any background for a "big game". Market needs time to manifest the next step. We said previously that it might be either direct upside action or big reverse H&S on weekly chart.
Now it is too few time passed to understand this. On a daily chart we have bearish context and engulfing pattern. So all that we have for Mon-Tue is an intraday downside AB=CD setup with ~104 and 101K targets.

118.75KMorning folks,
So, last time BTC was not able to show retracement that we've suggested. In fact by the end of the session, no reversal day was formed. It was some fake alarm. Our long-term 110K target has been completed, so monthly grabber has reached the minimum target.
But for now we see nothing to do. We consider no shorts. Market stands confidently around the top, without sharp drop back, it is not at overbought or at some strong resistance, so it could keep going higher. Next our upside target is 118.75K. So we could keep existed longs, just don't forget to manage stops.
If downside pullback still starts it might become good chance for long entry again. Market now is driven by rebalancing portfolios of big funds that have to sell US assets as they lost AAA rating. This explains why dollar is falling while yields are raising. This is not fast process and probably will last for some time more.

Deeper retracement is possible. 104-105.2 for short entryMorning folks,
So, last setup worked just partially - action started from 101K as suggested but BTC completed only 1.27 butterfly target, showing sharp reversal.
Current reversal is important because market is neither on some target, resistance or overbought. It means that reversal is driven by external factors. Although our long-term bullish view is still valid, with "at least" 110K target, the road to the target might be bumpy, with moderate pullback first.
It means that right now weekly/daily traders should sit on the hands and wait when retracement will be over. While daily/intraday traders could consider short entry from 104-105.2K resistance area by our view.

110-111KMorning folks,
So, everything goes with the plan and we still consider 110-111K area as the nearest target.
At the same time this area agrees with weekly and daily overbought, so direct upside breakout hardly possible.
Naturally, when the market is already near the target it doesn't show deep retracement. Thus, we suggest that either upward action continues right from flag shape or 101K support. 98K support area looks cool, but it is more for stop placement and invalidation level rather than for expecting of real retracement there.

102.5K nearest upside target. 110K is the next oneMorning folks,
So, the pullback to 88-89K area that we discussed last time has not happened. Market turns to direct upside continuation. Now it has no big barriers ahead, which means that 110K is the major target for now.
On Intraday charts we have another one - 102.5K which is the nearest one. We consider no shorts by far. For long entry you could use any deep that you would like to. We suggest that 97.50-98K area is quite suitable for this. Deeper retracement will look suspicious.
Watching for 88.5-89KMorning folks,
So, upside spike has happened and our 3-Drive + butterfly patterns are done. Although we haven't got continuation to 98K area that also was on a table.
Now short-term sentiment has changed. Recent data shows that the Fed doesn't need to hurry up with rate cut, yields turns up, so BTC also could follow the common tendency with deeper retracement.
This is the reason why we do not consider any longs today. As a nearest area that might be reached we consider 88.5-89K support.
So, for bulls it is nothing to do. If you're intraday trader, you could consider bearish positions from predefined Fib levels on the picture. 3-Drive hasn't reached its target yet, so 92.5-93K area still could be reached...

98+ actionMorning folks,
So, market mostly stands at the same place where we leave it last time :)
But now our monthly bullish pattern is officially confirmed, so mid term direction is up with 110K target at least and potential progress up to 127K.
Now we see a lot of minor bullish signs pointing on upside breakout attempt. Last time we talked about 3-Drive, but today it seems that it could go out of its limits. Not just to 97K but up to 103 K AB-CD upside target.
Until price is above 91.5K lows we do not consider any shorts. Following expected downside pullback is still on the table but not for this week probably. We return to it later as soon as upside action will be over.
