2 days - collapse stands stableMorning guys,
Action on BTC is so strong that we do not need even intraday charts now. As we've mentioned recently, BTC has no meaningful technical supports any more - only extension targets and oversold levels.
Thus, next area is 4400$ 1.27 weekly butterfly target and 4100$ daily 1.618 butterfly + oversold area. Maybe there some retracement will take place.
Our ulitmate weekly targe stands around 1820$. We've mentioned it in yesterday's video.
Forexpeacearmy

5000$ on horizonMorning guys,
On Friday we've talked about potential retracement that BTC could form reverse H&S. But, it was not formed. Current price action lets us think that downside tendency should continue.
Our next target is ~5000$ - 1.618 butterfly on 4H chart and 1.27 of daily butterfly.
For more extended targets and wider analysis - watch daily video on our website.

BTC needs reliefMorning guys,
As we've said, market has completed few long-term targets and yesterday has re-tested daily Oversold for 2nd time. Although long-term view, as well as momentum still stand bearish - BTC needs relief.
IT could happen by reverse H&S pattern that is forming there with upside potential to 5/8 Resistance around 5900$ area

Mining breakeven point?Morning guys,
So, our long-term weekly trage that we've talked about in recent 2-3 months has been mostly reached (just 100$ difference). Collapse was really miserable.
BTC has completed our daily butterfly as well and now stands oversold on daily chart. There is definitely some kind of shock exists here, which turn BTC to some time of flat action and retracement.
But, since drop was really miserable, we do not exclude downside continuation a bit later.
Today, it is possible AB=CD retracement on hourly chart somewhere to 5800$. But what is really interesting - what will happen with mining. BTC stands around global average price of mining. How crypto world will react on this moment,
what will happen with mining and what impact on BTC price will follow. It needs some time for accompdation to this price.
So, as on Bitfinex action, as on yesterday collapse - we expect some silience in trading while investors will come in habit with a new reality and new prices of BTC.
you can see daily videos on BTC on our website, with more charts in it.

Some Psychological issues on BTCMorning guys,
As you know we keep long-term bearish view on bitcoin market. Previously we've discussed a lot of patterns that chould be formed here - daily butterfly with 5800 target and 4H one with 6100 just to name some.
Today we would like to talk on psychological backround of BTC situation. It has started on Bitfinex collapse and explosive demand for crypto. Many traders said "at last", we're at the the eve of upside reversal.
But close look at what has happened after that makes us think that sentiment is mostly bearish here. This huge rally has not become a starting point of upside continuation. Market stands inside its range for 2 months but never moves in upper half of the range. This week on downside action major trendline support has been broken and price is coming to the range's lows for second time.
We suggest that this time these lows will be broken. Taking in consideration exceptional role of huge candles - when they are broken, market follows in the direction of breakout, usually on a distance equals to the range.
It means that this should lead us somewhere to 5600 $ area, which stands close to our daily target.

setup for short entryMorning guys,
BTC confirms our bearish expectation by far and now is coiling around major 5/8 Fib support, although mostly it has broken already.
Widening triangle is forming. Usually it breakout starts from inability of the market to reach upper border.
In this case we could watch for "222" Sell pattern and it could become nice background for entry on short side against recent top

EUR will drop to 1.12 area next weekMorning guys,
At first glance overall momentum and sentiment looks bullish for EUR, but we see alternative factors from US 10 year yield jump, short-term
sentiment analysis and dollar index price behavior.
Thus, instead of upside bounce from 1.1360 and forming reverse H&S pattern, we mostly expect to see big 1.618 3-Drive "Buy" and drop to 1.12-1.1230 area next week. Maybe Nov 8th Fed meeting will become major driving factor of this process.

Downside action should continueMorning everybody,
BTC has broken two strong support level which were crucial for keeping bullish scenario valid. Now market looks weak and price stands at last major 5/8 support level. The manner how market response this level looks weak and this lets us think that downside action should continue.
As a result we expect to see either AB-CD or, ultimately Butterfly pattern here in nearest time.

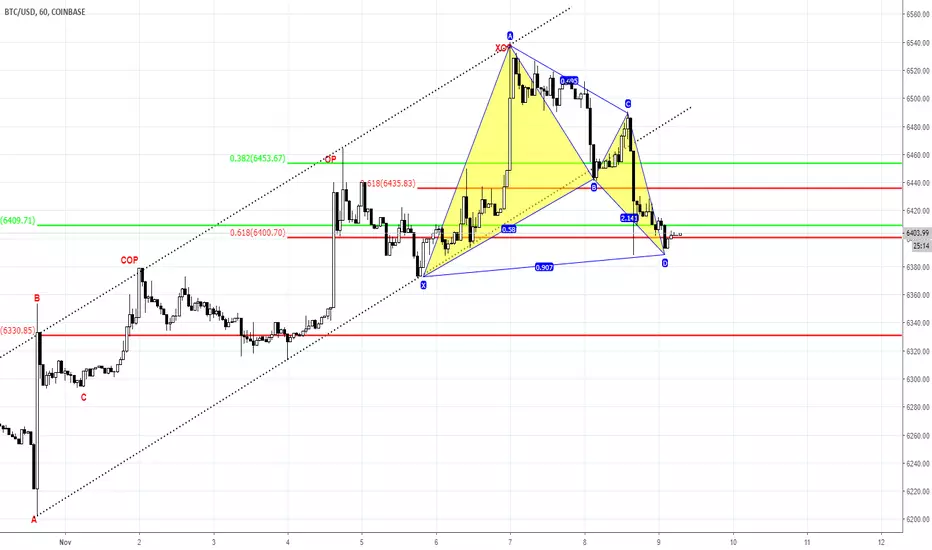
Last chance for bullsMorning guys,
Yesterday we've said that BTC has to hold above major K-support area to keep bullish sentiment. Despite dollar-supportive Fed decision yesterday, BTC was able to stay above major K-support
and formed "222" Buy pattern. Currently I'm not sure on real upside continuation, as upside channel has been broken, but minor pullback as respect of this area is possible, somewhere to 6450 area.
At the same time, we do not like sighs of acceleration in downside action in recent 2 session. As our long-term view is bearish on BTC and we treat this action just as a retracement, adding mostly dollar supportive
sentiment on the traditional markets - we suggest with high degree that downside action on next week will continue.
Right now market stands at final bullish outpost. So, if you still would like to go long - that's the last area and bullish invalidation point. Breaking of this support will turn technical picture bearish.
We still suggest move stop to breakeven asap on any long position here as foundation for BTC appreciation looks fragile.
Moment of truth for BTCMorning guys,
Market has reached our predefined retracement target. In fact, we have side by side two K-support areas and for BTC it is crucial to hold above 6400$ to keep bullish sentiment.
Otherwise, market will form bearish reversal swing, which could mean deeper retracement, at least or, even downside reversal.
So, market right now stands at the point which gives perfect risk/reward ratio, because this is also invalidation point for short-term bullish setup. Taking position here doesn't promise you success, but it does promise
minimum loss in case on short-term trend breaking.
Today's Fed results will be major driving factor, I suppose.

Next is 6600 targetMorning everybody,
Our previous entry was OK, market has hit first 5500 target which is 1.618 AB-CD on hourly chart.
Still we have daily 0.618 AB-CD extension that stands around 6600$. Besides, as BTC has broken rectangle upside, it should pass its width in the same direction and it also points on 6600$.
Here we could try to apply the same strategy - trying to take position at lower border of the channel, which also will be K-support area.

6300 support area is the key to performanceMorning guys,
Although longer-term picture still stands bearish, in shorter-term trend has turned bullish and bitcoin has returned in flat consolidation
that has been broken last week. This makes possible to reach 6500 first - upper border of consolidation and later 6600 - AB-CD 0.618 target on daily chart.
But, to complete this, we need to keep an eye on hourly chart and 6300 strong support and channel border in particular. To keep bullish sentiment market has to hold above this area and turn up. Downside breakout will erase short-term bullish scenario. So, 6300-6400 area is very good for long entry as it gives best risk/reward ratio, because this area is also an invalidation point.

Pullback todayMorning guys,
Market almost has hit our minor 6400 COP target that we've mentinoed today on our forum. Still, it is not enough to break bearish context yet.
Despite recent upside action, market was not able to return in rectangle consolidation yet, and in fact, stands in range of the collapse that has happened on Monday.
Since we have "222" Sell pattern here, on 1H chart, and COP target has been hit - at least 3/8 pullback should follow.
Depending on retracement depth, we will see, should we expect any other upside action in nearest future.
Another warning moment is possible bearish grabber that could be formed today on daily chart.

6030 drop is a first step to 5100$ targetMorning guys,
We keep our long-term bearish view on BTC with 5100 extended target. Meantime, we wide daily AB=CD 6034$ target and it seems that it will be first destination point.
Yesterday we've discussed scenarios of short entry and thought that pullback to 5/8 resistance might be good way to sell the rally, but now, on houry chart we have
pennant/triangle consolidation with signs of bearish dynamic pressure, which suggests drop right from current levels.
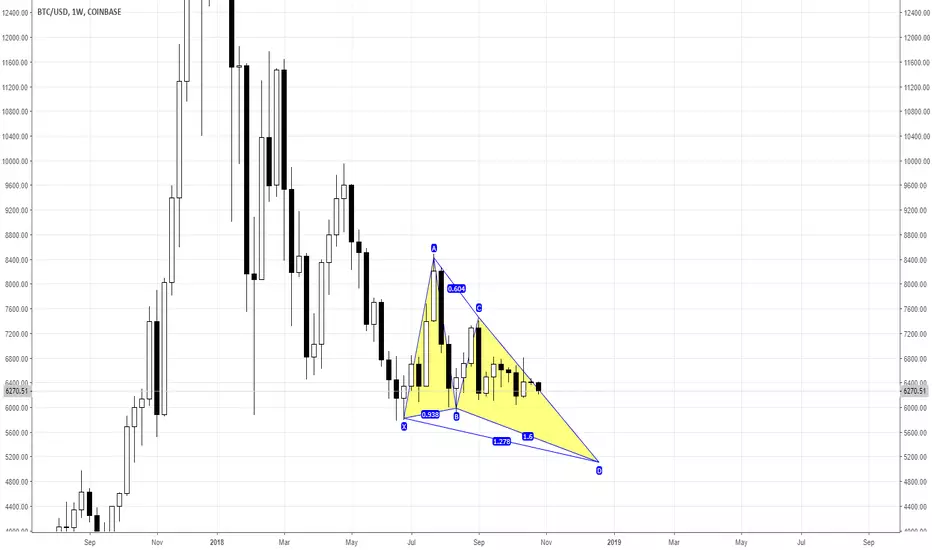
5100$ target for BTCMorning everybody,
finally we've got an action on BTC market, which confirms our bearish view. We think that BTC now stands under scrutiny revaluation by investors, and not in positive direction.
Fundamentally we do not see any long-term supportive factor for BTC.
Technically, weekly chart shows clear signs of bearish dynamic pressure. While MACD trend stands bullish, price is forming lower tops. Within few weeks we think that BTC will hit 5100 target of weekly butterfly.
Today upside retracement to 6330$ 5/8 Fib resistance is possible, which we think should be good area for short entry
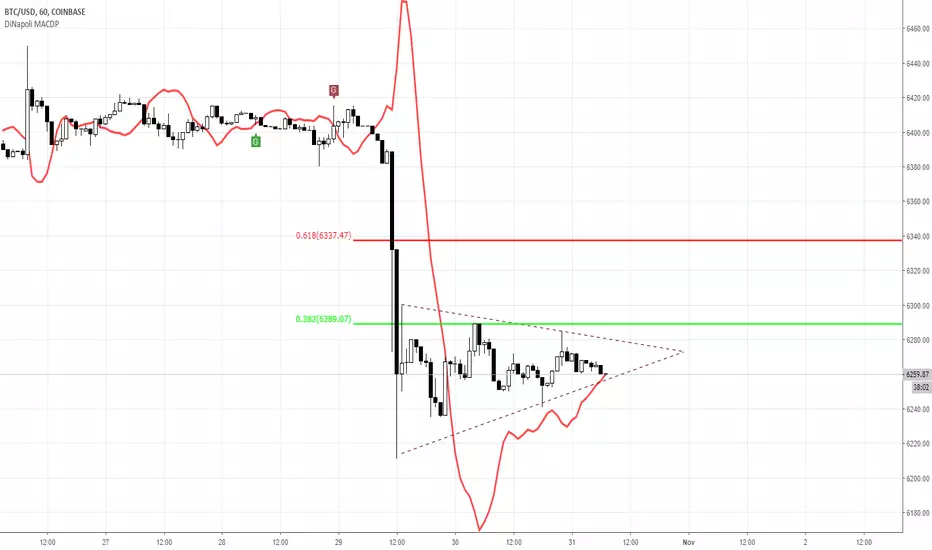
6300-6320 seems as nearest targetMorning everybody,
Flat action here gives small space for analysis, but, on daily chart we have two DiNapoli grabbers that suggest taking of recent lows and triangle/pennant consolidation.
Since MACD trend shows up, while price mostly stands flat - it points on bearish dynamic pressure. So, it makes us think that downside action could start soon and nearest target is 6300-6320, which is mostly intraday one.

6520 seems good level to go shortMorning guys,
Finally some activity lets us hope on appearing of patterns. We keep our bearish view on bitcoin and still suggest short entry at any attractive level and bearish pattern on the back.
Now our attention is on 4H chart. Right now BTC has completed "222" Sell. But, as CD leg of inner AB-CD pattern is a bit faster than AB, we keep hope that price could move slightly higher and form Butterfly "Sell". It is interesting that potential butterfly reversal point coincides with 3/8 Fib resistance around 6520$ area

Dropping our time frame to find at least somethingMorning guys,
BTC shows so weak volatility that it couldn't even complete the minimal upside targets. Still now on 1H chart it is a clear shape of
pennant/triangle pattern which potentially is continuation one, i.e. bearish in our case.
We still keep our bearish view on BTC and do not see any factors that could support demand for BTC right now. Thus, any bearish continuation
pattern inside the triangle could be used for short position taking.

$6500-6525 area should be good for short entryGreetings everybody,
Market shows very lazy price action, so it is very difficult to find some setup there. We think that BTC within few weeks will be driven by
doubts of investors. On a background of Tether, Bitfinex and Noble Bank events, lack of regulation and bit white spots in blockchain technology - investors, as new as experienced ones will try to re-assess BTC. It brings no interest, it doesn't protect from crisis events. It is an object of hackers attacks and no regulation opens the gate for dirty affairs of different kind. Is it really as attractive as it was seemed before?
Technically recent action definitely doesn't corresponds to idea of upside trend. After pullback BTC behaves too flat for bullish reversal. This makes us keep our bearish view intact. Speaking on short-term perspectives, we could get "'222" Sell pattern on Mon-Tue around major 3/8 resistance, which could become not bad area for short position taking.

BTC direction will be estimated after breakoutMorning, guys
It is difficult to comment spaghetti chart of BTC that we have right now, but we'll try. Speaking on larger perspective, since the reason for rally was not fundamentals or economy value of BTC but force-major technical situation, we suggest that chances on drop are better than on upside reversal. Here again an issue of absence of regulation appears and investors again will think about risks of BTC as financial asset.
Technically, final direction, whatever it will be, will be estimated on a breakout of huge rectangle that we have, range of the Monday's rally. target will be the height of this range (~600$) counted in direction of breakout.
Meantime, while BTC is coiling inside, all that we could do is try to get some small patterns. One of them is "222" Sell that could appear around 3/8 Fib resistance level of ~6520. This will be chance to make scalp shorts.
In general we suspect that sequence of such events as Mt. Gox crush, now is Bitfinex and Tether issue and no regulation of BTC market will significantly reduce attractiveness of cryptos for potential investors. Besides, BTC gives no % return on investments, this is also valuable issue on an upside rate cycle in US.

BTC is preparing for downside breakoutMorning guys,
Yesterday we've said that BTC has no fundamental or technical background for growth and force-major situations that we've got yesterday never lasts too long. Conclusion of our view on Monday was - this spike is good chance to go short at better price level.
Price action today doesn't provide us clear patterns that nuances point that BTC looks heavy. Take a look - on 30 min chart we have bearish engulfing pattern of huge size. During pullback from the top BTC has broken major 5/8 support area and was not able to return back, now any minor upside attempts are pressed by sellers.
As a result we have pennant pattern in progress, which stands more in favor of downside continuation. As a bottom line - we keep our bearish view. For more detailed discussion - visit our forum by signature link, there we put daily videos on BTC.

BTC-short on any upside pullbackMorning guys,
BTC has shown outstanding rally today, that was impossible to foresee as technically as fundamentally. This is force-major issue - Bitfinex has a problems with Noble bank, where major assets stand and Tether has a problems with liquidity then, to keep BTC-USD peg ratio. This has triggered explosive demand for exchange assets that investors hold in Tether and Bitfinex for crypto currencies.
It means that this reaction will be short term, because it doesn't have any fundamental reasons, and when the wave of exchanges will exhaust, BTC should return to previous levels.
We think that this is good opportunity to go short. On daily chart we have perfect AB=CD "222" Sell" at 5/8 Fib resistance and daily overbought area. Now we need to keep an eye on hourly chart and watch for AB-CD upside retracement and smaller "222" Sell, which should give us acceptable area for position taking.

AB=CD shape retracement and go...Morning everybody,
This is just minor update to the same idea on BTC. In fact, we keep the same scenario but slightly adjust the price shape.
On 4H chart we have bullish engulfing and it suggests 1H action in a shape of AB=CD pattern. As soon as it will be completed, it could be setup to go short.
Most probable that it will happen around 3/8 resistance that we've mentioned yesterday, it will depend on the depth of "C" point here.
