Gold (XAU/USD) in Symmetrical Triangle – Short‑Term Squeeze,Price Structure & Technical Setup
Gold is consolidating within a symmetrical triangle, showing lower highs and higher lows—a classic precursor to breakout in either direction
Fxglory Ltd
+5
TradingView
+5
Babypips.com
+5
TradingView
+2
Babypips.com
+2
TradingView
+2
.
Trendlines converge tightly around $3,326–$3,334, hinting at imminent directional acceleration
Investopedia
+4
TradingView
+4
TradingView
+4
.
🎯 Key Levels & Targets
Scenario Trigger Confirm Area Targets Stop Loss
Bullish Breakout above $3,344–$3,350 $3,369 → $3,396 → $3,422–$3,550 ~$3,340
Bearish Breakdown below ~$3,326–$3,320 $3,320 → $3,300 → $3,297 → $3,255 ~$3,335–$3,340
A breakout above $3,344–$3,350 validated with volume may drive prices toward $3,400+, with extended targets up to $3,550 or higher in bullish conditions
Traders Union
Time Price Research
.
A drop below $3,326–$3,320 risks further decline, targeting $3,300, $3,297, and eventually $3,255 if breakdown momentum builds .
📉 Market Context & Drivers
U.S. dollar strength, easing safe-haven demand, and optimistic trade sentiment are constraining gold’s upside unless breakout forces emerge .
Key upcoming catalysts: FOMC guidance, U.S. macro data (GDP, inflation), and geopolitical developments—their tone could tip the bias direction .
⚙️ Trade Rules & Risk Management
Wait for a confirmed breakout or breakdown—do not trade mid-range.
Confirm break with at least one close outside the triangle and rising volume .
Position sizing: Risk 1–2% per trade, adjust stop-loss to price structure ($8–$15 depending on volatility).
Take profits in stages: scale out at minor milestones (first targets), trail stop for extended targets.
Avoid chasing price within the middle of the triangle—risk/reward is unfavorable.
🧠 Why This Plan?
Follows textbook symmetrical triangle trading methodology: entry on breakout, stop beyond pattern opposite side, projection based on triangle height .
Aligns with broader outlook: bearish unless convincing upside breakout appears, consistent with analyst consensus hedging current bull exhaustion and wait‑and‑see on policy signals .
✅ Summary
Gold is coiling inside a tight triangle range near $3,326–$3,334, with breakout potential identified to either side:
Bullish breakout over $3,344–$3,350 targets up to $3,550 or beyond.
Bearish breakdown under $3,326–$3,320 risks slide towards $3,300–$3,255.
Wait for confirmation, apply disciplined risk controls, and let volume validate the move.
Forexpositive

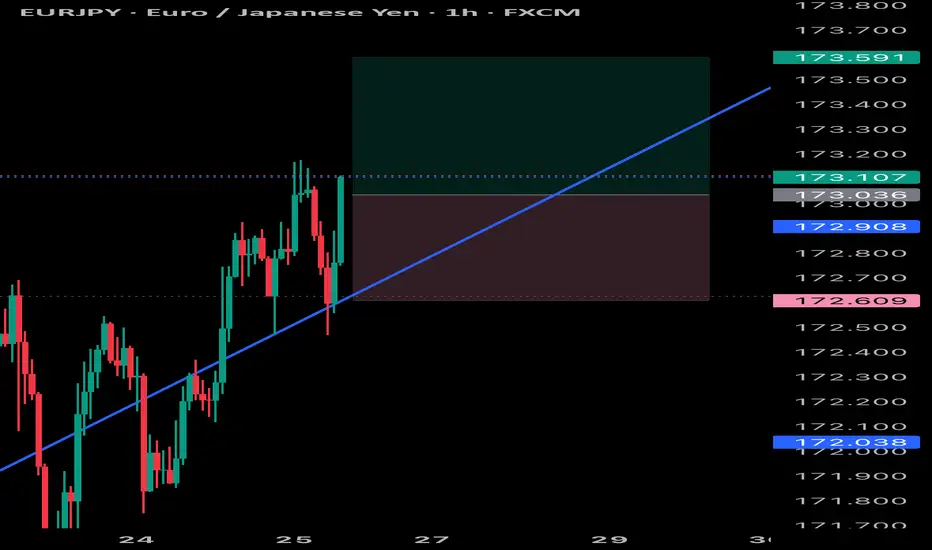
EUROYENEurjpy has shorter pullbacks within an ascending structure ,shall keep following it and expect it to reach a fair mount of highs or levels

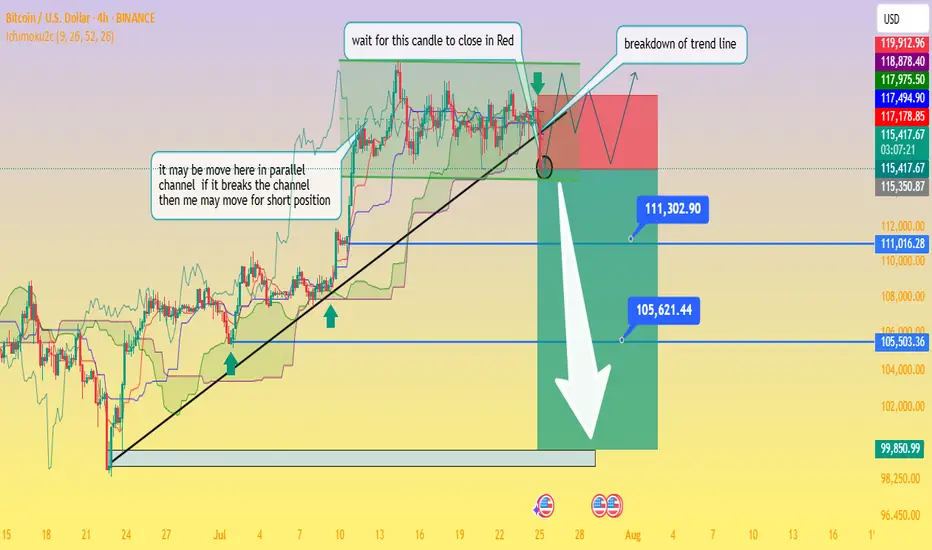
Critical Breakdown: BTC/USD Poised to Fall — Waiting on H4 CloseAnalysis of the BTC/USD 4‑Hour Chart
From the chart you provided, here's how the technical situation looks:
Ascending trendline support has been tested multiple times and was recently breached this afternoon, signaling a possible shift from the bullish setup to a bearish continuation.
The price is now trapped within a descending triangle formation beneath a well‑defined swing high resistance zone. This reflects indecision in the market, with neither buyers nor sellers in clear control
Business Insider
+15
Fxglory Ltd
+15
Bitcoin News
+15
.
Key levels to monitor:
Support zone: ~$115,500, extending down to ~$111,300 and ~$105,600 as deeper targets if bearish momentum strengthens.
Resistance zone: ~$119,000–120,000 area, forming strong overhead supply
Economies.com
DailyForex
Bitcoin News
.
The chart’s annotations align with a classic breakout strategy—with the caveat: wait for a confirmed close below the trendline before considering short positions (as noted in your “wait for this candle to close in red” comment).
Breakout confirmation would likely pave the way toward your indicated profit zones near ~$111k and ~$105k, with a larger potential down to ~$99.8k if further downside pressure builds.
🔍 What the Broader Market Signals
Technical sentiment from sources covering today’s analysis shows BTC/USD hovering just under $120,000, stuck within the defined range of $115.5k support to $120k resistance
Economies.com
.
While there’s still neutral momentum in indicators like RSI and MACD, the short-term direction leans bearish if the breakdown is confirmed on the H4 timeframe
Fxglory Ltd
.
Analysts emphasize that sustained movement above $116.5k could retarget resistance near $119–120k. A failure there and a move below $115.5k may thrust price deeper toward your downside zones
DailyForex
.
✅ Trading Strategy Overview
Scenario Trigger Target Levels
Bearish Breakdown H4 candle closes below trendline ~$115.5k $111.3k → $105.6k → possible $99.8k zone
Bullish Rejection Bounce back above ~$116.5k and trending above resistance $119k–120k retest, potential breakout if sustained
Neutral / Wait-and-see No decisive candle close yet Hold for confirmation
⛳ Final Thoughts
chart highlights a critical point: don’t act prematurely. Wait for a decisive H4 candle close below the trendline before committing to shorts. Confirmed bearish action around the breakout could open the path to the lower targets you identified. However, if price rebounds above support and climbs above $116.5k, a short-term retest of $119k–120k is still in range.
Traders should maintain prudent risk management—watching the unfolding price action around these pivot points without overreaching. Let me know if you'd like help crafting entry/exit zones or risk profiles for this setup!
EURJPY BULLS Bullish move from Eurjpy and will keep following it, to its very top with small pullbacks coming but stay prepared can put buy stops
SILVER h4 bullish pattansilver bullish mode Bearish Disruption Scenario:
Fake bounce to ~$37.00
Rejection → Break $36.00 support
Bear momentum pushes to $35.00–34.50
Neutral/Range Disruption:
Price oscillates between 36.00 and 36.80 for longer than expected — builds up coiled energy before either sharp breakout or breakdown
Only Bullish IF:
Clean reclaim of 37.25 with strong close above
EURGBP SHORT – WEEKLY FORECAST Q3 | W29 | Y25💼 EURGBP SHORT – WEEKLY FORECAST
Q3 | W29 | Y25
📊 MARKET STRUCTURE SNAPSHOT
EURGBP is currently reacting from a key higher time frame supply zone, with price action showing weakness at premium levels. Momentum has slowed, and early signs of distribution are appearing. With structure aligning bearishly across multiple timeframes, the pair presents a short bias opportunity.
🔍 Confluences to Watch 📝
✅ Daily Order Block (OB)
Price reacted from a high-probability bearish OB.
Rejection wicks and a shift in candle body control point to supply dominance.
Momentum is fading, confirming the presence of smart money sellers.
✅ 4H Order Block
Clear mitigation of 4H OB followed by an internal break of structure (iBoS).
Price is respecting the OB zone, printing lower highs beneath key supply.
Perfect mid-timeframe confirmation of trend transition.
✅ 1H Order Block
1H structure shifted bearish, validating LTF trend alignment.
Price building supply chain with continued lower highs and bearish engulfing patterns.
Ideal zone for entry on pullback or liquidity sweep.
📈 Risk Management Protocols
🔑 Core Principles:
💰 Max 1% risk per trade
📍 Only execute at pre-identified zones
⏰ Set alerts — avoid impulsive trades
📉 Respect RR — minimum 1:2 per position
🧠 You're not paid for frequency. You're paid for discipline and execution quality.
🧠 Weekly FRGNT Insight
“Trade what the market gives, not what your ego wants.”
Stay mechanical, stay focused, and allow the probabilities to play out. Your job is to control risk — not the outcome.
🏁 Final Thoughts from FRGNT
📌 The structure is clear.
📌 The confluences are stacked.
📌 The bias is confirmed.
Let your execution reflect your discipline, not your emotions.
❤️ Good luck this week, and as always – I’ll see you at the very top.

XAUUSD h4 pattern strongly down XAUUSD down it price 3339
Target 3320
Target 3310
Target 3300
Long target 3250

AUDCAD – Bearish Rejection at Key Resistance ZoneAUDCAD is showing signs of weakness near the 0.8980 supply zone after an extended rally. The pair is now reacting to a historically respected resistance area, with bearish momentum building as exhaustion sets in.
🔍 Technical Outlook:
✅ Price rejected at multi-touch resistance around 0.8980
📐 Clean bearish structure forming after wedge-like exhaustion
📉 Expecting a move down toward:
TP1: 0.89365 – recent minor structure
TP2: 0.89080 – key demand zone from early July
TP3: 0.88654 – full measured target from range
📛 Invalidation above: 0.8985
🌍 Fundamental Breakdown:
🇦🇺 Australia:
📉 Softening inflation and retail sales
🏦 RBA cautious with limited appetite for further hikes
🇨🇳 Weak Chinese demand adds pressure on AUD
🇨🇦 Canada:
💪 Supported by rising oil prices and solid employment data
🏦 BoC remains vigilant on inflation, though on hold
🛢️ Strong WTI prices continue to support CAD
⚠️ Risks to the Bearish View:
⚡ Unexpectedly strong China data could boost AUD
📉 Sudden drop in oil prices would hurt CAD
🗣️ Surprise hawkish shift from RBA
🔗 Correlation & Flow:
AUDCAD is a lagging asset, heavily influenced by WTI crude (boosting CAD) and China-linked risk flows (affecting AUD).
Keep an eye on AUDUSD and USDCAD for early signals.
📆 Upcoming Key Events:
🇦🇺 RBA Minutes, Jobs Data, Wages Index
🇨🇦 BoC Business Outlook, CPI Print
🛢️ US Oil Inventories (affects CAD)
🧭 Summary:
🔻 Bias: Bearish
📊 Drivers: Oil strength, RBA caution, CAD resilience
⚠️ Risk: China rebound or oil correction
🕵️ Watch: Canadian CPI + Australian jobs data
📉 Likely to Follow: Oil and AUDUSD/USDCAD macro trends

XAUUSD setup selling ideas h4Disruptive Gold Analysis – 4H Chart Perspective
Symbol: XAU/USD 🥇 | Timeframe: 4H
Date: July 9, 2025
⸻
🔁 Scenario Disruption: Potential Bullish Reversal
✅ While the original analysis shows a bearish continuation setup with consolidation under resistance and breakdown towards multiple downside targets, a disruptive view considers a false breakdown or support flip scenario.
⸻
🔁 Alternative Viewpoint:
📍 Current Price Action:
Price is testing the support zone (~3,280–3,290) which has held multiple times in the past.
🟢 Disruption Possibility:
1. Bullish Fakeout Trap Setup:
• Price may create a false breakdown below support to trap sellers.
• A quick recovery and breakout above the consolidation highs (~3,310–3,320) would invalidate the bearish continuation.
2. Resistance Flip Setup:
• If the market reclaims above 3,320, we may see a bullish push towards the key resistance zone at 3,360–3,380.
• This could evolve into a range breakout bullish trend continuation toward previous highs.
⸻
🔄 Disruption Targets:
• 📈 Immediate Upside Target: 3,320
• 📈 Breakout Target: 3,360
• 📈 Extended Bullish Target: 3,400+
⸻
⚠️ Invalidation Level:
If price closes below 3,270, then the original bearish scenario remains intact, with continuation toward 3,240 → 3,200 → 3,140.

AUDJPY Bullish Channel Still Intact, Eyeing Breakout Above 95.00AUDJPY continues to respect its ascending channel, with the current bounce occurring right at the 61.8% Fibonacci retracement and lower trendline support. The structure supports further upside as long as price holds above the 94.00–93.80 zone, with targets set toward 94.77 and 95.36, potentially extending to 95.63 highs.
🧠 Fundamentals:
AUD Strength Drivers:
RBA remains relatively hawkish vs other G10 banks.
Australia's data this week (retail sales, NAB confidence) were mixed, but no rate cut pricing in the near term supports AUD.
Iron ore demand showing resilience despite Chinese slowdown concerns.
JPY Weakness Drivers:
BoJ remains ultra-dovish. No action expected in July.
Japan’s inflation remains tame; the yield gap with other majors keeps widening.
Risk-on sentiment reduces demand for safe-havens like JPY.
🔍 Technical Structure:
Strong upward channel since early June remains valid.
Current pullback held the 61.8% Fib retracement of the June-July leg.
Bullish engulfing near support confirms entry.
Immediate resistance at 94.77 → 95.36 → potential breakout to 95.63.
Invalid if price closes below 93.80 (channel break).
⚠️ Risk Factors:
Risk-off shift (e.g., geopolitical escalation or U.S. CPI surprise) may boost JPY.
China growth fears can weigh on AUD.
A sudden dovish shift from the RBA would invalidate bullish fundamentals.
🔁 Leader/Lagger Dynamics:
AUDJPY typically leads other yen crosses (e.g., NZDJPY, CADJPY) during risk-on moves. It’s also a barometer for broader risk sentiment, often following moves in equity indices like US500 or commodity-linked assets.
✅ Trade Bias: Bullish
TP1: 94.77
TP2: 95.36
TP3 (aggressive): 95.63
SL: Below 93.80
Event to Watch: China data this week + U.S. CPI (Jul 11)
📌 Watch for a strong bullish daily candle above 94.77 for continuation confirmation. Stay nimble around key global risk events.

Where the coffee is strong (EUR/USD)Setup
EUR/USD is in a strong uptrend and recently broke above multi-year resistance just under 1.16. The pair looks to be targeting long term resistance at 1.23.
Signal
RSI is dropping back from overbought territory on the daily chart, offering a possible dip-buying opportunity above resistance-turned-support at 1.16.

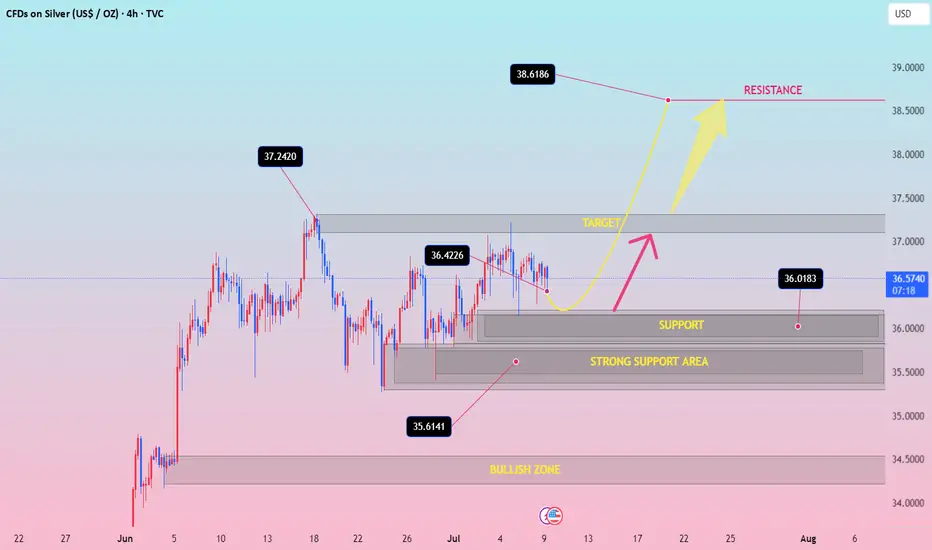
Market next target 🚀 Bullish Disruption Analysis
1. Support Holds Above 35.80
The market may dip slightly but find strong support around the 35.90–36.00 zone.
Instead of continuing lower, buyers absorb the selling pressure, leading to a sharp bullish reversal.
2. Bullish Continuation After Consolidation
The current pullback could just be a healthy retracement following the strong recovery move from the previous dip.
This could form a bullish flag or ascending triangle, eventually breaking above 36.20 and pushing higher.
3. Volume Clue
If the pullback happens with declining red volume, while previous green candles had strong volume, it signals a temporary correction rather than a trend reversal.
Watch for a bullish engulfing candle backed by strong volume to confirm.
4. Macro Trigger / Fundamental Support
Any dovish signal from the Fed, rising inflation, or weakening USD could increase investor demand for silver, pushing prices back up.
A news-driven reversal could invalidate the bearish path quickly.
5. Bullish Price Target
If buyers take control, silver could retest and break above 36.30–36.40, aiming toward 36.60 or even 36.80.

EURUSD Long Setup – Bullish Rejection from Demand ZoneEURUSD remains supported by strong eurozone fundamentals and broad USD softness. The pair has retraced into a key demand zone around 1.1490 and is showing signs of bullish rejection. With the Fed likely to pause further rate hikes and the ECB maintaining a steady tone, the bias favors further upside toward recent highs.
⚠️ Geopolitical tensions in the Middle East (Israel-Iran conflict) have introduced mild safe haven demand, but so far the USD has underperformed versus the euro, suggesting EUR remains relatively insulated.
Watch for confirmation and entries within the blue demand box.
🔍 Technical Analysis:
Structure: Clear uptrend with higher highs and higher lows. Price retraced to a well-defined 1H demand zone between 1.1490–1.1500.
Setup: Anticipating a bounce from the demand zone targeting the recent high near 1.1620–1.1630.
Entry Zone: 1.1490–1.1500 (bullish reaction area)
Target: 1.1620–1.1630 (previous supply zone)
Stop Loss: Below 1.1439 (recent swing low)
Risk-Reward Ratio: Approximately 1:2.5
🧠 Fundamental Context (as of June 16):
EUR Bias: Bullish – ECB has paused cuts; euro is resilient despite geopolitical headwinds.
USD Bias: Bearish – Fed is on pause; soft inflation data and geopolitical risks weigh on dollar strength.
Key Drivers:
Fed dovish tone (FOMC pause, lower CPI)
Strong EU resilience despite global tensions
CHF and JPY attracting safe haven flows over USD
📅 Key Events to Watch:
US Core PCE (next major inflation readout)
FOMC commentary and Fed speakers
Eurozone CPI and sentiment data

AUD/USD at Critical Resistance — Bearish Outlook Below 0.65381. Major Resistance Zone: 0.65380
Price is currently testing a strong horizontal resistance level at 0.65380, a level that has been tested multiple times (as shown by the pink circles).
This level has acted as a historical turning point, which increases its significance.
2. Price Structure: Lower Highs and Equal Highs
The chart reveals a potential double top or distribution pattern, forming under the 0.65380 resistance.
This suggests weakening bullish momentum and increases the probability of a bearish reversal.
3. Projected Bearish Path (White Dotted Lines):
If price fails to break above 0.65380 decisively, the expected move is a stepwise decline.
The projected path targets several support levels:
0.65003
0.64647
0.64213
0.63957
Final target: 0.63627, a key support from early May.
4. Support & Resistance Zones:
Resistance Levels:
0.65380 (Major)
0.65003
Support Levels (Sequential Targets):
0.64647
0.64213
0.63957
0.63627
5. Confluence with Fundamentals:
U.S. economic events (highlighted at the bottom with calendar icons) may act as volatility triggers, potentially accelerating this move.
✅ Summary & Trading Implications:
Bias: Bearish below 0.65380
Trade Idea: Watch for rejection at resistance or break below 0.65003 for confirmation.
Bearish Targets: Gradual move toward 0.63627 with key pauses at intermediate support levels.
Invalidation: Daily close above 0.65380 would negate the bearish setup and open potential for new highs.

EURO-USD BUY STRONG 1. "EUR/USD Strong Buy Alert 🚀 | Key support zone holding firm – bulls eyeing the next leg up!"
2. "Strong Buy Zone ✅ | EUR/USD showing bullish momentum from this support level – eyes on 1.09+"
3. "EUR/USD Reversal Zone 💥 | Buyers stepping in strong – potential rally ahead!"
4. "Watch this zone! EUR/USD strong buy setup forming – bullish confirmation underway 📈"
5. "EUR/USD bouncing from key demand zone 🔥 | Technicals align for a strong buy signal!"

Market next move 🧨 Disruption Points:
1. Overbought Condition / RSI Divergence
Even though the price is surging (+3.30%), there could be an overbought condition forming.
If RSI or other momentum indicators (not shown here) diverge, it might signal weakness in bullish momentum.
> Disruptive idea: Price may fake the breakout (blue arrow) and then sharply reverse, trapping late buyers.
---
2. False Breakout Trap
The red-box area could be a liquidity zone where smart money might induce a fake breakout before dumping.
> Alternative path: Price breaks above temporarily (as in blue path), but then reverses violently back into the range, forming a “bull trap.”
---
3. Volume Anomaly
The volume appears to be decreasing on recent bullish candles after the initial spike.
This suggests that the uptrend may be losing strength, making the yellow arrow scenario less likely.
> Contrary outlook: Lack of volume confirmation could mean a sideways consolidation or reversal is more probable.

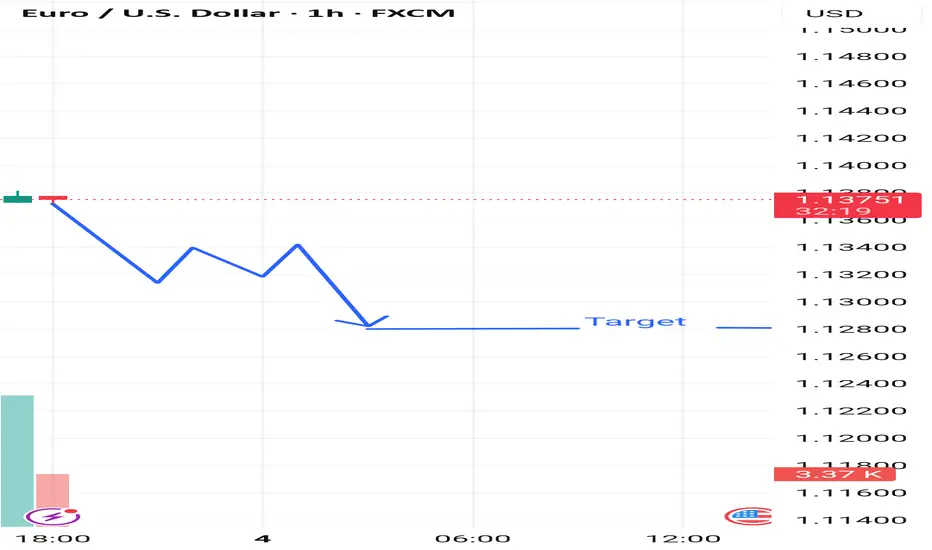
Market next move Disruption of the Downtrend Analysis
The chart currently suggests a bearish breakout with a downside target near 1.12900. Let’s challenge that:
---
🟩 Bullish Reversal Possibility
1. Support Zone Near 1.1370:
Price has shown signs of stabilizing around the 1.1370 level.
Multiple wicks below the candles suggest buyer interest at this level.
2. Low Volume on Recent Red Candles:
A decreasing volume trend on recent red candles can indicate weak bearish momentum.
Bulls may be waiting to enter on a breakout above the 1.1380–1.1390 zone.
3. Potential for Fakeout:
The sharp expected drop might be a bear trap.
If price breaks back above 1.1385 with strong volume, it could invalidate the bearish thesis.
4. RSI/Momentum Divergence (Assumed):
If momentum indicators (not shown) display bullish divergence, this strengthens the case for a reversal
USDCAD Rebound from Key Support – Bullish Setup in PlayUSDCAD pair has reached a technical inflection point at key support around 1.3700, where it is attempting a rebound after several days of bearish momentum. With recent Canadian data showing underlying economic strain and the U.S. dollar reacting to rate expectations and tariff news, this area becomes crucial for the next directional move.
🔍 Technical Analysis
Support Level: Price has respected the horizontal support at 1.3700–1.3685, forming a possible double-bottom structure on the 4H chart.
Bullish Reversal Zone: The latest candle shows a strong rejection wick at the support zone, suggesting bullish interest. The structure aligns with a classic bullish reversal pattern.
Target Zones:
First TP: 1.3849 (previous high / supply zone).
Second TP: 1.3860–1.3870 (Fibonacci extension + minor resistance).
Invalidation (SL): Below 1.3685, further downside may open to 1.3632.
🧠 Fundamental Context
U.S. Side:
GDP and NFP data have recently come out mixed, reducing the immediate pressure on the Fed to hike rates further.
Tariff uncertainty and appeal plans by the Trump administration are increasing near-term USD volatility.
US bond yields are firming again, giving the dollar mild support.
Canada Side:
Canadian Q1 GDP disappointed at 0.1%, lower than expected.
BoC is likely to hold rates steady, but the economy shows weak business investment and softening consumption growth.
Crude oil, Canada’s key export, is still under pressure, slightly weakening CAD.
✅ Conclusion
This setup favors a short-term long on USDCAD from current levels, targeting the upper resistance zone at 1.3849–1.3860. A break and close above 1.3870 could extend toward 1.3900. However, caution should be exercised with upcoming U.S. labor and trade data that may fuel volatility.

XAUUSD: Break or Bounce at ResistanceGold has reached a critical technical zone near a long-term descending trendline and horizontal resistance around $3360–3380. Price action suggests a make-or-break moment is unfolding.
Key Technical Structure:
Descending Trendline Resistance from the April high capped the rally.
Current move has formed a rising wedge — typically bearish if broken.
Price is testing resistance confluence — a rejection could send Gold lower.
Scenarios to Watch:
🔹 Bullish Breakout:
Clean breakout and close above $3380 confirms trendline invalidation.
Upside projection points to $3500 — previous high and psychological level.
🔹 Bearish Rejection:
Failure to break the trendline + wedge breakdown can drag price to:
$3280 (38.2% Fib)
$3160–3200 zone (61.8% Fib + demand area)
Macro Factors to Watch:
Tariff escalation between US–EU could trigger risk-off → bullish for Gold.
FOMC policy pause, weak job data, or inflation rebound also support upside.
Stronger USD or yield spike may trigger wedge breakdown → bearish.
Conclusion:
XAUUSD is at a key inflection point. Wait for confirmation: either a clean breakout or a clear reversal rejection. Trade the resolution, not the anticipation.

Market next move 🔻 Disruptive Bearish Analysis:
🧱 1. Failed Breakout Attempt
Price is hovering at resistance but showing indecisive candles (small bodies, wicks on both sides).
This hints at buyer exhaustion rather than breakout momentum.
📉 2. Bearish Divergence (Possible)
If momentum indicators (e.g., RSI or MACD—not shown here) are diverging from price, it could signal a reversal.
Price rising while momentum flattens or drops suggests a fakeout is likely.
🕳️ 3. Liquidity Grab Trap
The chart may show a classic “bull trap”:
Price broke resistance briefly but quickly fell back.
This signals institutional liquidity grab, possibly before a downward push.
🔽 4. Volume Imbalance
The spike in volume earlier may be followed by decreasing bullish volume, indicating weak follow-through.
Sellers could take over if bulls can’t sustain pressure.

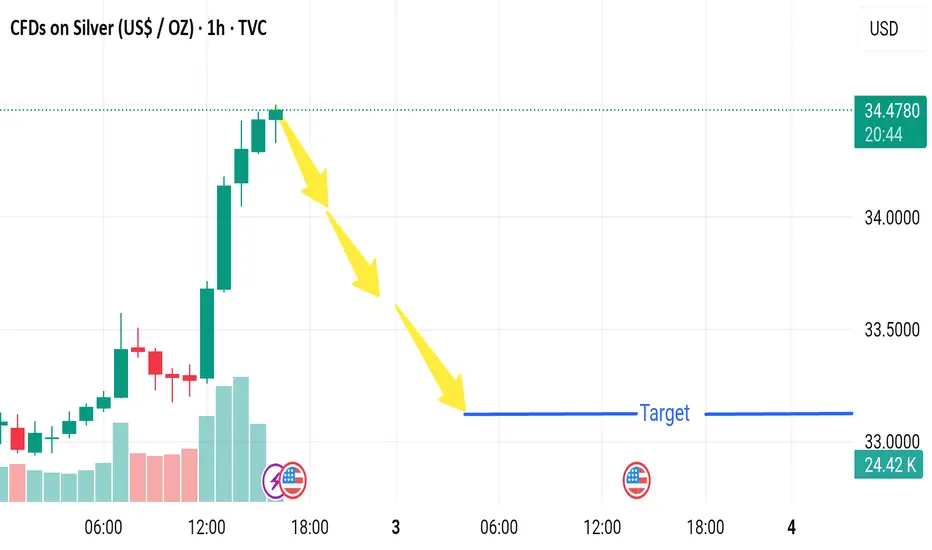
Market next target 🟢 Disruptive Bullish Scenario:
🔁 1. Healthy Bull Flag or Consolidation
The steep rally (+4.5%) may not lead to a breakdown.
The current pause near $34.50 could be a bull flag or tight range consolidation, common in continuation patterns.
🔼 2. Volume Supports the Move
Notice the strong rising volume on the breakout candles.
This shows genuine buyer interest, not a pump-and-dump move.
🧲 3. Breakout Holding Above Previous Highs
Price is holding above previous resistance, which now acts as support around $34.00–$34.20.
Holding this zone can lead to a retest and breakout to new highs.
📈 4. Strong Macro Bullish Catalyst
The U.S. event icon suggests important data is near.
If the data (like weaker dollar or inflation concerns) supports metals, Silver could surge further rather than drop.
Market next move 🔻 1. False Breakout Risk
Price is hovering right at the resistance-turned-support zone.
The candles above this zone have long upper wicks, signaling rejection and selling pressure.
This may be a bull trap before reversal.
---
📉 2. Decreasing Bull Volume
Volume peaked earlier, but the most recent green candles are showing lower volume, suggesting weakening bullish momentum.
Lack of strong follow-through volume often precedes reversals.
---
🕳️ 3. Overextended Rally
Gold has moved sharply upward recently (over +2.5%).
There may be a need for a cooldown or retracement, especially if no fresh catalysts emerge.
---
⚠️ 4. Macro Factors Unpriced
The chart includes a U.S. event icon, likely representing upcoming economic data (e.g., Fed comments, job reports).
Any hawkish surprise (rate hike concerns, strong jobs report) could cause a sharp reversal in gold due to rising yields and a stronger USD.

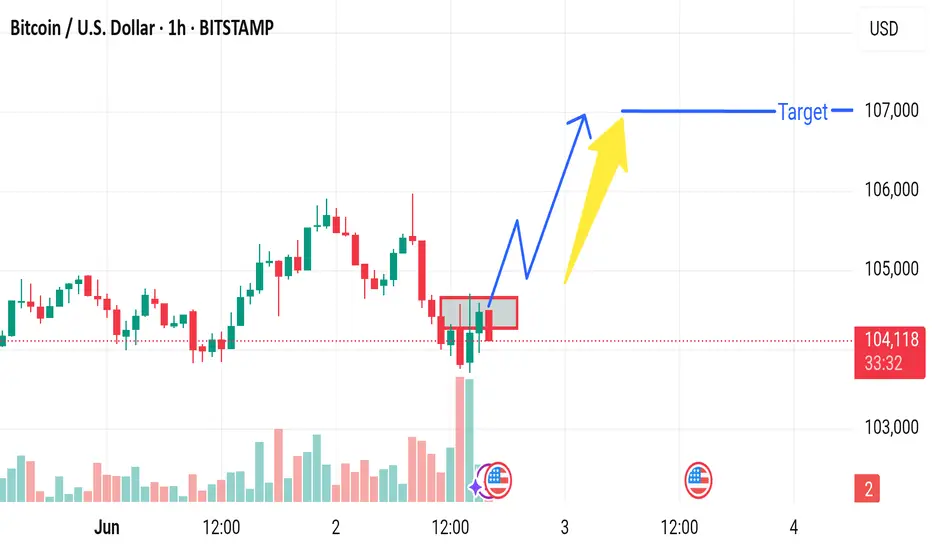
Market next move 1. Bearish Rejection Zone
The red box highlights a consolidation/resistance zone.
BTC is struggling to break and close above this area.
Multiple candle wicks into the zone suggest seller strength.
---
📉 2. Volume Weakness
The recent upward candles show lower volume compared to the selling candles before it.
This indicates that the buying pressure may be weak, lacking momentum for a breakout.
---
🕳️ 3. False Breakout Trap Risk
A fakeout above the resistance box is possible if big players trigger buy orders and then reverse the market, trapping retail traders.
---
🟠 4. Bearish Divergence (if confirmed by RSI or MACD)
Without indicators shown, if momentum indicators like RSI/MACD display divergence (price up but momentum down), it’s a bearish signal.