Market next move ⚠️ 1. Weak Bullish Continuation Signal
The current price action shows a rejection wick on a red candle, signaling selling pressure near the recent highs.
Despite the upward move earlier, this could be a short-term exhaustion rather than strength for further upside.
---
📉 2. No Follow-Through After Bullish Spike
There was a strong bullish candle earlier, but:
No significant follow-up to break past that level convincingly.
Price appears to have stalled or even reversed after that spike — possibly forming a bull trap.
---
🔄 3. Overhead Resistance at Target Area
The "TARGET" label sits near recent highs, which have already been rejected once.
Without clear breakout volume, this zone might act as resistance, not a logical next stop.
Forexpositive

Market next target ⚠️ 1. Bearish Momentum Remains Intact
The last few candles are strongly bearish, with steep declines and high red candle volume.
Attempting to project an upside target amid this current bearish drive lacks alignment with actual market sentiment.
---
📉 2. Lack of Reversal Candlestick Patterns
There is no clear bullish reversal pattern visible at the point of target placement:
No hammer, bullish engulfing, or morning star pattern.
The price may just be pausing before continuing its downward trend.
---
🔊 3. Volume Discrepancy
The rising volume on red candles vs. low volume on recent green candles shows selling pressure outweighs buying interest.
A reliable bullish setup would typically come with higher buying volume after a selloff, which is not yet seen.
---
🧭 4. Misleading “Target” Location
The marked target is at a higher high, near 33.75–34.00 area, which:
Is not supported by immediate technical breakout
Seems to ignore the last failed attempt to break above that level
Appears overly optimistic given the current trend direction

Market next move 🔻 Disruption Scenarios:
1. Resistance Zone at Target Level
The marked "Target" could coincide with a strong resistance level from a previous high.
Price may reject this level again, forming a double top or bearish reversal candlestick pattern (e.g., shooting star or bearish engulfing).
2. Volume Divergence
The recent uptrend shows a slight drop in buying volume.
If price increases while volume decreases, it signals a potential exhaustion of bullish momentum.
3. Upcoming News Events (Fundamentals)
The chart shows several upcoming economic events (news icons).
Any negative surprise from U.S. data or positive Eurozone data could reverse the trend sharply.
For example, better-than-expected U.S. employment data could strengthen the USD, pushing EUR/USD down.
4. Overbought Condition
If we add an RSI (Relative Strength Index) or Stochastic oscillator, the price might already be in the overbought zone, suggesting a correction is due.
5. Fake Breakout Trap
If the price hits the “Target” but then fails to close above it, it could be a bull trap, triggering short positions and leading to a sharp sell-off.

USD/JPY 1H Analysis – Channel Breakout and Buy SignalOverview:**
The USD/JPY chart shows a **bullish breakout from a descending channel**, supported by technical indicators like the Ichimoku Cloud and a strong demand zone. This setup suggests a potential bullish reversal and upward momentum.
*Key Technical Points:**
* **Descending Channel Breakout:**
Price action has broken out of a falling channel, indicating a shift in market sentiment from bearish to bullish.
* **Strong Support Zone:**
Around 143.28 – 143.73, the price found significant support, which aligns with a previous demand zone. This area held firm, helping trigger the breakout.
* **Ichimoku Cloud:**
Price is emerging above the Ichimoku Cloud, signaling a potential start of an uptrend. If the price maintains above the cloud, bullish momentum may strengthen.
* **Resistance Levels:**
* **First Resistance:** Near 146.00 – a critical area to watch for short-term profit-taking.
* **Second Resistance:** Around 148.00 – a more extended target if bullish continuation holds.
---
### **Trading Idea:**
**BUY USD/JPY** on successful retest of the breakout or sustained move above the Ichimoku Cloud.
* **Entry:** 144.30–144.40 zone
* **Target 1:** 146.00
* **Target 2:** 148.00
* **Stop Loss:** Below 143.20 (under the support zone)
---
Conclusion:**
The chart presents a classic **bullish channel breakout** supported by the Ichimoku indicator and price action at a strong support zone. As long as the price holds above the breakout level and Ichimoku Cloud, the upside targets at 146 and 148 remain valid.
Let me know if you want this formatted as a trade plan or journal entry.
To ensure you do not miss the upcoming analysis, be sure to follow me!
Please leave a remark and a like!

Market next move 🧠 Disruptive Analysis:
🔴 1. False Breakout Potential
The marked box shows a consolidation zone. While the green candle breaks slightly above it, this might be a trap (false breakout). If there's no strong follow-through, price may sharply retest or drop back inside the box—a classic bull trap.
🔴 2. Bearish Volume Profile
Volume spiked on the initial drop, and even though there's some green candle volume, it’s not convincingly higher than previous bars. This could imply weak buyer commitment at this level, suggesting a potential reversal downward.
🔴 3. Overhead Resistance
Even if price breaks out, it faces immediate resistance around 1.3485–1.3500, where multiple wicks formed earlier. This could stall or reject the move, invalidating the bullish "Target."
🔴 4. Economic Risk
The U.S. economic event icons below suggest incoming USD-related news. If the data is USD-positive (e.g., strong employment or inflation), it could strengthen the dollar and push GBP/USD lower, negating the bullish move entirely.

Market next target
⚠️ Disruption Points:
1. Dubious Support Zone
The boxed zone (highlighted as support) shows multiple rejections but no clear bullish rejection candles (e.g., no hammer, bullish engulfing).
This may be a false base forming before another breakdown, especially with declining volume.
2. No Confirmed Reversal Pattern
The chart lacks a proper reversal structure like a double bottom, inverse head-and-shoulders, or bullish divergence.
A few sideways candles ≠ trend reversal—this might just be consolidation before further drop.
3. Weak Buyer Commitment
Volume has steadily decreased as the price attempted to base out.
If buyers were serious, we’d expect to see surging green volume bars, not this tapering activity.
4. Downtrend Still Dominant
The overall market structure is still lower highs and lower lows.
Jumping into a long trade against the trend without a confirmed break above the last swing high (≈1.13250) is premature.
5. Risk-Reward Imbalance
The arrowed path assumes an ideal rise without considering realistic pullbacks or market resistance.
If a stop is set below 1.12800 (support low) and the target is 1.13400, reward is tight compared to the risk, especially if price continues chopping sideways.

EUR/CAD Bearish Flag Breakdown Toward Fibonacci SuppAnalysis
1. **Trend Breakdown:**
* The chart shows a clear **bearish structure** developing after a strong rally to the 1.58800 area (Fibonacci 1.618 extension level).
* Two upward trendlines were broken successively, confirming bearish momentum.
2. **Fibonacci Levels:**
* The retracement from 1.58800 down to the 0.382 level (1.54586) has held significant importance.
* Price action is respecting the **Fibonacci retracement zones**, with rejection near the 0.786 and 1.0 levels (1.56915 - 1.57109).
3. **Bearish Flag Pattern:**
* A small **bearish flag/pennant** formed after a strong drop, which has now broken downward.
* This confirms the **continuation of the bearish move**.
4. **Volume Confirmation:**
* Volume spikes during the initial sell-off and again on recent bearish candles suggest **strong selling interest**.
5. **Trade Setup (Marked on Chart):**
* **Entry:** Near 1.56443
* **Stop-Loss:** Around 1.57109 (just above recent highs)
* **Target:** Around 1.54848–1.54500 zone, aligning with prior demand and 0.382 Fib level
---
**Conclusion:**
The chart signals a high-probability **short setup**, backed by a break of structure, Fibonacci confluence, bearish flag breakdown, and volume. A continued decline toward the 1.54500–1.54800 region is likely, provided the price stays below 1.57100.

Market next move . Support Fatigue / Breakdown Risk
Observation: Price has tested the red support zone multiple times.
Disruption: Repeated tests of support often weaken it. If it breaks, a sharp drop may follow.
Implication: Instead of bouncing, EUR/USD could slide below 1.13200, triggering stop-losses.
---
2. Lack of Bullish Volume Confirmation
Observation: The recent candles show low volume on bullish attempts.
Disruption: Weak demand at support indicates hesitation among buyers.
Implication: Without a volume spike, any bounce may be short-lived or fail entirely.
---
3. Bearish Momentum Still Intact
Observation: Price action shows consistent lower highs and lower lows.
Disruption: The short-term trend is still bearish, so this could be a pause before continuation down.
Implication: A false bullish break could trap long traders before a drop resumes.
---
4. Fundamental Risks (USD Strength)
Disruption: Any U.S. data surprises or hawkish Fed comments (noted by U.S. event icons on the chart) could push USD higher, dragging EUR/USD down.
Implication: Technical bounce setups could be invalidated by macro events.

Market next move Original Analysis Summary:
The chart shows a support area around the 3340 USD level.
There are two bullish scenarios outlined with blue and yellow arrows, implying a price increase from the support zone.
---
Disruption/Critical Analysis:
1. Overreliance on Short-Term Support:
The chart assumes the marked support area will hold, but no confirmation (like a bullish candlestick pattern or strong buying volume) is evident yet. A break below that zone could lead to a bearish move instead.
2. Volume Weakness:
Recent candles near the support zone are not backed by significantly increasing volume. This suggests weak buying interest, making the bullish forecast potentially over-optimistic.
3. No Consideration of Macroeconomic Events:
The chart doesn't factor in fundamental drivers (like U.S. economic data, Fed announcements), which can easily invalidate technical patterns.

gbpnzd buy signal. Don't forget about stop-loss.
Write in the comments all your questions and instruments analysis of which you want to see.
Friends, push the like button, write a comment, and share with your mates - that would be the best THANK YOU.
P.S. I personally will open entry if the price will show it according to my strategy.
Always make your analysis before a trade

Market next move Original Analysis Summary:
Identifies a bullish structure breaking above a support area.
Projects a potential continuation to higher targets.
Suggests consolidation and bounce from support before climbing.
---
Disruptive Bearish Interpretation:
1. Lower High Possibility:
Recent price action might be forming a lower high rather than a continuation signal, signaling weakness in buying pressure.
2. Volume Imbalance:
Notice how the large green candle was followed by lower bullish volume, suggesting buying momentum is fading.
3. Breakout Trap:
The "Support area" may instead be a liquidity zone where breakout traders entered long positions and could now be trapped. A break below this area could cause a panic sell-off.
4. Trendline Respect (Rejection):
Price is currently retesting the underside of a descending trendline — a common reversal spot.

Market next target
Original Analysis Summary:
Identifies a bullish breakout above a support zone.
Expects continuation upward to a target zone after minor pullback.
Assumes support holds and bullish trend continues.
---
Disruptive Bearish Interpretation:
1. Fakeout Risk (Bull Trap):
Price broke above the support area, but this could be a false breakout designed to lure in long positions before a reversal.
2. Trendline Retest Failure:
The price is testing a trendline or resistance zone. Failure to break above this area could indicate rejection and reversal.
3. Bearish Divergence:
If momentum indicators (e.g., RSI or MACD, not shown here but inferred) show divergence, it may warn of weakening bullish strength despite price rising.
4. Candlestick Exhaustion:
Recent candles show upper wicks and slowing momentum — a common sign of potential exhaustion.

Market next target Original Analysis Summary:
Support area at ~1.1400 holding price.
Expectation: Bounce off support and continuation to higher target.
Arrows indicate a bullish bias after minor retracement.
---
Disruptive Bearish Interpretation:
1. Exhaustion at Top:
Strong upward rally could be showing signs of buying exhaustion, especially after the sharp vertical move.
The current top wick suggests rejection from higher levels.
2. Bearish Reversal Candles:
If a shooting star or bearish engulfing pattern forms near the target area, it could signal a reversal.
The current candle shows a long wick, which often precedes pullbacks.
3. False Breakout Risk:
The price could have broken above a resistance level only to trap breakout buyers before reversing downward.
This would trigger a move below the red box (support area).

Market next move Original Analysis Summary (Bearish):
Support area is being tested.
Arrows suggest a breakdown below support with targets around 3,280–3,240.
Volume shows a slight increase, possibly hinting at selling pressure.
---
Disruptive Bullish Interpretation:
1. False Breakdown Trap:
Price may briefly dip below support (bear trap) to flush out weak holders before bouncing back strongly.
This would invalidate the bearish scenario and trigger short covering.
2. Volume Analysis:
Although red candles dominate, the volume spike could also indicate buying absorption at this level.
Hidden accumulation may be underway.
3. Support Holding Well:
The support zone has been tested multiple times and still holds — which can also be interpreted as strong buying defense rather than weakness.
4. Potential Bullish Reversal Pattern:
If a bullish candlestick formation like a hammer or engulfing forms near the support zone, it could signal reversal back to the upside.
Target back to 3,380–3,400+ becomes viable.

Market target 1. Support Area Assumption
Disruption: The highlighted support area is relatively narrow and based on a few candles. On a 1-hour chart, this might not provide a strong enough foundation for a meaningful bounce. The price has tested this level multiple times, suggesting weakening support rather than strength.
2. Target Projection
Disruption: The target area is drawn without showing how it was calculated—no Fibonacci level, previous resistance, or volume zone is referenced. Without clear technical justification, the target level appears speculative.
3. Pattern Expectation (Bounce Prediction)
Disruption: The blue arrow suggests a bullish reversal, but volume is declining, and there’s no strong bullish candle yet to confirm the move. In fact, multiple lower highs suggest bearish pressure.
4. Ignoring Bearish Continuation
Disruption: The red arrow suggesting a drop isn't emphasized as strongly as the bullish path. However, repeated testing of the support with no significant bounce increases the risk of a breakdown. Also, if macroeconomic conditions or broader crypto sentiment is bearish, this chart setup could break down easily.
5. Lack of Context
Disruption: The chart analysis is isolated to a short timeframe (1 hour). Without higher timeframe confluence (e.g., 4H, Daily), any short-term pattern can easily be a false signal.
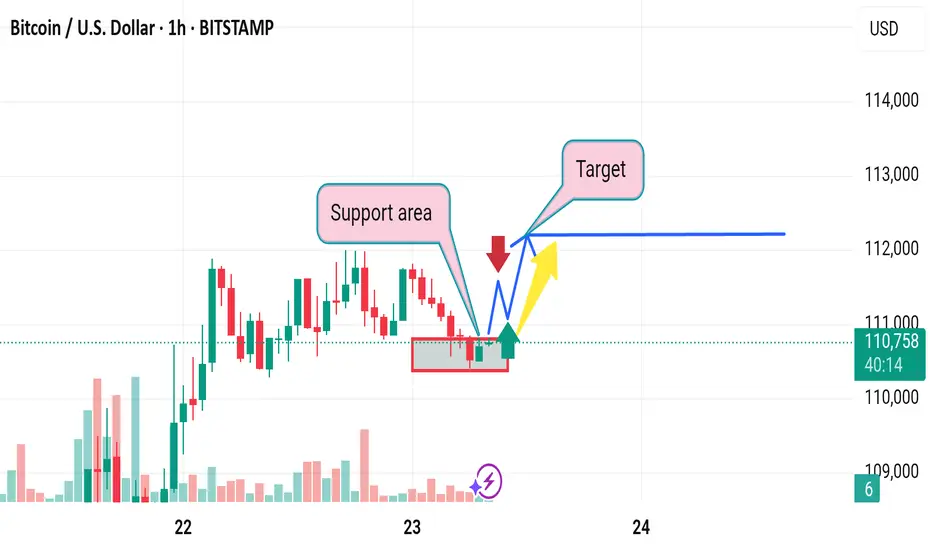
Market next move Original Analysis Recap:
Support Zone marked just below the current price.
Bearish Move Expected (red arrow) from current resistance.
Bullish Bounce Expected after initial drop (blue and yellow arrows).
Target is placed lower than current price, implying expected downward movement.
---
Disruption / Contrarian Thesis:
1. Fakeout to the Downside (Bear Trap)
The analysis assumes a rejection at resistance and a drop, but:
After the large red candle previously, the market may have absorbed all selling pressure.
Current consolidation shows higher lows—suggesting hidden buying.
Disruption Call: A quick dip below support (triggering stops), followed by a strong bullish reversal breaking through the resistance zone.
---
2. Volume Insight Ignored
Note that recent volume spiked on green candles during recovery.
Current retracement has lower volume, suggesting it may be a pause in uptrend (not a reversal).
Disruption Call: This is accumulation, not distribution. A breakout above 33.20 could happen, aiming for 33.40 or higher.
---
3. Structural Misinterpretation
The “support” identified may not be valid—it’s part of the consolidation range.
True demand zone could be deeper, around 32.90–33.00.
Market rising up Original Analysis Overview:
Support Zone: Clearly marked.
"Flying" Point: Suggests a bullish breakout.
Target: Indicates price will rise significantly.
Arrows: Imply breakout is likely to follow bullish momentum.
---
Disruption / Contrarian Viewpoint:
1. False Breakout Risk
The tight consolidation just above the support line might indicate a bull trap—a false breakout intended to lure in long positions before a sharp reversal. The “flying” point might instead be a liquidity hunt.
Disruption Call: Expect price to briefly break above resistance and then drop below support, invalidating the bullish thesis.
2. Volume Divergence
Volume is not significantly increasing at the breakout point. True breakouts typically come with a volume surge.
Disruption Call: Weak volume suggests lack of conviction. Price may revert back into the range or breakdown.
3. Macro Sentiment Shift
If macroeconomic news (e.g., Fed policy, USD strength) flips bearish for gold, technical setups may get invalidated.

Market next move
1. Support Zone Validation
Observation: Price is reacting from a labeled “Support area.”
Disruption: The support zone is based on very recent price action with limited prior structure. No confirmed double bottom, bullish engulfing, or strong rejection candle is present to confirm it as strong support yet.
---
2. Volume Context Ignored
Observation: Volume has declined during recent candles.
Disruption: A genuine reversal from support typically comes with a volume spike. The current volume profile shows weakening participation, which questions the strength of the bounce.
---
3. Premature Long Target Projection
Observation: A bullish arrow targets the 1.134–1.135 zone.
Disruption: This target is overly optimistic given the lack of a trend change signal. Price is still in a clear lower-high and lower-low structure, suggesting bearish momentum remains intact unless a breakout above 1.1300 occurs.
---
4. Bearish Scenario Underdeveloped
Observation: Only a single red arrow shows bearish rejection.
Disruption: There is no defined breakdown zone or bearish continuation pattern shown (e.g., flag or wedge). If support breaks, price could rapidly move to 1.1200, but this scenario is underrepresented.
---
5. No Confirmation Candlestick for Bullish Entry
Observation: A bullish move is anticipated from current levels.
Disruption: The current candle structure does not confirm bullish control—no hammer, engulfing, or clear reversal pattern. Entering long here could be premature without that confirmation.
---
6. Lack of EMA or RSI Confluence
Observation: Analysis is purely price-action based.
Disruption: No exponential moving averages (EMAs) or RSI are shown to validate trend change. These tools could help confirm divergence or trend reversal.

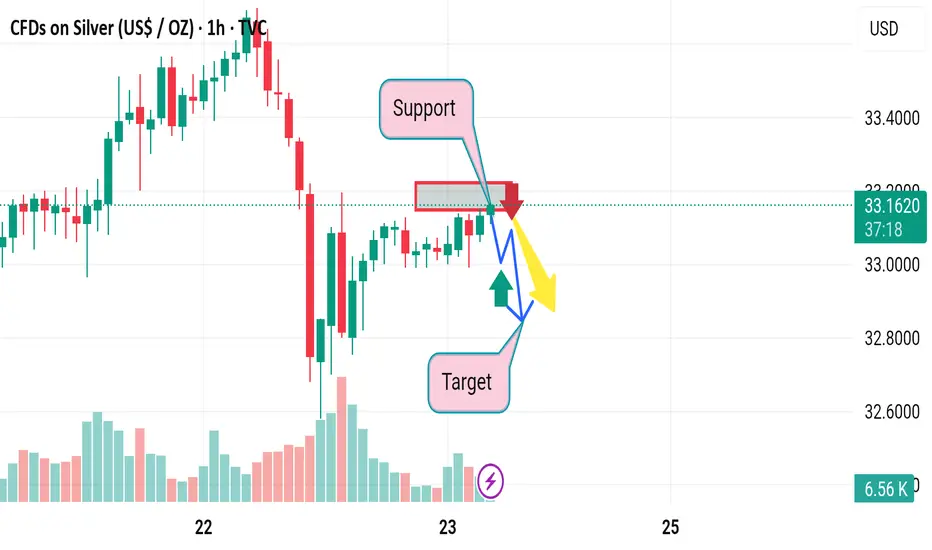
Market falls downward
1. Resistance Zone May Be Weak
Observation: A red rectangle marks a resistance area.
Disruption: This "resistance" level is based on a short-term bounce and may not have strong historical confluence. It lacks multiple rejections to establish it as a true resistance zone.
---
2. Overemphasis on Bearish Bias
Observation: Two bearish paths (blue and yellow) dominate the projection, indicating an expected drop.
Disruption: This may be prematurely bearish. There's no confirmation of rejection yet—no strong bearish candlestick pattern (like a shooting star, engulfing, or evening star) is visible in that zone.
---
3. Lack of Bullish Consideration
Observation: A small green arrow is shown but not given much weight.
Disruption: The recent candles show higher lows, indicating potential bullish pressure. If price breaks above the marked zone, it may trigger a short squeeze rally.
---
4. Volume Misalignment
Observation: Volume spikes during the bounce, especially on the green candles.
Disruption: Rising volume on a recovery typically supports continuation upward. This analysis ignores the bullish volume context and instead forecasts reversal.
---
5. No Higher Timeframe Confluence
Observation: 1-hour chart used in isolation.
Disruption: A strong bearish or bullish direction on the 4H or Daily chart would validate or invalidate this local setup. Without it, the trade thesis lacks broader context.

GBPUSD Short-Term Top Forming Target 1.3360GBPUSD has bounced slightly, but the structure remains heavy and indecisive. However, EURUSD and Gold 4H charts are starting to break down clearly.
EURUSD is dragging lower step by step.
Gold broke a key support zone.
Both are signaling that USD strength is returning — and GBPUSD is likely to follow.
🔍 Technical View
Price rejected from the 1.3465–1.3470 zone (FOMC CPI high)
Lower highs building on the 1H and 4H timeframes
Trading below the 50% retracement of the recent CPI rally
🧠 Key Observation
“A sharp drop on EURUSD from current price will confirm a top is in place on GBPUSD.”
If EURUSD breaks 1.1270 decisively, expect GBPUSD to follow with increased momentum.
🔽 Trade Bias
Bearish below 1.3435
Targets:
1.3360 (first fib cluster + liquidity pocket)
1.3330 (full wave completion)
Invalidation: Clear close above 1.3470
⚠️ Watch for:
U.S. PMI revisions or FOMC speakers to fuel USD move
GBP Retail Sales data tomorrow — potential catalyst

Market fall down 1. Weak Bearish Confirmation
Issue: The red arrow implies a confirmed downtrend, but the price action doesn’t show a strong breakdown—just a slight dip through a thin support zone.
Disruption: Without strong bearish candles or volume spikes, the breakdown could be a false move or liquidity grab before a reversal.
---
2. Overconfidence in Double Bottom Reversal
Issue: The blue “W” pattern and green arrow suggest a possible double bottom, but no clear second bottom has formed yet.
Disruption: Assuming a reversal prematurely is risky. The price may continue dropping, invalidating the bullish reversal scenario.
---
3. Target Placement Is Vague
Issue: The "Target" is placed arbitrarily along a horizontal line without referencing key resistance levels or technical confluences.
Disruption: Without support from Fibonacci, previous highs, or indicators, the target lacks reliability and could mislead trade planning.
---
4. Lack of Volume Context
Issue: The volume histogram shows a spike during a previous down move, but no current volume analysis is integrated into the decision.
Disruption: Price action alone, especially on lower timeframes, is insufficient without volume confirmation to validate breakouts or breakdowns.
---
5. No Risk Management Displayed
Issue: The analysis includes bullish and bearish paths but omits stop-loss levels or invalidation zones.
Disruption: Without clear invalidation, the trade becomes ambiguous and exposes the trader to unnecessary risk if price deviates unexpectedly.

Market next move
1. Overreliance on Basic Support/Resistance
Issue: The analysis uses a simple support/resistance concept without clear validation (e.g., no multiple touches or volume confirmation).
Disruption: Support could easily break if there's insufficient volume or strong bearish sentiment, invalidating the buy signal.
---
2. Lack of Confirmation Indicators
Issue: There's no use of confirmation tools like RSI, MACD, or moving averages.
Disruption: Entering a "Buy" based purely on support without a reversal signal (like bullish divergence or candle patterns) increases risk.
---
3. Premature Target Setting
Issue: The target is drawn quickly after a minor dip, with no fib levels, pivot points, or historical resistance considered.
Disruption: The price might face resistance before reaching the “Target,” especially around previous highs or psychological levels.
---
4. Ignoring Downside Risk
Issue: The scenario assumes price will bounce back but doesn’t show a stop-loss or contingency for a breakdown.
Disruption: If price breaks the "Support" zone, it could trigger a stronger bearish move—this risk is not accounted for.
---
5. Misleading Arrows
Issue: Arrows (red, yellow, blue) seem speculative and oversimplified.
Disruption: They imply a clear path, which can mislead traders into thinking price action follows linear logic—real markets are more chaotic.

Market next target
Disruption: Bearish Counter-Analysis
1. Rising Wedge Pattern:
The price action resembles a rising wedge, not a bullish channel.
Rising wedges are typically bearish reversal patterns, especially after strong prior bullish moves.
2. Decreasing Volume:
Volume is tapering off as price climbs, which often signals weakening buying pressure.
Lack of strong volume near resistance suggests potential fake-out risk.
3. Bearish Divergence Risk:
Not visible here, but on RSI or MACD, rising price with slowing momentum often triggers bearish divergence.
This could suggest an imminent drop.
4. False Breakout Trap:
The highlighted resistance zone could trap late buyers.
A fake breakout followed by a strong red candle could trigger stop-loss hunts, dragging price sharply lower.
5. Macro Event Warning:
The U.S. flag at the bottom suggests high-impact news is due.
If USD strengthens, GBP/USD may reject the resistance and drop fast, invalidating the long setup.
