EURUSD AT DECISIVE SUPPORTEURUSD AT A DECISIVE SUPPORT
EURUSD started creating a swing lower lows from failing to break a resistance point at 1.21776 price level. This gave about 3 swing lower lows and bounce back from a support price level at 1.20786.
This had a bullish trend towards 1.21664 price level and fell back towards a decisive price zone. If it doesn't break it's previous downtrend at 1.20955 and we see and upward movement above 1.21168 open a short buy towards the Daily resistance.
Further movement in a bullish movement would be towards it previous high 1.21664, although price would react at for a short move at 1.21555, if no breakout, price would continue it's upward movement.
For More Information Contact RSTradeView via Facebook
Forexpositive

GBPUSD - Short First and then Long for more PIPS📍 10+ years experience in markets
📍Professional Stock market and Forex trader
📍 Supply/Demand Zones
📍 Frequent updates
📍Covering FX / Gold Spot / NSE-BSE / DFM / ADX / US Stocks
📍Real time updates
⏳ 1 Day Chart analysis
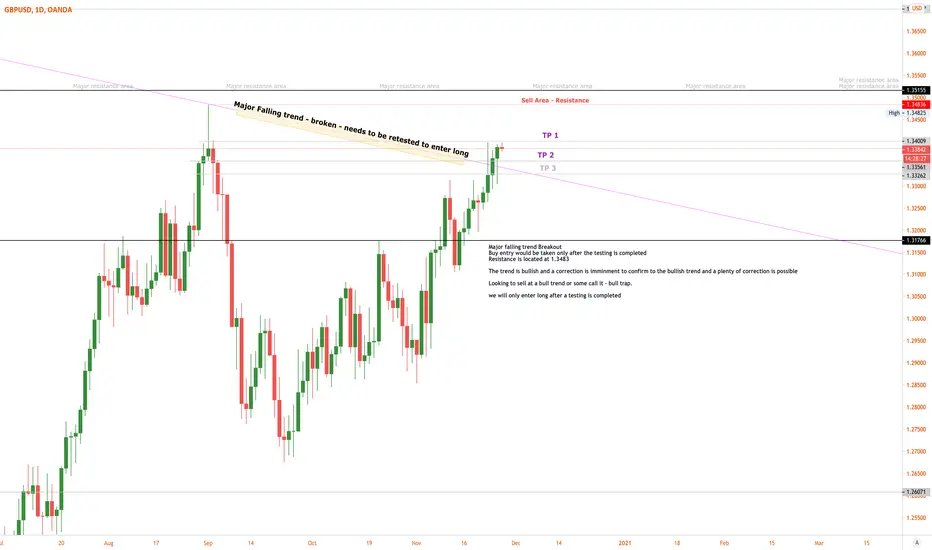
Looking to sell at 1.3483
Resistance located at 1.3483
Major Resistance located at 1.3515
Major falling trend is broken
Although - the trend is bullish overall
A correction is possible with plenty of room to move lowed without impacting the trend higher - ]
Looking to sell at rallies
KEY NOTE - SPECULATIVE SETUP - not a financial advise - do your own analysis
Please use STOP LOSS and don’t risk more then 1% or maximum 2% of your total account
Tagged Short as I expect short first then long after confirmation
📒 Retracement to support area
± 1.3310 fresh demand zone
± 1.3483 fresh supply zone
📒 Analysis / Trade Setup / Long and then short
± GBPUSD 1 day chart
± Short-term Bearish # Long term-Bullish
± Support and Resistance in play
± Major Falling broken and heading toward resistance area
± Bullish trend reversal
± Testing to towards to support area is needed to confirm the bullish trend
± Go long for more pips
± HAPPY TRADING
Short Target - 1.3310
Long Target - 1.36997

EURAUDUsing the Elliot wave added to the ICT strategy, we noticed that EURAUD pair finished the 4th wave and gave a direct turn on the weekly OB,
We see the pair buying for a very long time to clear the weekly top most high, which completes the wave 5, and after that it will then give a massive

EUR-JPY - *****Please follow, like, and support this idea, if it helped you in anyway*****
***This is not a financial advise***
In long at EurJPy - going well till this time hope to contonues
Expert, please share your view - will lear more from your view points


AUD/JPY Expecting a move up in Short term for correctionYo Traders,
AJ absolutely slid last week and the resistance did not hold as i expected.
If you see on the multiple TF analysis, the daily TF is now at the 200 EMA. If this holds we will be in a correction for the last swing approx in between the 61.8% and 50% FIB level on 4H TF. The RSI is also presently in the oversold range.
Lets wait and watch how the price moves.
Thanks
Madtradex

Euro/Swiss Expected to go longYo traders,
Another perfect setup for Euro.
EC has formed a perfect triangle pattern on the 4H TF.
Defined ABCDE (denoted by the arrows) points have been marked on the triangle and based on that i am expecting the price to move up with TP at Resistance.
Lets wait and watch
Thanks
Madtradex


EURGBP long term short signalThis pair will be falling soon.
Look further down towards 0 88920
Stop loss 0.89520


USDCAD- SELL NOW RUNNING +100USDCAD- BUY CLOSED DUE TO OPPOSITE SIGNAL IN THE OTHER DIREXCTION (-20 PIPS) OUR SELL NOW RUNNING +110!!!

USDJPY- V3 NOW RELEASED! SELL FROM THIS MORNINGUSDJPY- SELL THIS MORNING, NOW RUNNING IN DEEP PROFIT!
