Forexpositive
GBPCAD testing multiple FIB levelsGBPCAD consolidating within 1.7960-1.8660 since Feb 2014. It has bounce up from almost all FIB retracement levels, 38.2% 50% 61.8% 70.7% 78.6%. The only remaining FIB level not tested yet is the 88.6%. Based on the evidence of price action, i think GBPCAD should bounce up from 88.6%. Enter long around 1.8040, the 88.6% FIB retracement level.
Long GBPCAD 1.8030-40
SL 50pips
TP1 100pips
TP2 200pips
================
www.ForexPositive.com
Twitter @ForexPositive
=================
EURUSD long at technical supportOn the fundamental side. EURUSD has come a long way down from 1.4000. Ever since ECB announced negative deposit rates, cut interest rates and a whole host of monetary policies. With easy monetary policies for Euro for the next few years, the fundamental economic factors are bearish EURUSD.
On the technical side, there is a technical support level around 1.3300. Though fundamentals are bearish, i think there may be a strong bounce up from 1.3300 support zone. Those who are short EURUSD from higher levels, would probably take profit about 1.3300. Also 1.3300 is the 141.4% FIB extension of the prior downtrend wave.
Hence going long around 1.3300 seems like a plausible trade.
Long EURUSD 1.3290-1.3300
SL 1.3250
TP 1.3500
=====
www.ForexPositive.com
Twitter @ForexPositive
=====
NZDUSD buying dip dipsI'm waiting for a big dip to buy NZDUSD. After falling 140pips from the peak at 0.8830-40, this represents a good opportunity to buy for a bounce.
0.8660-70 is the 38.2% FIB retracement level & weekly S3 pivot support.
Long NZDUSD 0.8660-70
SL 0.8610
TP 0.8840
=====
www.ForexPositive.com
Twitter @ForexPositive
=====
USDJPY Scenario #2 if bearish USDJPYScenario #2 (if bearish USDJPY)
If the pivotal support/resistance at 100.60-80 fails to hold, and USDJPY makes a clean and decisive break below this level, there could be lots of stops from long positions to be triggered in the red circle.
With the next significant support 300pips away at 97.00, market could attempt to go for the short side.
In this case, short USDJPY when USDJPY retraces to 100.60-80.
Short USDJPY 100.60-80
SL 101.50
TP 97.00
=====
www.ForexPositive.com
Twitter @ForexPositive
=====
AUDCAD following bearish channelAUDCAD following bearish channel very well. This is a counter-trend trade. But the risk/reward is good, as we going long near the lower band of the bearish channel.
Wait for re-test of 0.9940-50, which is last week's low.
Long AUDCAD 0.9940-50
SL 0.9900
TP 1.0100
======
www.ForexPositive.com
Twitter: @ForexPositive
=====
AUDNZD rising channelAUDNZD trading nicely within a very defined rising channel. This is a long time frame rising channel, which started its moves since Dec 2013.
Will AUDNZD bounce up from point 3?? Enter long position around the 78.6% FIB retracement level.
Long AUDNZD 1.0630-40
SL 1.0580
TP1 1.0800
TP 1.1000
=====
www.ForexPositive.com
Twitter @ForexPositive
=====
Scenario #1 Bullish USDCAD On the longer term daily chart, USDCAD is trading within a very strong bullish channel. This bullish channel started on Sept 2012, with 4 confirmed trend lines bounces. Could there be a 5th bounce at the support zone of 1.0560-1.0600? Enter a long position here to find out!!
Long USDCAD 1.0570-80 (middle of the support zone)
SL 50-60pips
TP1 1.0800
TP 1.0900
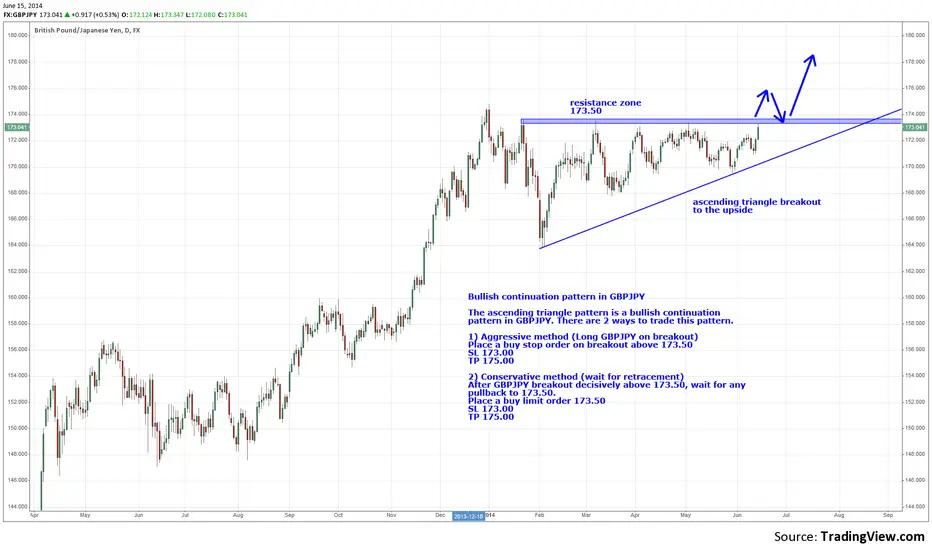
Bullish ascending triangle in GBPJPYBullish continuation pattern in GBPJPY
The ascending triangle pattern is a bullish continuation pattern in GBPJPY. There are 2 ways to trade this pattern.
1) Aggressive method (Long GBPJPY on breakout)
Place a buy stop order on breakout above 173.50
SL 173.00
TP 175.00
2) Conservative method (wait for retracement)
After GBPJPY breakout decisively above 173.50, wait for any pullback to 173.50.
Place a buy limit order 173.50
SL 173.00
TP 175.00
NZDUSD short on rallies0.8500 is the strong support which has now turn into resistance. I am looking for a deeper pullback to 0.8540, the 38.2% FIB retracaement, before initiating a short position.
The main risk to this technical picture is another RBNZ rate hike in June/July. If RBNZ raises interest by another 0.25% to 3.25%, the bearish TA could be negated.
Short NZDUSD 0.8530-40
SL 50pips
TP 0.8400
AUDUSD scenario #1. Short if bounce up from 0.9200 supportScenario #1 if AUDUSD bounce up from 0.9200 support
AUDUSD short on rally
Strong support zone at 0.9200. If 0.9200 support level holds, and AUDUSD rallies upward to 0.9330-40, look to enter short positions here. 0.9330-40 is a resistance zone & 61.8% FIB retracement.
Short 0.9330-40
SL 40-50pips
TP 0.9200
EURUSD sell on rallies modeWith ECB most likely doing a rate cut & negative deposit rate in June, it is sell rallies mode until the next ECB meeting in June.
Sell EURUSD at red resistance zone 1.3650-70. Target profits at green support zone 1.3500 & 1.3300.
Short EURUSD 1.3650-70
SL above 1.3700
TP1 1.3500
TP2 1.3300