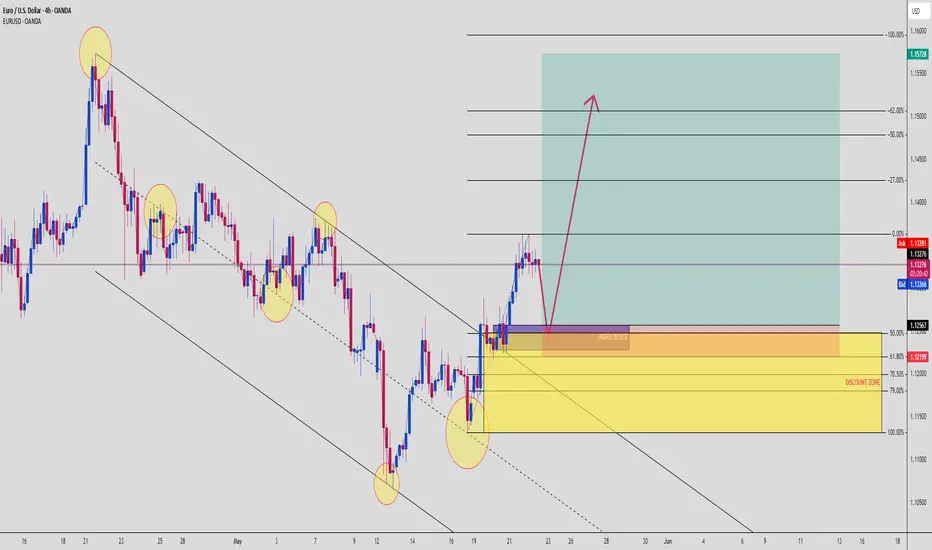
EURUSD Bounce Incoming? Smart Money Reversal BrewingThis EURUSD setup is a case study in smart money accumulation after a liquidity sweep + channel break. Price action is aligning like clockwork for a long setup, and the confluences are hard to ignore.
🧠 Breakdown:
🔻 Bearish Channel Structure: Market has respected this descending channel since early May — multiple taps, respected diagonals
🟡 Reversal Clues: Clean sweep of liquidity at the channel bottom with bullish engulfing candle
💰 Order Block + Discount Zone:
OB marked inside the 50%–79% retracement range
🔹 OB top: ~1.12567
🔹 Key entry: Between 1.12567 – 1.12199
🔹 SL: Below 1.1180 (clean under discount zone)
📈 TP zone: 1.15728 — previous market structure high and fib -100% level
✅ Risk-Reward: 1:5+ if played with precision
🔍 Why this setup is 🔥:
✅ Channel break = structure shift
✅ OB + Fib 61.8%–79% = strong demand confluence
✅ Liquidity below equal lows already taken
✅ Sharp bullish move after sweep = signs of big players entering
✅ Price likely to pull back to mitigate before exploding
🧠 Institutional Logic:
“Liquidity fuels price. Structure guides it. Confluence confirms it.”
The market swept lows, flipped structure, and now is likely returning to fill orders before the next leg up. This is a classic bullish mitigation play.
📊 If price taps into the OB and shows bullish confirmation — this is a sniper zone.
Set alerts. Wait for the wick. Enter on the flip. Let the market work for you, not the other way around.
Forexsetup
"Dare to Swipe EUR/USD Gains with Our Risky Heist Blueprint?"Ultimate EUR/USD Heist Plan: Snag Profits with the Thief Trading Strategy! 🚀💰
🌍 Greetings, Wealth Raiders! Ciao, Hello, Bonjour, Hola! 🌟
Fellow profit hunters, get ready to crack the EUR/USD "The Fiber" Forex vault with our slick Thief Trading Strategy! 🤑💸 This plan blends razor-sharp technicals and fundamentals to loot the market. Follow the chart’s long-entry blueprint to strike at high-risk zones like the Red MA (short-term traders) or the Red Zone Resistance (long-term traders). It’s a wild ride—overbought conditions, consolidation, and potential trend reversals mean bears are lurking! 🐻 Stay sharp, grab your profits, and treat yourself—you’ve earned it! 🎉💪
📈 Entry: Storm the Vault!
The market’s ripe for a bullish grab! 💥 Place buy limit orders within the most recent 15 or 30-minute swing low/high levels. Set alerts on your chart to stay locked in. 🔔
🛑 Stop Loss: Guard Your Loot!
Set your Thief SL at the nearest swing low on the 4H timeframe for day/swing trades. Adjust based on your risk tolerance, lot size, and number of orders. Safety first! 🔒
🎯 Targets: Claim Your Prize!
🏴☠️ Short-Term Target: 1.14700
🏴☠️ Long-Term Target: 1.17000
👀 Scalpers, Listen Up!
Stick to long-side scalps. Got deep pockets? Jump in now! Otherwise, join swing traders for the heist. Use trailing stop-loss to lock in gains and protect your stash. 💰
🐂 Why EUR/USD is Hot!
The Fiber’s bullish surge is fueled by key fundamentals. Dive into Macro, COT Reports, Quantitative Analysis, Sentiment, Intermarket trends, and future targets via the linkss below for the full scoop. 👉🔗. Stay informed to stay ahead! 📰
⚠️ Trading Alert: News & Position Management
News releases can shake the market like a heist gone wrong! 🗞️ To protect your profits:
🚫 Avoid new trades during news events.
🛡️ Use trailing stops to secure running positions.
💥 Boost the Heist!
Hit the Boost Button to supercharge our Thief Trading Strategy! 💪 Every click strengthens our crew, making it easier to swipe profits daily. Join the squad, trade smart, and let’s make money rain! 🌧️💵

GBP/USD Cable Heist:Join the Thief Trading Style to Raid Profit!GBP/USD Cable Heist Plan - Thief Trading Style 😎💸
Greetings, wealth chasers and market bandits! 👋💰
Welcome to the Thief Trading Style, blending sharp technicals with savvy fundamentals to raid the GBP/USD "Cable" Forex Market. 📊 Follow the strategy outlined in the chart, focusing on long entries targeting the high-stakes Red Zone. 🌋 Expect an overbought market, consolidation, or trend reversal where bears might set traps. 🐻 Nail the plan, grab your profits, and treat yourself—you’ve earned it! 🎯💵🎉
Entry 📈: The heist begins! 🚨 Wait for the MA breakout at 1.34700, then strike for bullish gains. 🐂 Set buy stop orders above the moving average or place buy limit orders within a 15/30-minute timeframe at the recent swing high/low. ⏰ Don’t miss the move—set a chart alert to catch the breakout! 🔔
Stop Loss 🛑: Listen up, crew! 🗣️ For buy stop orders, hold off on setting your stop loss until after the breakout. 🚀 Place it at the recent swing low on the 4H timeframe (1.33300) for swing/day trades. 📍 Adjust based on your risk, lot size, and number of orders. Play smart, or you’re dancing with danger! 🔥😈
Target 🎯: Aim for 1.37000 or bail early if the market shifts. 🏃♂️ Scalpers, stick to long-side trades. 👀 Got deep pockets? Jump in now. 💪 Otherwise, join the swing traders and execute the plan with a trailing stop loss to secure your loot. 🔒💰
Market Outlook: GBP/USD is riding a bullish wave, fueled by key fundamentals. 🐃 Dive into the COT Report, macro data, sentiment, intermarket analysis, and future trend targets via the linkss below for the full scoop. 🔗👉
Why This Trade?: The bullish setup on GBP/USD is backed by strong technical signals, with the MA breakout confirming upward momentum. 📈 Fundamentals, including favorable COT positioning and positive macro data, suggest sustained strength in the pound. 💪 Intermarket correlations and sentiment analysis further align with a bullish outlook, making this an ideal moment to strike the Cable for potential high rewards. 🌟 The Red Zone target at 1.37000 offers a prime risk-to-reward ratio for disciplined traders. 🤑
⚠️ Trading Alert: News & Position Management 📰:
News releases can shake up prices and volatility. 🌪️ To stay safe:
Skip new trades during news events. 🚫
Use trailing stops to lock in profits and protect open positions. 🔐
Boost the Heist! 🚀: Support our plan by hitting the Boost Button to supercharge our market raids. 💥 With the Thief Trading Style, we’re stacking profits daily. 📈 Join the crew, execute the plan, and let’s make money moves! 💪🤝😺
Stay sharp for the next heist plan. Until then, keep robbing the markets! 🤑🐱👤

GBPUSD Retests Bullish Order Block – Smart Money Loading Up!📈 GBPUSD SMC Bullish Setup – Institutional Re-Entry Into Power Zone
Traders, this is a prime example of how Smart Money manipulates liquidity, taps deep into premium OBs, and prepares for explosive continuation moves. Let’s break it down step-by-step…
🔍 Market Structure Insight:
We’ve seen a clear bullish BOS (Break of Structure) after a strong impulsive move that broke past previous highs.
Now price is retracing into the bullish Order Block, giving a golden opportunity for re-entry — but only if you know what to look for.
🔲 Key Confluences:
💎 Order Block:
Marked between 1.3332 – 1.3290, this purple zone aligns with:
Breaker candle after a liquidity sweep
Prior imbalance zone
Institutional volume spike
📐 Fib Retracement:
From the swing low to high:
61.8% → 70.5% golden zone nested inside the OB
79% just below — great stop loss placement
📉 Weak High Above:
Current price action shows the market stalling near a weak high at 1.3400 — ripe for targeting in the next expansion.
📌 Strong Low at 1.3245:
Protected unless structure breaks. This helps confirm bullish bias remains intact.
🧠 Smart Money Logic:
This isn't retail "support."
Smart Money took out early sellers, pushed price impulsively, then returned to mitigate orders inside the OB before continuing the expansion.
This retracement = institutional reloading zone.
That red candle into purple? That’s the bait. 🧨
🎯 Entry Plan:
✅ Wait for bullish confirmation inside OB (engulfing, MS shift, or liquidity wick)
✅ Ideal entry at 1.3332–1.3300
✅ Stop below 79% Fib (~1.3289)
✅ Target:
TP1: 0% Fib (~1.3400)
TP2: -27% Fib extension (~1.3445)
TP3: Moon mission? 😏
RRR ~ 1:3.5+ — solid trade for swing traders and intraday scalpers alike!
🧘♂️ Psychology & Patience Reminder:
Let price come to you.
This setup rewards discipline and confirmation — don’t FOMO early.
Watch for trap wicks and engineered fakeouts at the OB zone.
You’re not chasing price.
You’re sitting where Smart Money leaves footprints. 👣
⚠️ Risk Tip:
✅ Stick to your model
✅ 1–2% risk max
✅ Scale partials at key levels
✅ Don’t revenge trade if price reacts first without you — next setup is always coming
🔁 Summary:
This GBPUSD chart is a masterclass in Smart Money structure:
Bullish BOS
Return to Order Block
Fib confluence
Weak high liquidity target
Perfect RRR setup
🧠 Let’s play it like a pro. If OB holds — the market flies. If not, we step out, risk-managed, and wait.
📣 Comment “GBPUSD SNIPER” if you’re ready for the OB bounce.
📈 Tag your trading fam to keep them on the money wave!

USDCAD Consolidation Within Bullish Flag – Targets 1.4130USDCAD is consolidating inside a descending flag structure following a strong impulsive rally earlier in May. The current pullback is orderly and corrective, indicating potential for continuation higher. If price breaks above 1.3960, this flag breakout could extend toward 1.4130 and possibly 1.4225. With CAD weakening on soft oil prices and USD regaining strength from yield-driven flows, the bias remains bullish while price stays above 1.3870.
🔍 Technical Analysis
Pattern: Bullish flag forming after a strong rally
Support Zone: 1.3870–1.3900 → base of flag
Resistance/Breakout Zone: 1.3960–1.3980 → upper flag line
Structure:
Higher lows holding firm
Fib confluence near 1.3933 (23.6% retracement)
Target Levels:
1.4130 – 50% fib level + previous structure resistance
1.4225 – 61.8% fib zone from March–April high
📈 Bias: Bullish continuation on breakout
🌍 Fundamental Context
🇺🇸 U.S. Dollar (USD)
Supported by:
Higher bond yields
Fed expected to hold rates higher for longer
Safe-haven inflows post-Moody’s downgrade fading
USD Index recovering broadly across majors
🇨🇦 Canadian Dollar (CAD)
Oil prices softening due to global demand concerns (China slowdown, US inventories)
BoC likely done hiking — no fresh bullish catalysts
CAD correlation with crude oil adds downside risk if energy markets weaken further
🎯 Trade Plan
Entry: Break and close above 1.3960
Stop Loss: Below 1.3870 (flag support zone)
Targets:
TP1: 1.4130 (structure resistance + fib level)
TP2: 1.4225 (swing high + golden ratio)
⚠️ Risk Factors to Watch
If USD sentiment shifts (e.g., dovish Fed speaker) → breakout may fail
Crude oil rebound would support CAD and cap USD/CAD upside
False breakouts common near 1.3960 — wait for confirmation (strong candle close)
🧭 Conclusion
USD/CAD remains in a bullish consolidation phase with a clear continuation setup. A break above 1.3960 would confirm a flag breakout targeting 1.4130 and 1.4225. With the macro backdrop favoring the USD and energy-linked CAD weakening, this setup offers clean structure and potential for follow-through.

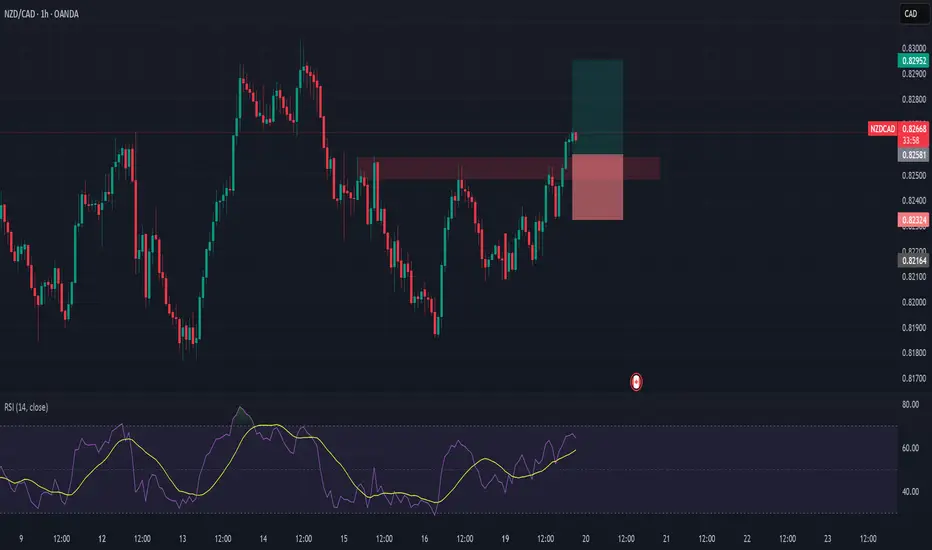
NZDCAD Long – Breakout + Retest Opportunity Backed by Macros🔹 Pair: NZD/CAD
🔹 Timeframe: 1H
🔹 Direction: Long
🔹 Status: Breakout of resistance → waiting for retest at turncoat support
🔹 Entry Zone (Planned): 0.8250–0.8260
NZD is the top gainer this week with strong conditional momentum and seasonal strength. CAD is stagnating under weak macro support. We're now watching for a pullback to the breakout zone for an ideal long entry.
Will look to enter between 0.8250–0.8260, SL under 0.8230, and aiming for 0.8295+.
📊 Macro & Fundamental Confluence
🇳🇿 NZD – Bullish
Biggest Weekly Gainer: Conditional score surged 🚀 from 8 → 13
Seasonal Bias: Strong buy signal from mid-May onward
Central Bank: RBNZ remains hawkish amid stable inflation targets
Risk-On Regime: VIX < 20 favors high-beta currencies like NZD
🇨🇦 CAD – Bearish
Policy vs Data Mismatch: BoC hawkish, but weak retail & CPI data
Global Headwinds: Commodity weakness and trade risks weigh on CAD
🧩 Confluences
✅ NZD macro & conditional strength
✅ CAD stagnation
✅ Risk-on favors NZD
✅ Technical breakout + higher high confirmed
Market next move
1. Bearish Rejection from Resistance
Disruption: The price has struggled to break above the 3,240–3,250 area multiple times. This could indicate strong resistance.
Implication: If the price fails again, we may see a rejection and a move down towards the 3,180–3,160 support range instead of a bullish breakout.
---
2. Volume Analysis Caution
Disruption: The volume during recent upward moves is not significantly higher than the downswings.
Implication: Weak buying volume might not support a strong breakout, suggesting a fakeout could occur.
---
3. False Breakout Possibility
Disruption: A possible fake breakout above the red box might lure in buyers before a reversal.
Implication: Watch for a "bull trap" where the price briefly breaks up and then reverses sharply downward.
---
4. Macro Events Ahead
Disruption: The timing (around May 20) could align with macroeconomic news (e.g., Fed minutes, CPI, etc.).
Implication: News can trigger volatility and negate technical expectations.
---
5. RSI or Momentum Indicators?
Disruption: Without checking RSI or other momentum indicators, the analysis might lack confirmation.
Implication: Overbought/oversold conditions could shift the bias unexpectedly.

SMC Trap = Clean CHoCH + OB Long, Targeting Liquidity Sweep!We’re tracking a textbook Smart Money Concept (SMC) long setup on EURJPY, 30M timeframe, with clear structure shift and clean OB entry. Here's the full breakdown for traders:
🔄 Market Structure Shift:
Major bearish trend visible from previous candles.
Sharp rejection followed by a Change of Character (CHoCH) indicating possible bullish reversal.
🧱 Order Block Zone:
Price swept liquidity to the downside and tapped into a marked Bullish Order Block at 162.195–162.266.
Entry triggered within this OB zone, with tight risk placement below Strong Low.
🔁 Entry Setup:
Entry: Inside OB at 162.266
Stop Loss: Just below the OB at 162.195 (Strong Low protected)
TP1: 70.50% retracement near 162.650
TP2: Full Buy Side Liquidity sweep @ 162.768 (Weak High Targeted)
🧮 RRR (Risk-to-Reward):
Approximate RRR: 1:6+ — High probability trade if market structure follows through.
🧲 Key Levels Highlighted:
🔹 CHoCH confirms shift to bullish
🔹 OB Zone: High confluence with liquidity grab + candle imbalance
🔹 Buy Side Liquidity: Obvious target for institutions
🔹 Weak High: Ready to be taken out
📈 What To Watch For:
Bullish continuation towards 162.768
Strong impulsive move breaking above minor resistance
Potential re-entries on lower TF OBs (5M–15M)
🧠 Pro Tip for Traders:
Don’t chase—wait for CHoCH + OB confirmation combo. This type of setup works best when confluence aligns: OB + CHoCH + liquidity sweep = 🔥

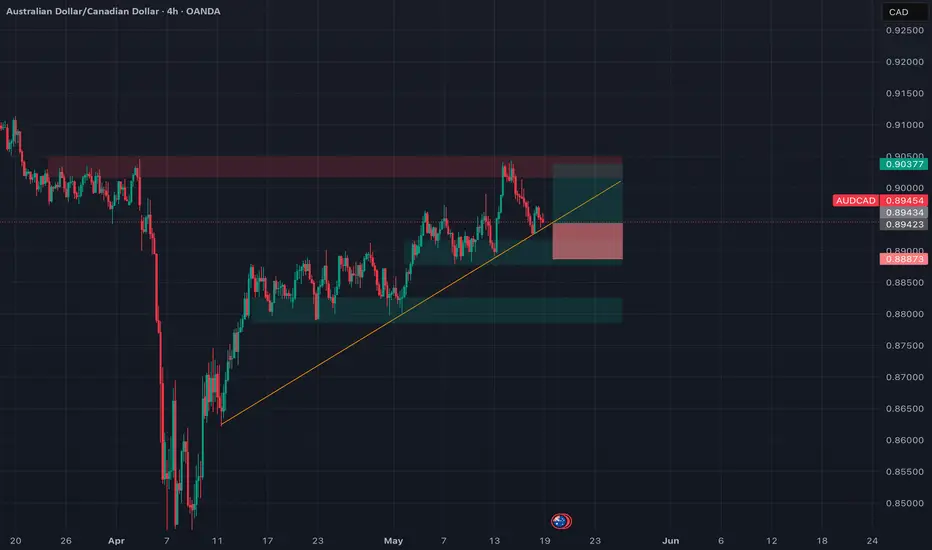
AUDCAD Long: Riding Aussie Strength vs Weak Loonie 🔹 Pair: AUD/CAD
🔹 Timeframe: 4H
🔹 Direction: Long
🔹 Strategy: Trend Continuation + Macro Confluence
🔹 Trade Active: 📍 0.8945 (CMP)
📊 Fundamental Bias
🇦🇺 AUD – Bullish
• Seasonal Surge: Historically strong from May 19 to June 10.
• Conditional Score Gain: AUD rose from 21 → 24 (momentum improving).
• Macro View: Inflation stabilizing, dovish stance offset by improving sentiment.
• VIX < 20: Risk-on conditions favor AUD.
🇨🇦 CAD – Bearish
• Flat Conditional Score: No improvement (2 → 2).
• Hawkish CB but Weak Data: CPI softening, trade risks persist.
• Global Sentiment: Oil stagnation + cautious BoC tone = headwinds for CAD.
⸻
🧠 Confluence Summary
✅ AUD macro + seasonal strength
✅ CAD remains fundamentally weak
✅ Risk-on supports commodity currencies
✅ 4H trendline support holding
⸻
🖼️ Technical Setup
• Entry: 0.8945
• Stop Loss: 0.8890 (below ascending trendline + support zone)
• Take Profit: 0.9036 (prior resistance + TP1)
• Risk:Reward: ~1.67
🟠 Optional Target: 0.9045 for extended move.
📌 Outlook
I’m bullish on AUDCAD for the week of May 19–23, supported by:
• Seasonal patterns
• Risk tone
• CAD stagnation
• Clear trend structure
Will look to trail SL as price closes above 0.8975. Clean invalidation below 0.8890.
⸻
💬 What’s your bias on AUD this week?
Drop a comment & let’s discuss 📉📈
EUR/USD Playbook: Precision Day Trading from Range to BreakoutEUR/USD is in a bullish correction on the daily chart, holding above the 21-EMA with compressed moving averages signaling consolidation. The pair trades in a 1.1170–1.1230 range on the 1-hour chart, presenting ideal day-trading opportunities. Volume spikes at support (1.1170) and weakness near resistance (1.1230) reinforce this range.
Use this structure to your advantage:
Long near 1.1170–1.1185, backed by EMA ribbon support and RSI recovery from oversold levels.
Short near 1.1225–1.1235, where RSI typically overextends and price stalls on weak volume.
Use tight stops (5–10 pips) and take profits near range edges.
If price breaks and holds above 1.1235, target 1.1265–1.1300 on a bullish continuation. Below 1.1170, expect deeper downside toward 1.1120.
Stick with the range until a breakout is confirmed by volume and candle closes.

"Pound vs Loonie Forex Heist: Snag GBP/CAD Profits with Thief"🌍 Hello, Global Money Heisters! Ciao, Hola, Salaam, Bonjour! 🌟
Dear Profit Pirates & Cash Chasers, 🤑💸✨
Here’s the slick plan to raid the GBP/CAD "Pound vs Loonie" Forex Vault with 🔥Thief Trading Style🔥, blending sharp technicals and juicy fundamentals. Follow the chart’s long entry strategy to hit the high-risk RED Zone. It’s a wild spot—overbought, consolidating, with bears lurking for a trap. Let’s nab those profits and treat ourselves! 🎉💰
---
GBP/CAD Real-Time Data (May 15, 2025, UTC+1) 📈
- Current Rate: ~1.8540 CAD per GBP, down -0.04% today but holding strong. 📊
- Retail Sentiment: ~65% bullish, eyeing a GBP climb. 😎
- Institutional Sentiment: ~55% bullish, cautiously optimistic. 💼
---
Heist Plan Highlights 🏴☠️
- Entry 📌: Wait for GBP/CAD to smash past 1.8650 (previous high) for a bullish breakout. Set Buy Stop above the Moving Average or Buy Limit at recent 15/30-min swing lows for pullbacks. Set an alert to catch the move! 🚨
- Stop Loss 🛑: Place SL at 1.8400 (4H swing low) for day trades. Adjust based on your risk, lot size, or multiple orders. If using Buy Stop, set SL post-breakout to avoid whipsaws. 🔥
- Target 🎯: Aim for 1.8950 or bail early if the RED Zone feels too hot. 🏃♂️
- Scalpers 👀: Stick to long scalps with trailing SL to lock in gains. Swing traders, join the heist with bigger moves! 💸
---
Why GBP/CAD is Hot 🔥
- Bullish Momentum: Technicals show GBP strength, backed by retail (65%) and institutional (55%) optimism. 📈
- Fundamentals: Check COT reports, macro news, and intermarket analysis for the full picture. Stay sharp with sentiment and future trends! 📰🌎
- News Alert 🚨: Avoid new trades during big news drops. Use trailing SL to protect running positions. 🛡️
---
Boost the Heist! 💪
Hit that Boost Button to supercharge our Thief Trading squad! 🚀 Let’s make stealing pips a breeze. Stay tuned for the next epic heist plan, Money Makers! 🤑🐱👤🎉
Happy Trading, and let’s loot the market together! 🤝❤️

USDJPY Setup: Weak Highs, Smart Money Buys Liquidity!!📊 USDJPY is showing signs of a Smart Money reversal from the discount zone.
This 30-minute chart reveals institutional intentions hiding in plain sight — with clear signs of engineered liquidity grabs and the potential for a strong bullish continuation.
🧠 What’s Happening on the Chart:
✅ Price has swept sell-side liquidity below the recent lows
✅ Retraced cleanly to the 61.8% Fibonacci level at 146.26, a classic Smart Money entry zone
✅ The current price is hovering around the 50% retracement, forming a potential higher low structure
📈 Bullish Confluence:
Price is rebounding from a discount zone (golden ratio: 61.8% Fib)
There’s a clearly defined "weak high" marked around 147.00 — Smart Money typically targets these areas
Above that, there are two stacked buy-side liquidity levels:
147.670
148.282
Final target? The liquidity pool near 148.654 — a clean magnet for price
🎯 Trade Idea:
Long Bias from 146.26–146.43 zone (Smart Money re-entry)
Targets:
TP1: 147.00 (Weak High)
TP2: 147.670 (Buy Side Liquidity)
TP3: 148.282 – 148.654 (Full Liquidity Sweep)
Invalidation: Clean break below 146.20 with strong bearish volume
📌 Why This Setup Works:
This setup uses Smart Money Concepts (SMC):
Weak Highs often signal institutional targets
Fair Value Gap (FVG) + Fib confluence adds strong bullish probability
Retail shorts get trapped, thinking the rally was a pullback — while institutions accumulate at discount
🧠 Pro Tip:
Watch for confirmation with a bullish engulfing candle or break of short-term structure before full entry.
Front-running the Smart Money leads to losses. Let them move first.
💬 Comment "USDJPY MOVE" if you're planning to trade this setup
💾 Save this chart for later — this is how the big players trade FX.

GBPCHF Breakout Eyes 1.1190–1.1290 as Bullish Momentum BuildsGBP/CHF has broken out of a descending wedge formation on the 4H chart, indicating a bullish shift in momentum. This move is supported by a recovering GBP, driven by better-than-expected UK GDP data and BoE easing expectations already priced in. Meanwhile, CHF is softening on safe-haven unwinding and a less aggressive SNB tone. Technicals point to a clean breakout with immediate upside targets at 1.1116 and 1.1190, with potential extension toward 1.1290.
🔍 Technical Analysis
Pattern: Descending wedge breakout on the 4H chart — a bullish continuation pattern.
Breakout Confirmation: Price is now trading above wedge resistance (~1.1045), showing follow-through buying.
Support zone: 1.1000–1.1040 (retest area if price pulls back)
Fibonacci Levels:
1.1116 → 50% Fib retracement + prior resistance
1.1190 → 61.8% Fib and historical reaction zone
1.1290 → 78.6% retracement and next key resistance
📈 Bullish Signals:
EUR/GBP overlay shows inverse correlation supporting GBP strength
Higher lows forming since April → structure is rising
Clean breakout with space to run before major resistance hits
🌍 Fundamental Context
🇬🇧 British Pound (GBP):
UK Q1 GDP: +0.6% q/q — solid beat vs expectations
BoE Positioning: Rate cut expected in H2 2025, but not imminent; GBP supported in the meantime
Trade Conditions: Signs of recovery, but BoE not overly dovish yet
Market Tone: GBP favored short-term due to economic resilience
🇨🇭 Swiss Franc (CHF):
SNB Stance: Recent tone shift toward caution amid deflation signals
Safe Haven Demand: Easing due to progress in U.S.–China trade talks
Macroeconomic Data: Mixed; CPI soft, and growth modest
CHF Outlook: Mildly bearish unless geopolitical risk reignites
🎯 Trade Setup
Entry: Breakout already underway at 1.1050
Upside Targets:
1.1116 (first TP)
1.1190 (major resistance zone)
1.1290 (extension zone)
Stop Loss: Below 1.1000 (below wedge retest zone)
Strategy: Buy-the-dip on pullback to 1.1040–1.1015, or hold breakout long
🧭 Conclusion
GBP/CHF shows a clean bullish breakout both technically and fundamentally. With the UK economy showing near-term resilience and the SNB expected to remain cautious, GBP strength may persist in the short run. Unless geopolitical risks resurface to revive CHF demand, the pair looks poised for a rally toward 1.1190 and possibly 1.1290 in the coming sessions.

NZD/USD "Kiwi" Forex Vault Heist Plan!🌟 Yo, what's good? Salaam! Ciao! Konnichiwa! 🌟
Dear Cash Snatchers & Market Bandits, 🤑💰💸😎
Get ready to raid the NZD/USD "Kiwi" Forex Vault with the slickest 🔥Thief Trading Style🔥 Our tech-fueled, fundamental-backed heist plan is locked and loaded for a long-entry score. Stick to the chart’s sneaky blueprint and aim to slip out near the Red Zone—a high-stakes trap where overbought vibes, consolidation, and bearish bandits lurk. 🏆💸 Grab your loot and treat yourself, you sly foxes! 💪🎉
- 📈 Entry Point: The heist’s ON! 🕵️♂️ Lay low for the MA pullback at Institutional Buy Zone 1 (0.57700) or Buy Zone 2 (0.56000), then pounce for juicy bullish profits! 🚀
- 🛑 Stop Loss: Yo, ears up! 🗣️ If you’re setting a buy stop order, don’t touch that stop loss ‘til the breakout pops off. 📍 Stash it at the closest swing low on the 4H: Buy Zone 1 SL at 0.56500, Buy Zone 2 SL at 0.54500. Size it to your risk, lot, and multi-order game plan. Mess around, and you’re toast! 🔥
- 🎯 Target: Shoot for 0.62500 or ghost out early with the goods. 💰
- 👀 Scalper Crew: Long-side scalping only! Got deep pockets? Dive in. Tight budget? Roll with swing traders and slap on a trailing SL to shield your stash. 🧲
- 📊 Why It’s Lit: The Kiwi’s bullish run is powered by fundamentals, macro trends, COT reports, quant analysis, market vibes, and intermarket signals. Scope the full scoop from legit sources! 🌍🔗
⚠️ Heads-Up: News drops can flip the game! 📰 Stay sharp:
- Dodge new trades when news hits.
- Slap trailing stop-losses on to lock profits and cover your back.
💖 Fuel the heist! 💥 Smash that Boost Button to power up our Thief Trading Style squad. Swipe profits daily like a pro and roll with the slickest crew! 🏆🤝🚀 Catch you on the next big score, bandits! 🤑🐱👤😎

XAUUSD – 1h Fib Premium Rejection Setup + Liquidity Sweep📉 XAUUSD SHORT SETUP – May 8, 2025 | SMC Confluence Mastery
Gold is showing a high-probability short scenario off a premium Fib retracement zone with rejection from key structure and Smart Money reversal patterns.
Here’s why this 1h setup could be the next sniper entry for Chart Ninjas:
🧠 KEY CONFLUENCES IN THIS TRADE:
🔺 Entry in Premium Zone: Price retraced into 70.5%–100% zone and rejected cleanly
🧊 Liquidity Above: Engineered buy-side liquidity was swept before reversal
📉 Bearish Order Flow: Consecutive lower highs + break of structure (BOS)
🛠️ Entry at 78.6% zone (~$3,416.99), stop above swing high
🕳️ Targeting Deep Discount: TP at ~-62% Fib level, near $3,262.01
🚨 Risk-Reward: Approx. 1:4.5 RR — clean structure with low risk
⚙️ Trade Execution Strategy:
Look for rejection candles / breaker blocks in the 78–100% zone
Set SL just above the swing high (~$3,420)
Target full imbalance fill into deep discount zone
Manage with trailing stop after price hits 0% or -27%
📊 Setup Summary:
Timeframe: 1H
Bias: Bearish
Entry: Premium Fib Rejection
TP: -62% Fib Extension
SL: Above 100% level
RR: 1:4.5+
Confluences: Fib, Liquidity Sweep, BOS
💬 Chart Ninja Insight:
“Smart money never sells lows or buys highs. They sell where liquidity is hiding—just like this.”

GBPUSD – 30m Buy Setup | FVG Entry + ChoCh + -27% Fib Target💷 GBPUSD Long Setup | May 8, 2025 | 30m Smart Money Model
This 30-minute GBPUSD chart shows a perfect Smart Money shift backed by a clean Change of Character (ChoCh), a deep pullback into a Fair Value Gap (FVG), and confirmation via breaker block reentry.
Let’s break it down:
🔍 KEY CONFLUENCES:
🟪 FVG between 1.32909 – 1.33112
🔄 ChoCh confirms structural shift from bearish to bullish
📉 Entry inside 50–79% Fib retracement (Discount Zone)
🧱 Breaker Block confluence with internal BOS
🎯 Target: -27% Fib extension = 1.33737
🛡️ Stop below 100% Fib ~1.32400
📈 Setup Specs:
Timeframe: 30min
Bias: Long
Entry Zone: 1.33090 – 1.33110
TP: 1.33737 (Fib -27%)
SL: ~1.32400
RR: Approx. 1:3.5+
💡 Why It Matters:
Smart Money often accumulates positions in hidden imbalances like this FVG zone. Retail traders get shaken out on the pullback — meanwhile institutions reload just below previous liquidity sweeps. The ChoCh confirms the shift, and boom — the liquidity vacuum fuels a launch to premium levels.
🎯 Chart Ninja Tip:
“ChoCh isn’t just a signal… it’s a signature. It tells you Smart Money is changing sides.”

CAD/USD growing more bullishIn this chart we can see the CAD/USD conversion rate has formed a bullish divergence.
This pattern is formed when price action creates lower lows whereas simultaneously the RSI creates higher lows.
This divergence is indicative of a future sharp and sudden rise in price.
Entered (2) 6CM contracts at .72145
Target price of .72645

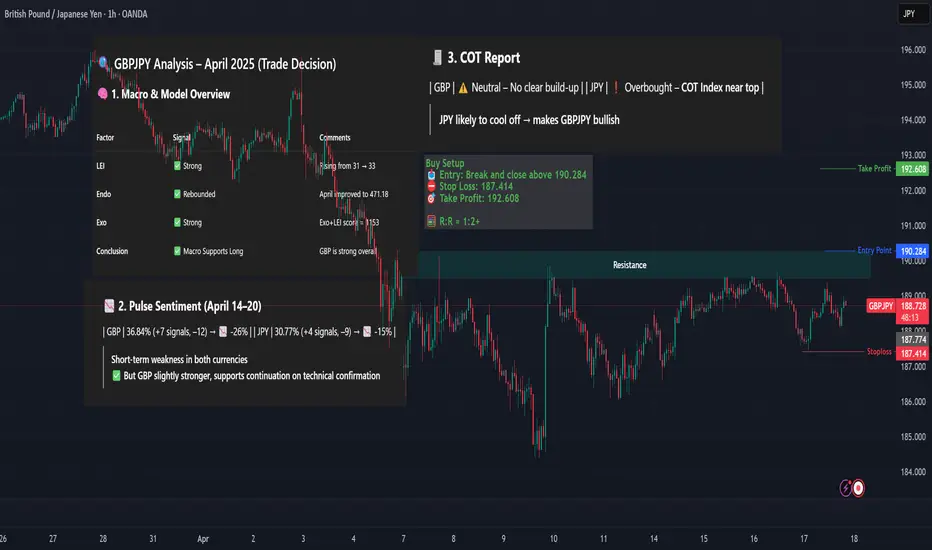
GBPJPY – Breakout Buy Setup (Macro Alignment)GBPJPY long setup backed by rising LEI, strong macro trend, JPY weakness, and bullish seasonal window approaching after April 24.
Waiting for breakout confirmation above resistance to validate entry.
🧠 Macro + Model Alignment
LEI score rising → 33 (April), macro outlook improving
Exo+LEI = 1153 → strong bullish signal
JPY COT: Overbought → reversal risk
GBP fundamentals outperform JPY across April
Seasonality: GBP bearish till April 24, then bullish into month-end
📌 Best entry window = April 25+
📊 Technical Setup – 1H Chart
Price testing key resistance zone ~190.00
Watching for breakout & candle close above resistance for confirmation
Clear R:R with defined structure zones
📥 Entry: Break and close above 190.284
⛔ Stop Loss: 187.414
🎯 Take Profit: 192.608
🧮 R:R ≈ 1:2+
Confirmation required before entry ✅
XAUUSD | Bearish Order Block Rejection in Premium | Short Setup🔥 XAUUSD – 5M Timeframe Smart Money Setup | April 30, 2025
Gold just printed the kind of setup Smart Money waits for: liquidity sweep + order block retest + Fibonacci confluence — all in the Premium Zone.
📍 Price Action Breakdown:
We marked a Clear Bearish Order Block after a strong move down.
Price retraced cleanly back into the 61.8%–79% Fibonacci Premium Zone — the exact area where Smart Money sells to retail buyers.
Price wicked into the OB, filled the imbalance, and showed strong bearish rejection.
Entry triggered on confirmation candle after tap.
🎯 Key Setup Elements:
✅ OB in Premium
✅ Bearish BOS before entry
✅ Fibonacci rejection (61.8–79%)
✅ Clean mitigation of the OB
✅ Low time frame confirmation entry
🧠 Smart Money Flow:
Retail: “Gold’s recovering! Time to buy!”
Smart Money: “Thanks for the liquidity. Here’s your SL.” 🫡💸
Every wick into that OB zone is a buy stop getting sniped by institutions.
💥 Trade Setup:
Entry: OB rejection zone at 3,328–3,332
SL: Above 3,332 (wick high / OB invalidation)
TP:
TP1: 3,314
TP2: 3,306
TP3: 3,299 (full RR completion)
Risk:Reward ~ 1:3+
📈 Risk Management Note:
Trailing SL advised once we reach TP1. Let price prove itself. Gold is volatile, but this structure is textbook.
🔮 What to Watch Next:
BOS below 3,320 confirms further bearish momentum.
Any re-entry into OB without momentum = trap.
🎤 Final Thoughts:
This is a play straight out of the institutional handbook — it’s not about chasing, it’s about letting price come to you.
Patience = Profit. 🧠💰
🗣️ Drop “GOLDEN SNIPER” in the comments if you caught this too.
💾 Save this chart — it's a lesson in precision.
👥 Tag your scalping squad — no excuses on this clean setup.

EURNZD strong daily demand level at 1.89. Long biasSupply and demand imbalances are the driving forces behind price movements in the Forex market. By identifying these key zones or imbalances, traders can anticipate high-probability reversal or continuation setups. Today, we’ll analyze the EURNZD cross pair, which has recently formed a strong demand imbalance at $1.89—the most significant impulse in months.
The Power of Supply & Demand Imbalances
Supply and demand trading revolves around identifying areas where price has made a strong, impulsive move (demand or supply zone) and then waiting for a retracement into that zone for a potential reversal or continuation.
Key Characteristics of a Strong Imbalance:
✅ Extended Range Candles (ERC): Strong, wide-bodied candles indicate institutional buying/selling.
✅ Strong Imbalance: A clear shift in market structure after a strong rally or drop.
✅ Fresh Zone: The imbalance has not been tested yet or has only been tested once.

XAU/USD - H1 Time Frame Trade Plan 23-04-2024⚙️ Gold (XAU/USD) – H1 Time Frame Trade Plan
🧭 Current Market Bias (H1)
Check if price is above or below 50 EMA and 200 EMA
Above both = bullish bias
Below both = bearish bias
Between = range / indecision
✅ Bullish Trade Setup (Buy the Dip)
Entry Zone: $2,340 – $2,350 (recent demand zone)
Entry Signal: Bullish engulfing / hammer / RSI bounce from 40
Stop Loss: $2,325 (below recent swing low)
Take Profit 1: $2,370
Take Profit 2: $2,390
Risk:Reward: At least 1:2
❌ Bearish Trade Setup (Sell the Rally)
Entry Zone: $2,390 – $2,400 (strong resistance)
Entry Signal: Bearish engulfing / shooting star / RSI rejection from 70
Stop Loss: $2,415 (above previous swing high)
Take Profit 1: $2,360
Take Profit 2: $2,340
📌 Extra Tips
Use MACD crossovers or RSI divergence for confirmation.
Avoid entering during high-impact news (e.g., FOMC, CPI, NFP).
Consider partial closes and trailing stops if price action moves in your favor.

EURNZD - at major Resistance: Will it drop to 1.9000?OANDA:EURNZD reached a major resistance level that has previously acted as a strong barrier, triggering some strong bearish momentum. This zone can be a potential point of interest for those looking for short opportunities. Given its historical significance, how price reacts here could set the tone for the next move.
If bearish signals emerge, such as rejection wicks, bearish candlestick patterns, or signs of weakening bullish pressure, I anticipate a move toward the 1.9000 level . However, a clear breakout above this resistance could challenge the bearish outlook and mean further upside. It's a pivotal area where price action will likely provide clearer clues on the next direction.
Just my take on support and resistance zones, not financial advice. Always confirm your setups and trade with a proper risk management.

euraud sell signal. Don't forget about stop-loss.
Write in the comments all your questions and instruments analysis of which you want to see.
Friends, push the like button, write a comment, and share with your mates - that would be the best THANK YOU.
P.S. I personally will open entry if the price will show it according to my strategy.
Always make your analysis before a trade
