GBPUSD Week 30 Swing ZonesPatience is psychology.
Zones are set, but price action determines trades.
Forexsetup

GBPUSD - Sell trade July 24 2024I'm Back!
- busy with some learning materials as I level up on analysis and data.
attached here is the GBPUSD
july 24 2024 trade.
I noticed supply introduced in daily TF up to 4H TF ( markets are fractal) . It makes me conclude that it will be a bearish momentum (correction) because of wyckoff accumulation last week. As I continue to monitor the charts during London session, I noticed liquidity sweep in highs of the structure, so I create an alert in my algorithm to alarm when it noticed a tiny supply introduced in 15 min TF. Setting a pending order aiming to have 5:1 RR. During N.Y session, it moves according to plan, coming to fruition this morning (PH time) .
(check charts for a detailed analysis) # wyckoffdistribution #algorithm #supplyanddemand

AUDUSD 15M ProjectionHello Billionaires!!
It looks like a good time to buy AUDUSD because the trend is going up. Just remember to keep an eye on the market in case things change.
Also, make sure to protect yourself by setting stop-loss orders below the support zone to avoid big losses if the market suddenly goes down. Its a Fibo Golden Technique FX:AUDUSD

EURUSDEuro moved according to the morning analysis and now the position can be risk-free.
In 15 minutes, we can enter the position when the price reaches our new entry point.
The stop of both transactions is 1.06926.
Capital management should be observed

USDJPYUSDJPY analysis
Daily and weekly time frame
The trend of this currency is still upward in the weekly time frame, but it has decreased in the daily time frame. If the ceiling of the daily supply area is touched, the daily trend of this currency will be upward and we can still have higher goals for this currency pair. Support and resistance areas are marked on the chart.


GBPUSD D1 FORCAST (Bullish)
On Friday , The GBPUSD experienced Significant volatility leading to a notable Uptrend moment. This Action in the formation of a low Resistance liquidity Zone, indicatating minimal resistance for the price moment through This level. Additionally the price left relatively equal low, suggesting the pressure of H4 sell Stop.

USD/CAD Buys Active. 1.36000 Swing Trade Bullish Continuation I am currently in a Buy position on USD/CAD looking for a bullish continuation.
1.36000 is a very strong area of resistance now turning support.
If you go to the monthly timeframe you can see that we are in a bullish market.

XAUUSD BUY XAUUAD - Long view
Trade Reason :
1)4hr uptrend and Correction Completed 0.618 Level
2)Trend Reversal in 30 Min
3)Head and Shoulder Pattern Neckline breakout Confirm
Entry - 2346
Target - 2359.775
Stoploss - 2336
Thank You ...

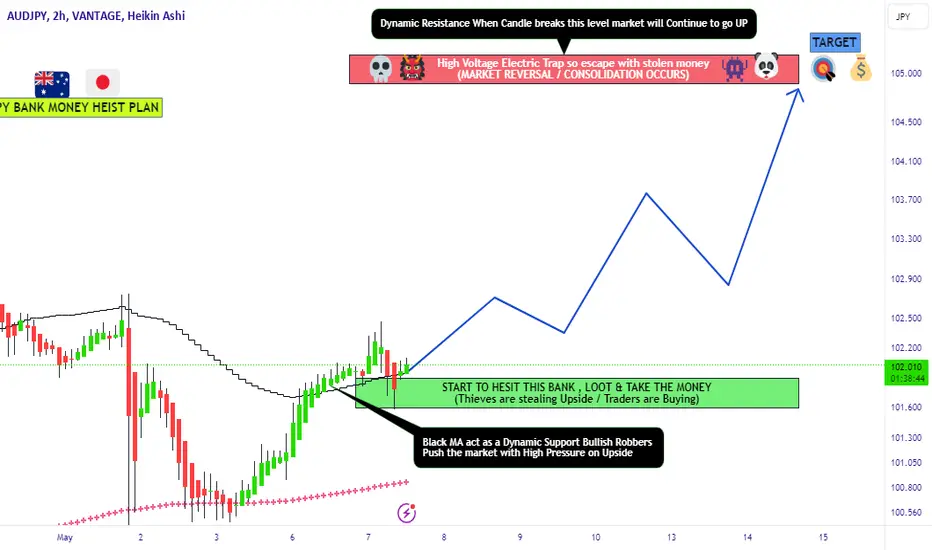
AUDJPY Bullish Robbery plan to make moneyMy Dear Robbers / Traders,
This is our master plan to Heist Bullish side of AUD/JPY Bank based on Thief Trading style Technical Analysis.. kindly please follow the plan I have mentioned with target in the chart focus on Long entry, Our target is Red Zone that is High risk Dangerous area market is overbought / Consolidation / Trend Reversal at the level Bearish Robbers / Traders gain the strength. Be safe and be careful and Be rich.
Loot and escape on the target 🎯 Swing Traders Plz Book the partial sum of money and wait for next breakout of dynamic resistance level, Once it is cleared we can continue our heist plan to next target.
support our robbery plan we can make money & take money 💰💵 Join your hands with US. Loot Everything in this market everyday.
EURCHF Bullish Money Heist Plan on Long sideMy Dear Robbers / Traders,
This is our master plan to Heist Bullish side of EURCHF Bank based on Thief Trading style Technical Analysis.. kindly please follow the plan i have mentioned with target in the chart focus on Long entry, Our target is Red Zone that is High risk Dangerous area market is overbought / Consolidation / Trend change / Strong Pullback happens at the level Bear Robbers / Traders gain the strength. Be safe and be careful and Be rich.
Loot and escape on the target🎯.
support our robbery plan we can make money & take money 💰💵 Join your hands with US. Loot Everything in this market everyday.

AUD/CAD Sell Setup Active - Trendline Break / MA Crossover 1HRI am in a beautiful sell position on AUD/CAD.
As we can see from the chart a quite significant trendline has been broken in conjunction with the MA 50 / 20 crossing over nicely on the 1HR timeframe.
Also if you go to the daily timeframe the previous candle low has been traded through confirming potential downside.
I will be targeting the asia low that I have mapped out which would be a 2% Risk to Reward trade.

USDJPY | MT Short H4 | Riding on BOJ InterventionPair: FX:USDJPY
Timeframe: H4 - Medium Term (MT)
Direction: Short
Technical Confluences for Trade:
- Stochastics are in Overbought Conditions on D1, H4 and H1 time-frames
- Price action may face some resistance from a previous support line
- Price is close to 61.8% Fib Extension Level
- Aiming for the 32.8% Fibo Retracement with 23.6% as the TP 1 level
Fundamental Confluences for Trade:
- Dividend repatriation season for Japan where MNCs bring back USD dividends and converts them to JPY
- These levels may see BOJ intervening to stop the Yen weakness
- Yield differential between USA and Japan cannot be denied and dovish BOJ doesn't help much; hence the weak JPY unless we see a firmer BOJ
- Further war escalation from the Israel-Iran tension may bring on risk-off moves and see the JPY strengthen
Suggested Trade:
Entry @ Area of Interest 154.00 - 155.15
SL @ 156.56
TP 1 @ 151.30 (Close Half-Position & move SL to Entry level once TP1 is achieved)
TP 2 @ 149.27
Risk-to-Reward @ Approx. 3.03 (Depending on Entry Level)
May the pips move in our favor! Good luck! :D
*This trade suggestion is provided on an advisory basis. Any trade decisions made based on this suggestion is a personal decision and am not responsible for any losses derived from it.

AUDJPY: Thoughts and Analysis Today's focus: AUDJPY
Pattern – Continuation
Support – 98.90 & 98.35
Resistance – 100.20 & 100.60
Hi, traders; thanks for tuning in for today's update. Today, we are looking at the AUDJPY on the daily.
We could have a new continuation forming as buyers have beaten yesterday's high backing in a second positive session. Australian employment data came in mixed with a decrease in unemployment. This, with a weaker Yen, looks to be supporting buyers at this stage today.
If we see a move below today's low or back below 98.90, this could be a warning, as it will cancel out continuation ideas in the short term.
What do you think? Do you think this is a continuation pattern?
Good trading.

Btcusd looking at this very first fall BTCUSD On the other hand if the bulls are able to flip the previous high into support like they did with the support previously as highlighted in purple, then that would be a promising move Investors should watch for a decisive flip of the blockade into support A bounce atop this base would inspire more buy orders sending BTC price to the local top at least one

Xauusd buy opportunity bullish scenario of gold second wave Gold is high The he precious metal is staying poised in trading today despite the dollar also sitting higher on the session’s Afterhitting record highs last week gold buyers have

EUR-USD | 15M | TECHNICAL ANALYSIS Hello traders,I have determined the formation target on the chart. I wish everyone success.
Like and comment if you find value in our analysis.
Feel free to post your ideas and questions at the comments section.
Good luck

Btcusd buy opportunity all time high long term BTCUSD buy strong high Consolidating abovementioned forms ascending triangle Focus on Bitcoin halving and institutional demand Bullish target at bearish at and will be flying soon

Xauusd buy opportunity strong bullish long term flying Xauusd buy opportunities no more sell gold target is 2280 the movement of bullish area

GBPUSD SELL TRADE ( MARCH 28 2024) -Pending order mt4DAILY TF was forming distribution (although not yet complete) , but I can see the orderflow because of the market structure. I go to 4h --3h--2h--1h TF and noticed some short intra day trade that became swing trade as it moves)
You can see in the chart that there was a supply (DBD formation) -march 22 friday. --> It was then validated by the market structure march 26 2024 (HH then CHOCH). I set pending order march 28 in my mt4 (morning), aiming for 1:8 RR.
The trade was activated last thursday -evening and ran until weekend (of course there was a charge in my broker running trade on weekends hehe. )
TP HIT DURING N.Y and London overlap. Bearish movement.
(A simple wyckoff distribution)

⚠️EURUSD Analysis(Falling Soon)⚠️🏃 EURUSD is moving near 🔴 Heavy Resistance zone($1.1185-$1.0980) 🔴and Resistance lines and 🟡 Potential Reversal Zone(PRZ) 🟡.
🌊According to the theory of Elliott waves , EURUSD seems to have succeeded in completing the corrective Zigzag(ABC/5-3-5) inside the Ascending Channel .
🔔I expect EURUSD to move towards the 🟢 Support zone($1.0920-$1.0870) 🟢after breaking the 🟢 Support zone($1.0810-$1.0757) 🟢.
Euro/U.S.Dollar Analyze ( EURUSD), 4-hour Time frame ⏰.
Do not forget to put Stop loss for your positions (For every position you want to open).
Please follow your strategy; this is just my idea, and I will gladly see your ideas in this post.
Please do not forget the ✅' like '✅ button 🙏😊 & Share it with your friends; thanks, and Trade safe.

USDJPY → Day Analysis | BUY SetupHello Traders, here is the full analysis.
Price reversal going up, levels for BUY . USDJPY long
! Great BUY opportunity USDJPY
I still did my best and this is the most likely count for me at the moment.
Support the idea with like and follow my profile TO SEE MORE.
Traders, if you liked this idea or if you have your own opinion about it, write in the comments. I will be glad 🤝
Patience is the If You Have Any Question, Feel Free To Ask 🤗
Just follow chart with idea and analysis and when you are ready come in THE GROVE | VIP GROUP, earn more and safe, wait for the signal at the right moment and make money with us💰
