AUDCHF SELL Price has broken the upwards trend and is looking for a possible downwards trend but still resting on a support, if price breaks the support then we should see a sell to 0.57087
Forexsetup

USDJPY is Ready to GO UP by Symmetrical Triangle Pattern🚀🏃♂️ USDJPY is moving near the 🟡 Potential Reversal Zone(PRZ)(147.520 JPY-147.318 JPY) 🟡.
✅It also seems that USDJPY has succeeded in forming a Symmetrical Triangle Pattern .
📚 What is a Symmetrical Triangle❗️❓
🔸 The symmetrical triangle, which can also be referred to as a coil, usually forms during a trend as a continuation pattern. The pattern contains at least two lower highs and two higher lows. When these points are connected, the lines converge as they are extended and the symmetrical triangle takes shape.
🔔I expect USDJPY to rise to at least the 🔴 Resistance zone(148.930 JPY-148.520 JPY) 🔴 after breaking the upper line of the triangle .
U.S.Dollar/Japanese Yen Analyze ( USDJPY ), 1-hour time frame⏰.
Do not forget to put Stop loss for your positions (For every position you want to open).
Please follow your strategy; this is just my idea, and I will gladly see your ideas in this post.
Please do not forget the ✅' like '✅ button 🙏😊 & Share it with your friends; thanks, and Trade safe.

EURJPY Bullish Plan to heistGuys Am currently looting some money in this Yuppy Market. Let's do with us. Make money and take money 💰.

GBPUSD Sell trade March 14 2024Simple correction of GBPUSD 4h TF.
-I noticed this trade starting from change of character and then BOS.
Upon leaving that area, it create a market structure and small supply (can be seen in 15min/30min)
After this I set a pending order. ( validity was the BOS structure - 15min)
It then activated today march 14 2024. (wyckoff distro originates this move).
I plan to hold until it reaches my desired target.
RR: 1:9
WYCKOFF DISTRIBUTION.

USDJPY BEARISH wedge clearly visible
I will be selling to target demand (4h). Long term idea remains bearish !!

USD CAD -SELL trade Activated March 6 2024Good day guys!
another great trade ( pending sell limit activated last Wednesday) march 6
I started checking this pair because of USD CAD daily TF
It is in area of distribution ( supply) ---> I manage to go down from 4H to 1H so I can see fluctuations and introducing new areas of supply in smaller timeframe. It took me 3 hrs to wait for proof and validity 1.35465 move lower (can be seen in 1H -15min TF)
after this I set pending sell limit in my mt4. Aiming for 1:7 RR :)
This was a perfect example of powerful supply (check daily to 4H TF)
#wyckoffdistribution

XAGUSD BUY XAGUSD - Long View
Trade Reason :
1 .Market Stay in Day Support Level
2 .4 hr Channel Breakout
3. Trend Reversel Confirm .
Entry - 22.72852
Target - 23.41600
Stoploss - 22.27500
Thank you ..

Forex preview: NFP, Powell’s testimony, and BoC and ECB decisionThe key events for the week are concentrated mainly between Wednesday and Friday.
In the United States, the focus will be on January jobs data and speeches by Federal Reserve officials. The most important of the bunch is of course Federal Reserve Chair Powell two-day testimony in Congress on monetary policy starting Wednesday. Traders will look for cues regarding the future trajectory of monetary policy, with special attention paid to the Q&A session following Powell's opening remarks.
Friday will bring the release of Non-Farm Payroll (NFP) data, with expectations of a 188,000 job increase in February. This would be a significant drop from the 353,000 jobs added in January. JOLTs job openings are anticipated to fall to 8.9 million in January after two consecutive months of increases (Wednesday).
In Canada, the Bank of Canada is anticipated to maintain interest rates unchanged for the fifth consecutive time on Thursday.
In Europe, the European Central Bank (ECB) is expected to keep rates unchanged on Thursday. ECB members continue to advocate for a patient stance, with the consensus being to wait for Q1 2024 wage data before considering a rate cut in June, aligning with current market expectations.
In the United Kingdom, all eyes will be on Finance Minister Jeremy Hunt's pre-election budget on Wednesday, which is expected to include tax cuts, which according to the guardian “... runs the risk of getting an adverse reaction from the markets which would snuff out what is still a lukewarm and tentative economic recovery.”

USDCHF LONG USDCHF LONG
Trade Reason :
1.Day support zone
2.4 Hour Trendline breakout and Trend reversed .
3. wait for proper Retracement Level .
Then Execute your Trade .
Thank you ..

EURZARThis trade is a success. The EURZAR has rallied over 300 pips since the bounce from the uptrend low. T he pair has hit both take profits @20.60000 and @20.750000. Earlier analysis highlighted the key 21.00000 level as our long term target.

EUR/USDDue to the break of the medium-term trend, and the regular upward movement in a regular trend, there is a possibility of price increase in the same trend.
(This is just a personal opinion)

EURJPY BUY EURJPY Buy - 4 hour time frame Wedge Pattern Formation Breakout completed and Trend Reversal also .
Entry - 160.200
Target - 161.350
Thank you ..

AUDUSD SELL Audusd - 4 hr timeframe near Resistance area . 30 min double top formation . Wait for neckline breakout .
Entry - 0.65000
Target - 0.65850
Stoploss - 0.65200

Title: GBP/USD Short Opportunity on Retest of 1.26695 ResistanceTitle: GBP/USD Short Opportunity on Retest of 1.26695 Resistance
Overview:
The GBP/USD pair is currently exhibiting bearish tendencies, with the price encountering a key resistance level at 1.26695. This presents an intriguing short opportunity, aligning with the overall bearish sentiment.
Technical Analysis:
Major Resistance at 1.26695: The price has previously faced rejection at this level, establishing it as a significant resistance point.
Bearish Divergence on MACD: The MACD indicator is showing a bearish divergence, suggesting weakening buying momentum.
Fibonacci Retracement: The current price level coincides with the 61.8% Fibonacci retracement from the recent swing high, adding confluence to the resistance.
Trade Setup:
Entry: Short entry around the 1.26695 level or on a confirmed rejection from this resistance.
Stop-Loss: Place a stop-loss above the recent swing high or a suitable level that aligns with your risk tolerance.
Take Profit: Target areas of potential support, such as previous swing lows or key Fibonacci retracement levels.

USD-JPY: LONG CALL: ONE HOUR TIME FRAMEUSD is clearly moving in a bullish direction against the JPY. Thus this trade can be a good opportunity for a LONG trade at One hour interval. NOTE: If you are planning to take this trade then do not forget to put your SL. Once the TP1 hits, bring your SL to Breakeven.
Best of Luck.

Silver ready buy read the caption As per the preliminary consensus, the US economy grew at a slower pace of 2.1% after expanding 4.8% in the third quarter of 2023. A slower growth rate would undermine the argument supporting a restrictive interest rate policy atleast until second quarter ends.silver ready to jump
The hopes for an interest rate-cut by the Federal Reserve (Fed) has already eased significantly as the US economy is resilient on the grounds of labor market and consumer spending. • As per the CME Fedwatch tool, chances in favour of an interest rate cut by 25 basis-points (bps) have dropped to 42.3%.

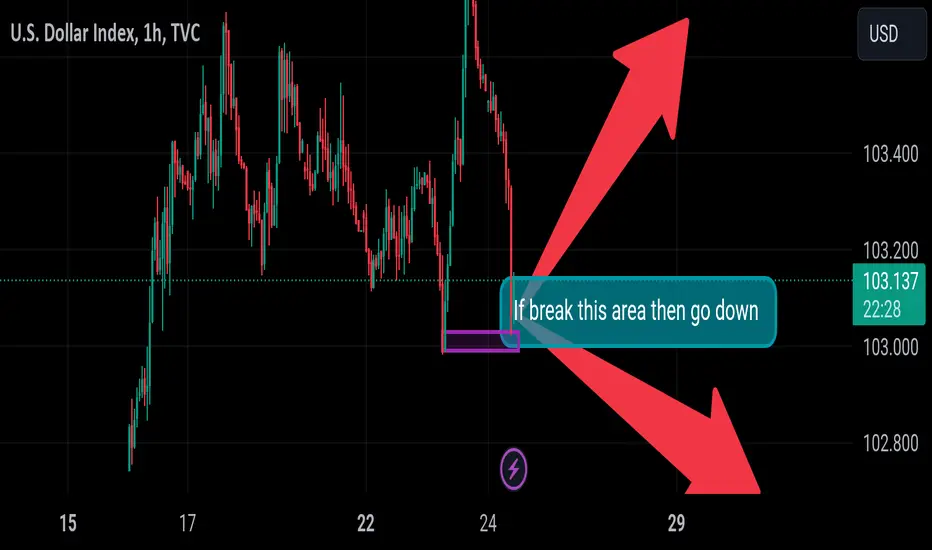
Dxy waiting for confirmation read the caption Dollar Update: sideways if break this area then go down otherwise go up wait for confirmation
Now This Is Decision Area ANd YOu Can See Down Below Both Price Action
If Dollar Make 2 Consolidation With Slow price action ups than down it could be good for bullish Other See Type Of Correction If Get decent Correction it will drop again
key Point: If Rise With Volume It
WIll Also Good For rise
GBP USD buy trade activatedAs you can see in my chart - this is a simple trade using wyckoff schematics.
1H is my main TF of analysis (intra day trade)
after that I go to 45-30-15 min and look for shift in market structure. I found out accumulation in this 15minTF and then I wait for IC creation + validity/ proof.
I set my pending order with an RR of 1:8 Using distribution schematics in higher TF.
Please check the chart for more information :)
Pending order activated and it took half day to reach the target.

USDJPY (H4) Sell now at 145.240OANDA:USDJPY USDJPY (H4) There were reaction signals after RSI divergence appears
Sell now at 145.240
Stop loss at 145.601
Take Profit 1 at 144.485
Take Profit 1 at 143.643

USDJPY can go UP from 🟢Support zone🟢➡️RR=2.45🏃♂️ USDJPY is moving near the 🟢 Support zone(143.40 JPY-142.82 JPY) 🟢.
🌊According to Elliott's wave theory , USDJPY has successfully completed wave A in the 🔴 Resistance zone(146.26 JPY-144.94 JPY) 🔴.
🌊The structure of corrective waves is Zigzag(ABC/5-3-5) .
🔔I expect wave B to end at the 🟢 Support zone(143.40 JPY-142.82 JPY) 🟢, and USDJPY will trend higher again and at least GO UP to the 🔴 Resistance zone(146.26 JPY-144.94 JPY) 🔴again.
👑 Position :
USDJPY
Position : Long
Entry Point : 143.429 JPY (Limit Order)
Stop Loss : 142.440 JPY
Take Profits : 4145.852 JPY// 144.414 JPY(RR=1.00)
Risk-To-Reward : 2.45
Please don't forget to follow capital management ⚠️
Please pay attention to the style of opening the position.⚠️
U.S.Dollar/Japanese Yen Analyze ( USDJPY ), 4-hour time frame⏰.
Do not forget to put Stop loss for your positions (For every position you want to open).
Please follow your strategy; this is just my idea, and I will gladly see your ideas in this post.
Please do not forget the ✅' like '✅ button 🙏😊 & Share it with your friends; thanks, and Trade safe.

USD CAD December 12 2023 pending order activatedAs you can see, USDCAD react from above supply and then manipulating highs in 1h- 30min-15min TF. (1.38770 supply) .
If you check the 1H TF , you will see a footprint of smartmoney making LH (this is the part where Im taking my pending sell order) mt5 platform. check chart for a detailed move aiming for another lower low in 4h and daily TF.
Today my trade was activated and i ride this sell position. aiming for 1:5RR
Distribution schematics ( Wyckoff)

December 1 2023 - GBPUSD Buy Trade ActivatedHi guys!
I have here a simple trade this week, checking the daily TF of pound dollar, i noticed a supply above (nov. 29 2023) -Nov. 30 move.
After checking the bullish move on daily---> 4h---> 3h-->2h--> 1h. I checked for possible demand zone and set a pending order in my mt5 raw account.
Nov 30 2023--> it reacted to my POI (point of interest) . so i wait until my pending order was activated . Indeed it really touched the price im aiming for and then i look for validity and proof of the zone. wyckoff accumulation on 5 min and 15 min tf. (please check chart for reference.
RR: 1:8
1% of capital aiming for 8 % on this trade.
Another great trade and wisdom from GOD. :)
Patience is always the key.

EURUSD TRADE IDEA 30/11/2023In this video, I the possibility for a continuation upwards on eurusd. I also talked about the things I will like to see the market do before I will be looking for entry positions for a long trade. I also talked about the possibility for the price to continue downwards since it's coming off a weekly 61.8 fib level. I talked about what I will expect the market to do before I conclude that the direction of the price has change from an uptrend to a downtrend. I'm sure you will enjoy this video so please give me a boost and also follow me.
