GOLDThis chart represents Gold (XAU/USD) on a 1-hour timeframe. Several key price levels and technical patterns are identified, including resistance zones, FVG (Fair Value Gaps), and target levels. Let's break down the analysis:
Key Observations:
1. Price Action & Trend:
- The price of Gold has been moving downward, as seen from the red trendlines marking a downtrend. The price has faced resistance around the 3,141.644 level, which has acted as a strong supply zone. Following this, Gold showed a sharp decline towards lower levels.
2. Resistance Zone:
- The resistance zone is marked at 3,141.644, which corresponds to a region where the price has previously encountered selling pressure. This level seems to have rejected the price multiple times, confirming it…- The FVG gap is highlighted around the range 3,120.00 - 3,141.644. An FVG represents an area where the price imbalance occurs, typically after a sharp price movement. In many cases, the market returns to fill the gap before continuing in the direction of the initial move. The FVG zone in this chart likely indicates a potential for a price retracement or consolidation before further price action.
- As the price moves downward, the FVG zone is tested, and it might act as a rejection zone if the price moves back into it, suggesting a short trade opportunity.
4. Downward Price Movement:
- The sharp bearish movement observed from the resistance level at 3,141.644 shows a breakdown, confirming a trend reversal. This move pushes the price below the previous su…
Forexsignal

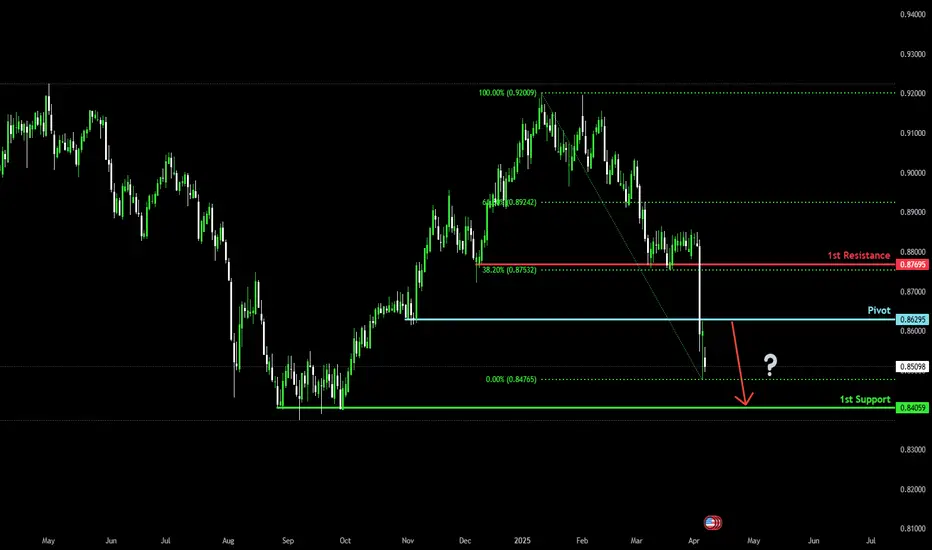
Bearish drop?The Swissie (USD/CHF) has reacted off the pivot which is a pullback resistance and could drop to the 1st support which has been identified as a pullback support.
Pivot: 0.8629
1st Support: 0.8405
1ast Resistance: 0.8769
Risk Warning:
Trading Forex and CFDs carries a high level of risk to your capital and you should only trade with money you can afford to lose. Trading Forex and CFDs may not be suitable for all investors, so please ensure that you fully understand the risks involved and seek independent advice if necessary.
Disclaimer:
The above opinions given constitute general market commentary, and do not constitute the opinion or advice of IC Markets or any form of personal or investment advice.
Any opinions, news, research, analyses, prices, other information, or links to third-party sites contained on this website are provided on an "as-is" basis, are intended only to be informative, is not an advice nor a recommendation, nor research, or a record of our trading prices, or an offer of, or solicitation for a transaction in any financial instrument and thus should not be treated as such. The information provided does not involve any specific investment objectives, financial situation and needs of any specific person who may receive it. Please be aware, that past performance is not a reliable indicator of future performance and/or results. Past Performance or Forward-looking scenarios based upon the reasonable beliefs of the third-party provider are not a guarantee of future performance. Actual results may differ materially from those anticipated in forward-looking or past performance statements. IC Markets makes no representation or warranty and assumes no liability as to the accuracy or completeness of the information provided, nor any loss arising from any investment based on a recommendation, forecast or any information supplied by any third-party.
Downside Risk Grows for NZD/USD After Structure FailThe NZD/USD pair has broken down from a well-defined rising wedge pattern, signaling a shift in short-to-medium term momentum. After trending within this rising structure for several weeks, price has now decisively violated the lower trendline, confirming a bearish breakout. The move coincides with a sharp rejection near the 200 EMA, which continues to act as dynamic resistance overhead.
Price is now hovering around a key support zone between 0.555 and 0.558 — a level that has historically served as a pivot point. The breakdown is also supported by a clear bearish RSI divergence, where price made higher highs while RSI formed lower highs, indicating weakening momentum. Currently, the RSI sits at around 32.47, approaching oversold territory but not yet showing signs of bullish reversal.
If the current support zone fails to hold, we could see further downside pressure, potentially driving the pair toward the next major support region near 0.548–0.540. On the other hand, if buyers step in and absorb the sell-off at these levels, a relief bounce toward the broken trendline or the 200 EMA could be expected — though such a move may face strong resistance.

GBPJPYHello Traders! 👋
What are your thoughts on GBPJPY?
On the daily chart of GBPJPY, a Rising Wedge pattern has formed. After a bullish move, the price has entered a resistance zone.
If the wedge breaks down and price confirms below the 192.000 level, a short position could offer a favorable risk-to-reward setup.
Don’t forget to like and share your thoughts in the comments! ❤️

GBPCAD - Is Bullish Breakout Ahead?TF: 4h
GBPCAD is initiating along opportunity by completing 4th intermediate wave at 1.83464 . We can expect a retracement then reversal with near the lower trendline of the parallel channel.
Once price comes down, we will have the opportunity to go long with minimum stop level at low of the wave 4 at 1.83640 . The bullish scenario is capable GBPCAD to provide 1.8654 - 1.8748 targets to the buyers.
If the breakdown occurs, wave (4) will go deep. We update this chart time to time. Traders should only buy after a clear reversal.

euraud sell signal. Don't forget about stop-loss.
Write in the comments all your questions and instruments analysis of which you want to see.
Friends, push the like button, write a comment, and share with your mates - that would be the best THANK YOU.
P.S. I personally will open entry if the price will show it according to my strategy.
Always make your analysis before a trade

GBPAUD | SCALPING TIME | BUY NOW HEY THERE;
SIGNAL ALERT
BUY GBPAUD - 2,05048 / 2,04900
🟢TP1: 2,05221
🟢TP2: 2,05689
🟢TP3: 2,06374
🔴SL: 2,04570
RISK REWARD - 3,00
Please don't forget to like 🙏🏻

Strong GDP, Weak USD – How Will EURUSD React!?Today's U.S. data showed strong GDP growth (2.4%) , but lower inflation ( 2.3% Final GDP Price Index ) and a weaker trade balance ( -147.9B ) suggest the Fed may remain cautious on rate hikes. This limits USD's strength , supporting a potential EURUSD rebound .
EURUSD ( FX:EURUSD ) is moving in the Support zone($1.08180-$1.0745) and has also managed to break the Downtrend line . 50_SMA(Weekly) plays a good role of support for EURUSD .
In terms of Classic Technical Analysis and Price Action , there is also a possibility that EURUSD will return to an uptrend with Inverse Head and Shoulders and Bullish Quasimodo Patterns .
Regarding Elliott Wave theory , it seems that EURUSD has managed to complete the main wave 4 . The main wave 4 structure is an Expanding Flat Correction(ABC/3-3-5) .
I expect EURUSD to trend higher in the coming hour s and rise to at least $1.0855 , and if the Resistance zone($1.0867-$1.0850) is broken, we should expect more pumping .
Note: If EURUSD breaks below the 50_SMA(Weekly), we expect further declines. The worst Stop Loss(SL) could be $1.072.
Please respect each other's ideas and express them politely if you agree or disagree .
Euro/U.S. Dollar Analyze (EURUSD), 2-hour time frame.
Be sure to follow the updated ideas.
Do not forget to put a Stop loss for your positions (For every position you want to open).
Please follow your strategy and updates; this is just my Idea, and I will gladly see your ideas in this post.
Please do not forget the ✅' like '✅ button 🙏😊 & Share it with your friends; thanks, and Trade safe.

EUR/USD analysis – two Key Scenarioshello guys.
The EUR/USD pair has witnessed a strong bullish surge, breaking through key resistance levels. However, two possible scenarios emerge from this critical point:
🔴 First Scenario (Bullish Continuation):
Price could retrace to the 1.07-1.072 demand zone before resuming its upward trajectory.
If support holds, the pair may climb towards the 1.10-1.105 resistance zone, aligning with the upper boundary of the ascending channel.
🔵 Second Scenario (Bearish Reversal):
If bullish momentum fades, a deeper correction may follow, breaking below the key support zone.
This could lead the price toward the 1.04-1.043 area, marking a retest of previous lows and reinforcing bearish sentiment.
-------------------
Conclusion:
The current level serves as a critical decision point. If price sustains above support ($1.072-$1.068), bullish momentum may continue. However, a break below could signal a bearish correction, shifting market sentiment. Traders should watch key levels for confirmation of either scenario.

GBPUSD in Correction Phase – Potential for a Short OpportunityGBPUSD ( FX:GBPUSD ) is approaching the Support zone($1.286-$1.278) , Support lines and Important Support line .
Regarding Elliott Wave theory , GBPUSD appears to have completed the microwave 5 of the main wave 3 with the help of the Ending Diagonal Pattern and is currently completing the main wave 4 . The main wave 4 is likely to have a Double Three Correction(WXY) .
I expect GBPUSD to decline at least to the Support zone($1.286-$1.278) and Support lines .
Note: If GBPUSD goes above $1.30 we should expect more pumping. The worst Stop Loss(SL) for a SHORT position could be $1.30.
Note: If GBPUSD falls below $1.2760, we should expect more dumping.
Please respect each other's ideas and express them politely if you agree or disagree.
British Pound/U.S. Dollar Analyze (GBPUSD), 4-hour time frame.
Be sure to follow the updated ideas.
Do not forget to put a Stop loss for your positions (For every position you want to open).
Please follow your strategy and updates; this is just my Idea, and I will gladly see your ideas in this post.
Please do not forget the ✅' like '✅ button 🙏😊 & Share it with your friends; thanks, and Trade safe.

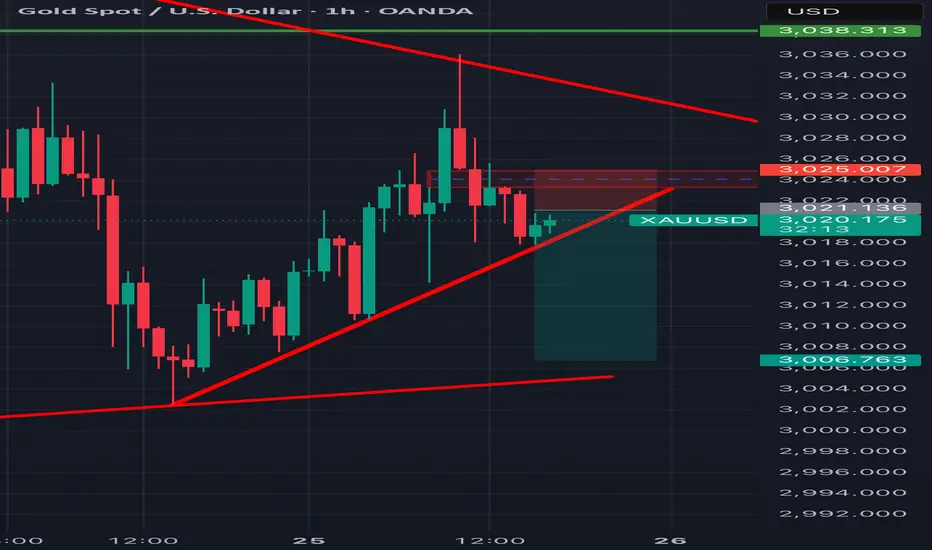
Perfect Bearish Setup Trendline Breakout Alert!Hello Trader! 👋
Scenario 1: 📉
Picture this: You're analyzing a solid bearish trend on the M3 or H1 chart, and you've just spotted a trendline break with serious potential for a sell opportunity. 🔥 The momentum is strong, and everything aligns perfectly. 🚀 The market is pushing lower, and it looks like it’s ready to move further down.
The entry signal is solid, confirming a valid opportunity to take a short position! 📉
Now, the exciting part—the target zone! 🎯 We’re eyeing a liquidity area around 3000, which is a key level where price could see some action. 🔄 But wait, there's more! Your secondary target level is around 2990, which could offer even more potential for profit as the market drives lower. 💰
Of course, always follow your risk management**—control your position size, set your stops wisely, and let the market do the work! 🛑⚖️ Trading is all about discipline , and with the right mindset, you'll maximize those winning moves. 🏆
Stay focused, keep an eye on the price action, and be ready to react! 💪 Let’s trade smart and make those profits! 😎💥

Xauusd sell opportunity GTEXauusd sell opportunity GTE VIP. Technicals looking like it will drop to bottom support zone
Us30 sell market technicals Us30 sell market technicals. Looking like a nice drop from trend lines. Signal was sent to GTE vip.

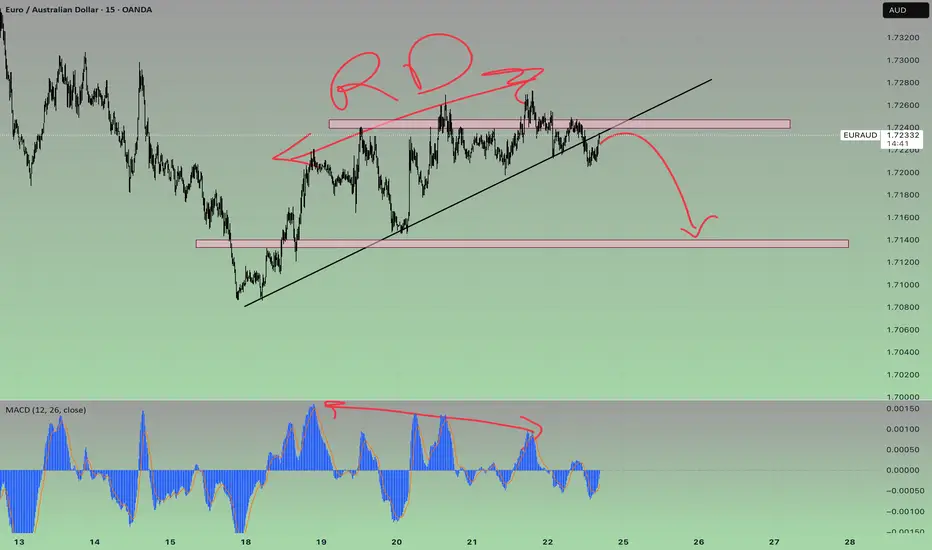
EURAUD SELLThe overall trend of this pair is bullish 📈, but in the lower timeframe, a sell opportunity can be considered 📉. Let’s take advantage of this setup! ⚡️
#EURAUD
xAUUSD Structure, Sentiment & Strategic Patience📊 XAUUSD WEEKLY INSIGHT | Structure, Sentiment & Strategic Patience
As we close out a volatile trading week, let’s zoom out and assess what’s really happening with gold. The recent price action on the higher timeframes is revealing important signals — and it’s time to take a strategic pause before the next move.
🔍 WEEKLY SNAPSHOT:
Gold experienced a sharp correction of over $50, followed by a late-session recovery into the weekend. The result?
✅ Long upper wicks on both the W1 and D1 candles,
✅ Signs of rejection from all-time highs,
✅ Yet price still managed to close above the 50% candle body range — momentum is cooling, but not reversing (yet).
The big question now is:
Is this a healthy pullback within the uptrend… or the beginning of something deeper?
📐 Key Takeaways:
Structure on higher timeframes remains bullish – price is still moving within the primary ascending channel
Short-term retracement has reached the 0.5–0.618 Fibonacci zone on H1 and H2 – a potential decision area
End-of-week buying indicates positioning by informed participants, not random volatility
No confirmation of a major reversal yet – but conditions are developing
📌 Key Levels to Watch:
Resistance Zones: 3025 – 3033 – 3040 – 3046 – 3056
Support Zones: 3014 – 3005 – 3000 – 2993 – 2986
🧠 Mindset Going Into Next Week:
Don’t rush it.
Let Monday’s open reveal the volume story — whether through gaps, spikes, or clean structure. The best setups form after the market shows its hand, not before.
This is where strategic patience beats emotional trading.
📣 Final Note:
Stay focused on structure. Respect your levels. Watch how price reacts — not just where it goes.
And remember: sometimes no trade is a powerful trade when the market is indecisive.
More insights coming soon on market psychology and execution discipline.
💬 Feel free to leave a comment, follow for updates, or share your own views below.
Wishing everyone a strong and clear start to the new week,
— AD | Money Market Flow

GBPUSD Selling Opportunities SpottedWe are basically anticipating for more selling momentum as price formed a wedge at a resistance level. Also, lower timeframe price action shows more bearish activities.

EURUSD Bulls Eyeing FOMC–Will Powell’s Dovish Tone Fuel a Rally?As we approach the much-anticipated FOMC rate decision and Powell’s press conference , market sentiment is shifting, and EURUSD ( FX:EURUSD ) traders are closely watching for clues on the Federal Reserve’s next move . With recent economic data pointing to signs of slowing growth and cooling inflation, the Fed might adopt a more dovish tone , fueling further upside for EURUSD .
Key Factors Driving the Bullish Outlook :
Inflation & Economic Data : CPI and PPI data indicate a gradual cooling of inflation, which strengthens the case for a potential rate cut later this year. If Powell acknowledges this shift, it could weigh on the dollar.
Market Pricing of Rate Cuts : Investors are already pricing in multiple Fed rate cuts for 2024. A dovish Powell could accelerate these expectations, weakening USD and pushing the EURUSD higher.
------------------------------------------------------------------
Now let's take a look at the EURUSD chart on the 2-hour time frame .
EURUSD is moving near the Resistance zone($1.0983-$1.0916) and Yearly Resistance(1) .
Regarding Elliott Wave theory , it seems that EURUSD has managed to complete the main wave 4 . The structure of the main wave 4 is the Double Three Correction(WXY) .
The main wave 5 is likely to complete near the upper line of the ascending channel(possible) and Monthly Resistance(4) .
I expect EURUSD to rise in the coming hours to the targets I have indicated on the chart, although the Federal Reserve Conference could create long shadows , but I think the supply and demand zones will still work but still pay more attention to money management today .
Note: If EURUSD can break below the Potential Reversal Zone(PRZ) , there is a possibility of further decline in EURUSD.
Please respect each other's ideas and express them politely if you agree or disagree.
Euro/U.S. Dollar Analyze (EURUSD), 2-hour time frame.
Be sure to follow the updated ideas.
Do not forget to put a Stop loss for your positions (For every position you want to open).
Please follow your strategy and updates; this is just my Idea, and I will gladly see your ideas in this post.
Please do not forget the ✅' like '✅ button 🙏😊 & Share it with your friends; thanks, and Trade safe.

GBPJPYHello friends
Given the good price growth, we can now buy in support areas during pullbacks that the price makes, of course with capital and risk management...
*Trade safely with us*

I HAVE A NEW STRATEGY! Watch it work for me. SAYS BUY🚨 Exclusive Trading Opportunity – Limited Time Only! 🚨
I've developed an amazing new trading strategy that’s completely unique and never seen before! It’s called the Skyline Scalping Strategy, and it’s designed to pinpoint market direction with extreme accuracy—something that can easily be back-tested by reviewing my previous predictions.
For a limited time, I’ll be posting daily trade signals based on this strategy, allowing you to see exactly where I anticipate the market will move next. Whether you're an amateur trader or a seasoned professional, this is your chance to witness something game-changing in action.
⚠️ Disclaimer: I’m not providing financial advice—just sharing the direction I am planning to make money. The Skyline Scalping Strategy works exclusively on the daily chart, so stay tuned and watch as the predictions unfold!
FOLLOW NOW and don’t miss out on these powerful insights! 📊🔥
Vertical lines are colored and placed to indicate the expected direction of the price. Just my thoughts.

breakdown of the setup! Read CaptionThis is a 4-hour chart of Gold (XAU/USD) showing a bullish channel with price currently trading near its upper boundary. Here’s a breakdown of the setup:
Market Structure:
Trend: Gold is in a strong uptrend, moving within a well-defined ascending channel.
Current Price: Around $2,998, with a recent high of $3,000.55.
Key Target: A potential bullish breakout targeting $3,020+.
Support Zones: Highlighted between $2,930 - $2,860 as possible retracement levels.
Potential Scenarios:
Bullish Continuation: If price holds above the midline of the channel, a push toward $3,020 - $3,050 could be expected.
Pullback & Retest: A minor correction toward $2,970 - $2,960 before resuming its uptrend.
Deeper Retracement: A stronger pullback could lead to a test of $2,930 or even $2,860, aligning with the lower trendline.
Trading Plan:
Buy on dips if price retests lower support zones within the channel.
Breakout trade above $3,020 could indicate further upside potential.
Risk management: Watch for bearish rejection candles near resistance.
This setup favors bullish continuation, but a short-term pullback is possible before the next leg up. 📈🔥

XAUUSD - Short Trade after Resistance Test ($3,005 - $3,010)Short after Resistance Test ($3,005 - $3,010)
📌 Entry: Sell within the $3,005 - $3,010 range if there is a clear rejection and price weakness.
🎯 Take-Profit 1: $2,985 (immediate support)
🎯 Take-Profit 2: $2,970 (recent lows)
🛑 Stop-Loss: $3,015 (above resistance)
🔹 Probability: High – Confirmed by weak volume on rallies and strong resistance.
Trade Rationale:
Key Resistance Zone ($3,005 - $3,010): This level has historically acted as a supply zone, where sellers step in to push prices lower. If price action shows rejection (e.g., wicks or bearish engulfing candles), it confirms a high-probability short setup.
Weak Volume on Rallies: Volume analysis suggests that bullish momentum lacks strong participation. A rising price with decreasing volume often signals an exhaustion of buyers, increasing the probability of a reversal.
Technical Indicators Align:
RSI (Relative Strength Index): Overbought or showing bearish divergence, signaling potential downside pressure.
MACD (Moving Average Convergence Divergence): Losing bullish momentum or forming a bearish crossover, indicating potential for a pullback.
Donchian Trend & Moving Averages : Price is testing upper Donchian bands and key moving averages are suggesting overextension.
Risk-Reward Ratio:
> The stop-loss at $3,015 ensures protection against false breakouts.
> The first take-profit ($2,985) targets the nearest support, locking in quick profits.
> The second take-profit ($2,970) aligns with recent swing lows, maximizing the downside potential.
Final RRR (TP2) is 1 : 3,4
Conclusion:
A rejection from the $3,005 - $3,010 resistance zone presents a solid short opportunity, backed by weak bullish momentum, technical confluence, and favorable risk-reward. If the price fails to break higher and shows signs of rejection, this trade setup has a strong probability of success.
⚠️ Final Warning: Trading involves significant risk, and past performance does not guarantee future results. Always use proper risk management and never trade with money you can't afford to lose. This analysis is for educational purposes only and not financial advice.
What do you think about this setup? Would you take this trade? Drop your thoughts in the comments! 👇

EURUSD Faces Resistance zone – Will Bears Take Over?The EURUSD ( FX:EURUSD ) has reached the Resistance zone($1.0983-$1.0916) as I expected in my previous post . Can the EURUSD break the Resistance zone($1.0983-$1.0916) ?
EURUSD is moving near the Resistance zone($1.0983-$1.0916) , the Resistance line , and Yearly Resistance(1) .
According to the Elliott Wave theory , EURUSD seems to have completed 5 impulse waves and we can expect Corrective Waves .
Also, we can see the Regular Divergence(RD-) between Consecutive Peaks .
I expect the EURUSD to decline to at least the Support zone($1.0817-$1.0760) in the coming hours after breaking the lower line of the ascending channel . One of the EURUSD targets could be as wide as the ascending channel .
Note: If EURUSD breaks the Resistance zone($1.0983-$1.0916), we can expect more pumps.
Please respect each other's ideas and express them politely if you agree or disagree.
Euro/U.S. Dollar Analyze (EURUSD), 1-hour time frame.
Be sure to follow the updated ideas.
Do not forget to put a Stop loss for your positions (For every position you want to open).
Please follow your strategy and updates; this is just my Idea, and I will gladly see your ideas in this post.
Please do not forget the ✅' like '✅ button 🙏😊 & Share it with your friends; thanks, and Trade safe.

GOLD ROAD MAP 3000 TO WATERFALL ALERT!🔥 Attention Traders! 🔥
XAUUSD is on fire! 🔥 Here's the latest update:
🔻 Bearish Outlook: Watch out for a potential drop if price falls below 2979. Targets: 2940 & 2960.
🔺 Bullish Outlook: A breakout above 2989 could lead to buying opportunities! Watch for targets: 3000 & 3020.
📈 Stay Tuned: Share your thoughts and strategies as we navigate this golden market! Let's hit new highs! 💰🚀
