GBPCAD LONG FORECAST Q3 W28 Y25GBPCAD LONG FORECAST Q3 W28 Y25
Professional Risk Managers👋
Welcome back to another FRGNT chart update📈
Diving into some Forex setups using predominantly higher time frame order blocks alongside confirmation breaks of structure.
Let’s see what price action is telling us today! 👀
💡Here are some trade confluences📝
✅Daily Order block identified
✅4H Order Block identified
✅1H Order Block identified
🔑 Remember, to participate in trading comes always with a degree of risk, therefore as professional risk managers it remains vital that we stick to our risk management plan as well as our trading strategies.
📈The rest, we leave to the balance of probabilities.
💡Fail to plan. Plan to fail.
🏆It has always been that simple.
❤️Good luck with your trading journey, I shall see you at the very top.
🎯Trade consistent, FRGNT X
Forexsignal

XAU/USD : Get Ready for Another Fall ! (READ THE CAPTION)By analyzing the gold chart on the 4-hour timeframe, we can see that, as expected from our previous analysis, when the price was trading around $3327, it climbed to the supply zone at $3345. After reaching this key level, strong selling pressure emerged, leading to a sharp drop in gold today down to $3296.
This move played out exactly as anticipated, and now, if the price stabilizes below $3330, we could expect further downside pressure on gold.
The Main Analysis :

GBP/USD : First Long, Then SHORT! (READ THE CAPTION)By analyzing the GBP/USD chart on the 4-hour timeframe, we can see that the price is currently trading around 1.3625. I expect a new Fair Value Gap (FVG), formed by the recent sharp drop, to be filled soon.
The first target for this potential move is 1.3650, with the next bullish zone between 1.3670 and 1.3730.
Supply and demand zones are marked on the chart — keep a close eye on how the price reacts to these key levels!
Please support me with your likes and comments to motivate me to share more analysis with you and share your opinion about the possible trend of this chart with me !
Best Regards , Arman Shaban

Market next target 🔄 Disruption Analysis:
📌 Current Scenario:
Price is trading around 3,336.400, just below the identified resistance zone (~3,340-3,343).
A range-bound structure is visible with repeated rejections at resistance and support.
---
🚨 Disruption View:
❌ Invalidating Bearish Bias:
The chart assumes a bearish move toward the 3,320 target, but there are early signs of strength near the mid-range (3,335 area).
Failed breakdowns and higher lows indicate buying pressure below 3,330.
---
🟢 Alternative Disruption Outlook (Bullish Flip):
If price breaks and holds above 3,343 resistance, we may see:
🔼 Upside breakout toward 3,355–3,360 zone.
📈 Continuation of the larger uptrend from July 1st rally.
---
🔁 Key Disruption Levels:
Support: 3,328–3,330 (interim zone to watch before full drop)
Resistance: 3,343–3,345 (bullish breakout point)
Invalidation of Bearish Bias: Closing above 3,345 on strong volume.

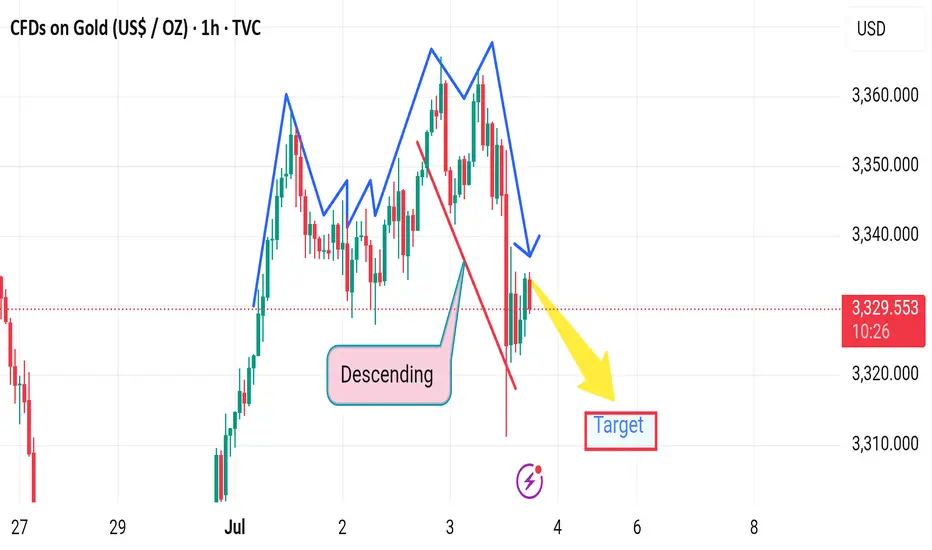
Market next target ⚠️ Disruption Analysis – Gold (1H):
🔹 Pattern Disruption Identified:
The chart previously followed a descending structure with lower highs and lower lows, confirming bearish momentum.
However, a temporary recovery (small bullish correction) appears after a sharp drop, disrupting the previous flow.
---
🔄 Disruption Points:
1. Break in Momentum (Structure Shift):
The recent bullish correction (small upward leg) challenges the consistency of the descending trend.
It signals a potential pause or trap in the current bearish move.
2. Price Rejection Area:
Price attempted to bounce but failed to break above the previous lower high, indicating bearish strength remains intact, but is facing disruption from short-term buyers.
3. Volatility Spike:
The long wick on the recent candle shows a volatility disruption, likely due to economic news or high-impact events (suggested by the ⚡ icon on the chart).
4. Target Zone Disruption:
Though the yellow arrow points toward a bearish target, the slight upward pullback adds uncertainty about whether price will reach that level immediately.
Gold Market Analysis Current Price: 3341.58
Market Behavior:
The price is ranging sideways, trading in a tight consolidation zone just below the resistance zone (around 3344).
Key Resistance Levels:
3344 → Immediate resistance
3348 – 3352 → Next minor supply zone
3357 – 3360 → Strong resistance ahead (if breakout occurs)
Key Support Levels:
3332 – 3330 → Short-term demand
3324 – 3320 → Stronger support zone
📌 Trader Insight:
"Gold is in a consolidation phase between 3330 and 3344. Wait for a confirmed breakout above 3344 for bullish momentum toward 3357+. If rejected again, expect a retest of support near 3332 or deeper."
✅ Trade Setup (Example):
Buy Scenario (Breakout):
Entry: Above 3345
Target: 3357
Stop Loss: Below 3338
Sell Scenario (Rejection):
Entry: Near 3344 resistance, if rejected
Target: 3332 / 3324
Stop Loss: Above 3348

Market next move ❗ Disrupted Market Outlook:
⚠️ False Breakout Risk:
The recent "Breakout" above previous highs may be a bull trap. Although price surged, the follow-up candles are showing lower highs, suggesting weakening bullish momentum.
📉 Bearish Divergence (not shown but likely):
Based on the price action, there's a potential bearish divergence with RSI/MACD (if overlaid), as price makes higher highs while momentum likely weakens.
🔄 Resistance Reversal Zone:
The area labeled as "Support area" at the top (near $67.50) is actually acting as resistance again — the market is failing to hold above this level.
🔁 Retest Failure:
After the breakout, price failed to establish strong support and is consolidating below the highs, hinting at a potential breakdown below $66.
---
🔻 Disruption Path:
1. Drop to $66.00 - immediate pullback from failed breakout.

Swiss Vault Job: GBP/CHF Entry Blueprint Unlocked🕵️♂️💼 GBP/CHF: The Swiss Vault Infiltration Protocol 💼🕵️♂️
(Swing/Day Plan — Executed in Silence, Paid in Profits)
🌟Hi! Hola! Ola! Bonjour! Hallo! Marhaba!🌟
Dear Money Makers & Silent Operators, 🤑💰💸✈️
Welcome to the Thief Trading Syndicate's Strategic Playbook – today’s mission targets the GBP/CHF vault. We’ve cooked up a master plan powered by our signature blend of technical finesse and stealthy macro-insight. This setup is based on institutional footprints and high-stakes zones where liquidity flows like digital gold.
📊 Current Bias:
🟥 Bearish weight remains, but we smell bullish smoke beneath — reversal setups in play.
📈 Entry Strategy:
Long (Bullish) — Scout entry above 1.06500+ in higher timeframes (4H+). Retest confirmation required.
Short (Bearish) — “The vault’s unguarded! Slip in short anywhere up top—clean sweep mode.”
🛑 Stop Loss Placement:
Place SL near recent swing highs/lows on the 5H chart (swing basis). Customize per lot size and multiple entries. Your risk defines your escape rope.
🎯 Profit Extraction Target:
Long TP: Aim for the 1.11500 vault door (or vanish before it slams).
Short TP: Dive to 1.06500, or pull the plug earlier if guards wake up.
📰 Strategic Conditions:
This pair’s behavior is currently driven by mixed macro triggers — smart money positioning (COT), sentiment clusters, and market structure traps.
→ For full details: Fundamental macros, COT leaks, sentiment drift, and institutional zones — check your sources.
🚨 News & Risk Protocols:
No new entries during red-folder events.
Use trailing stops to lock loot and run.
💥 Boost Our Bandits!
Smash that ❤️ to strengthen our robbing force. Each tap fuels future missions. No indicators. Just raw street-smart trading edge.
👀 More heists incoming. Stay low. Stay sharp. Stay profitable. 🐱👤🎯📈

EURJPY LONG IDEAI have been waiting for this EURJPY long setup to form for the past 2 trading sessions.
This morning I saw this beautiful bullish swing low formed and that is my entry signal for to take a long trade on EURJPY.
REASONS:
EURJPY is super bullish right now.
The Daily and 4Hour time frame trend is extremely bullish. So, am only looking to take a long buy to follow the trend direction.

Gold Price Analysis – Bullish Momentum Holds Above FVGs🧠 Chart Breakdown:
Instrument: Gold Spot (XAU/USD)
Timeframe: 1H
Current Price: $3,340
Trend: Short-term uptrend intact
🔑 Key Observations:
Ch.o.Ch Confirmed (Change of Character):
The break above the previous structure high confirmed a bullish market structure shift.
Fair Value Gaps (FVG):
Multiple FVGs exist between $3,320 – $3,335, acting as potential demand zones and support levels.
Fibonacci Retracement:
Price is respecting the 0.382–0.5 levels ($3,336 – $3,330) well so far.
Below this, the 0.618 level at $3,325 is the next strong confluence zone.
Trendline Support:
The price is testing a rising trendline, adding dynamic support around the current level.
Ichimoku Cloud:
Price is above the cloud, which supports the bullish bias.
Conversion line (blue) and base line (red) are bullishly aligned.
📉 Possible Next Moves:
✅ Bullish Scenario:
Price bounces from current levels or slightly lower ($3,336–$3,330) and retests the recent high (~$3,355).
Breakout above $3,355 could open the door to $3,370+.
⚠️ Bearish Scenario:
If price breaks below $3,330 and the trendline, expect deeper pullbacks to:
$3,325 (0.618 Fib)
Then possibly $3,308 FVG support or $3,258 major demand zone.
📌 Conclusion:
Gold is still respecting bullish market structure with healthy pullbacks into support zones. As long as the price stays above $3,325, the bullish outlook remains valid. Watch for bullish reaction near the FVGs or a break above $3,355 to confirm upside continuation.

Symmetrical Triangle in EURCHF —Fundamental & Technical AnalysisToday, I want to examine the EURCHF ( FX:EURCHF ) Short position opportunity from both a Fundamental and Technical perspective.
First, let’s examine the EURCHF pair from a fundamental perspective:
The ECB’s dovish policy stance and weakening Eurozone data contrast sharply with the Swiss Franc’s safe-haven appeal and economic stability. With geopolitical tensions in the background, EURCHF may continue to slide lower, supporting short positions.
In terms of technical analysis , EURCHF is moving near a Heavy Resistance zone(0.967 CHF-0.940 CHF) .
In terms of Classical Technical Analysis , EURCHF is moving inside a Symmetrical Triangle Pattern . The point to note about this example is that every time EURCHF approaches the upper lines of the symmetrical triangle , it starts to decline with a lot of momentum . And considering the previous movement of EURCHF, which was bearish, it is better to look for short positions from inside the symmetrical triangle.
Based on the above explanation , I expect EURCHF to move back towards the lower lines of the symmetrical triangle pattern .
Note: Stop Loss(SL): 0.94120 CHF
Please respect each other's ideas and express them politely if you agree or disagree.
Euro/Swiss Franc Analyze (EURCHF), 4-hour time frame.
Be sure to follow the updated ideas.
Do not forget to put a Stop loss for your positions (For every position you want to open).
Please follow your strategy and updates; this is just my Idea, and I will gladly see your ideas in this post.
Please do not forget the ✅' like '✅ button 🙏😊 & Share it with your friends; thanks, and Trade safe.

AUDCHF: Bullish Flag from PRZ — Rally to 0.54444?AUDCHF ( OANDA:AUDCHF ) bounced from the Potential Reversal Zone (PRZ) , which aligns with the Yearly Support(1) and the 50% Fibonacci level of the previous bullish impulse.
From a Classic Technical Analysis perspective , AUDCHF appears to be breaking out of a Bullish Flag Pattern , which may suggest the continuation of the previous uptrend .
This bullish reaction also confirms the importance of the Support zone(0.51166 CHF-0.49773 CHF) , where buyers stepped in aggressively.
In terms of Elliott Wave theory , it seems that AUDCHF has completed the bearish waves and we should wait for the bullish waves .
I expect AUDCHF to continue rising after a successful breakout from the flag’s upper boundary . If momentum sustains, the target could be around 0.54444 CHF .
Note: Stop Loss (SL) = 0.51972 CHF
Australian Dollar/ Swiss Franc Analyze (4-hour time frame).
Be sure to follow the updated ideas.
Do not forget to put a Stop loss for your positions (For every position you want to open).
Please follow your strategy; this is just my idea, and I will gladly see your ideas in this post.
Please do not forget the ✅ ' like ' ✅ button 🙏😊 & Share it with your friends; thanks, and Trade safe.

AUDJPY SHORT FORECAST Q3 W27 D1 Y25AUDJPY SHORT FORECAST Q3 W27 D1 Y25
Professional Risk Managers👋
Welcome back to another FRGNT chart update📈
Diving into some Forex setups using predominantly higher time frame order blocks alongside confirmation breaks of structure.
Let’s see what price action is telling us today! 👀
💡Here are some trade confluences📝
✅Weekly Order Block Identified
✅Daily Order block identified
✅4H Order Block identified
✅15' Order block identified
🔑 Remember, to participate in trading comes always with a degree of risk, therefore as professional risk managers it remains vital that we stick to our risk management plan as well as our trading strategies.
📈The rest, we leave to the balance of probabilities.
💡Fail to plan. Plan to fail.
🏆It has always been that simple.
❤️Good luck with your trading journey, I shall see you at the very top.
🎯Trade consistent, FRGNT X

Market next target 🔀 Disruption Analysis – Bullish Alternative Scenario
The current chart suggests a bearish outlook from the resistance zone (~$2,495–$2,500), targeting a drop below $2,425. However, here’s how a bullish disruption could break this bearish narrative:
---
🟢 Bullish Disruption Possibility:
1. Support Reclaim & Strong Buyer Reaction:
If price reclaims and holds above the marked “support area” (~$2,495), it could signal strength and trap early sellers.
A strong bullish candle closing above $2,505 could invalidate the bearish scenario.
2. Higher Low Formation:
If ETH prints a higher low above $2,470, it would suggest buyers are stepping in early, reinforcing bullish momentum.
3. Target Shift – Bullish Continuation:
A confirmed breakout above $2,505 may open the path to $2,540–$2,560 as the new short-term target zone.
4. Momentum Catalyst:
A positive U.S. macroeconomic event or crypto-specific bullish news (e.g., ETF, institutional inflows) could fuel upside disruption.

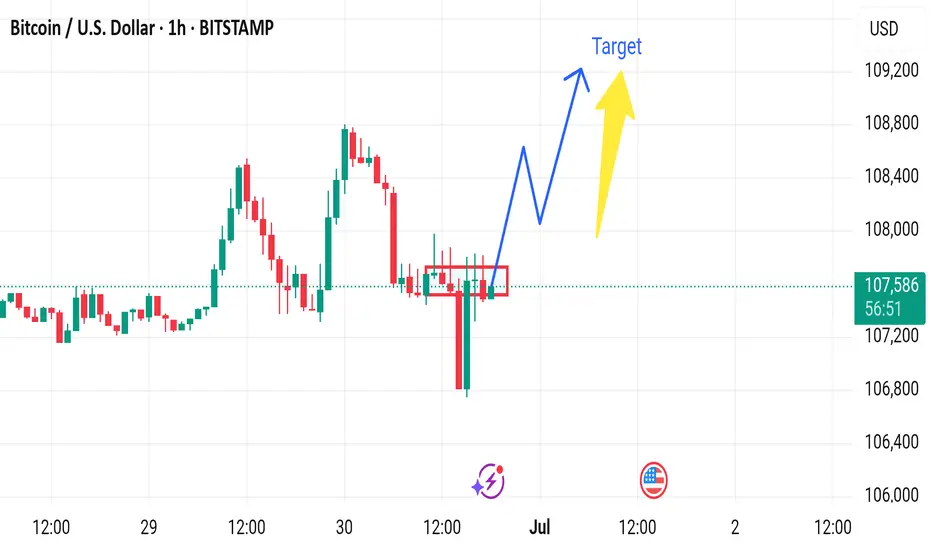
Market next target 🔀 Disruption Analysis – Bearish Alternative Scenario
The current chart suggests a bullish continuation from the consolidation zone around $107,300–$107,500, with a projected move toward $108,500+. However, the following bearish disruption could invalidate that path:
---
🔻 Bearish Disruption Possibility:
1. False Breakout Trap:
If price briefly spikes above the consolidation zone and quickly reverses, it could trap breakout buyers.
A failed bullish move around $107,800–$108,000 would be the first bearish signal.
2. Weak Volume Confirmation:
Lack of volume during the breakout would signal lack of institutional interest, increasing downside risk.
3. Break Below Support Zone:
If BTC breaks below $107,000, it would signal a loss of momentum and invalidate the bullish scenario.
This breakdown may lead to a quick move toward $106,000 or even $105,800, the recent swing low.
4. Macro Influence:
Any negative U.S. economic data or regulatory news could spark bearish sentiment and accelerate the drop.
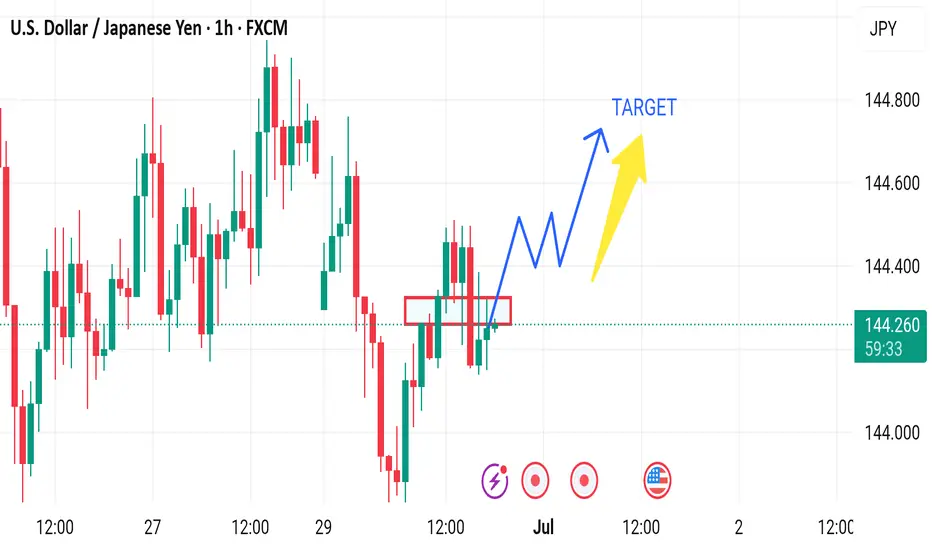
Market next move 🔀 Disruption Analysis – Bearish Alternative Scenario
While the current setup points to a bullish continuation above the support zone (around 144.10–144.20) with a projected target near 144.60, here’s how a bearish disruption could unfold instead:
---
🔻 Bearish Disruption Possibility:
1. Failed Breakout / Bull Trap:
Price may fake a move upward to trap breakout buyers near 144.40–144.50, then sharply reverse.
This would indicate a false breakout and potential reversal setup.
2. Rejection at Resistance:
Repeated failure to close above 144.40 may signal exhaustion.
Bearish divergence could form on momentum indicators (like RSI) as price rises.
3. Break Below Support Area:
A decisive break below the red support zone (around 144.10) may shift momentum bearish.
That would confirm a lower high and suggest downside continuation.
4. Next Bearish Target:
Initial support lies at 143.85, with further potential drop toward 143.60.
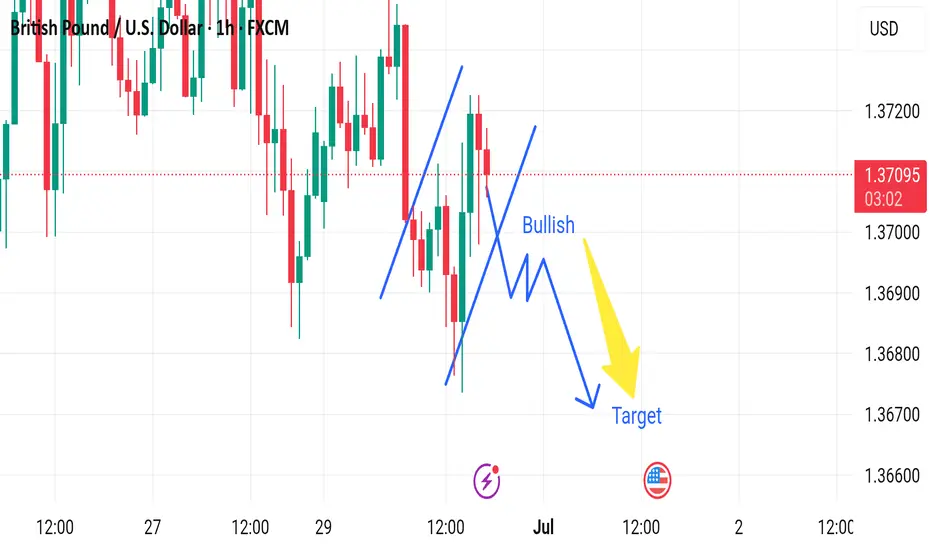
Market next target 🔀 Disruption Analysis – Bullish Alternative Scenario
While the current chart outlines a bearish scenario after a short-term bullish correction, leading to a drop toward the target near 1.36600, here’s how a bullish disruption could unfold instead:
---
🟢 Bullish Disruption Possibility:
1. False Breakdown / Bear Trap:
The market may dip slightly below recent lows to trigger sell stops and liquidity grab, then reverse upward.
If price finds strong buying interest around 1.3690–1.3700, it could spark a bullish reversal.
2. Strong Rejection Candles:
Watch for bullish engulfing or pin bar formations on lower timeframes (15m or 30m) near the dip area.
These would signal loss of bearish momentum.
3. Break of Lower High Structure:
A break above 1.3720 would shift short-term market structure to bullish.
It could lead to a move toward 1.3750–1.3780.
4. Macro Fundamentals:
Hawkish BOE comments or weak U.S. data could reverse USD strength, lifting GBP/USD.
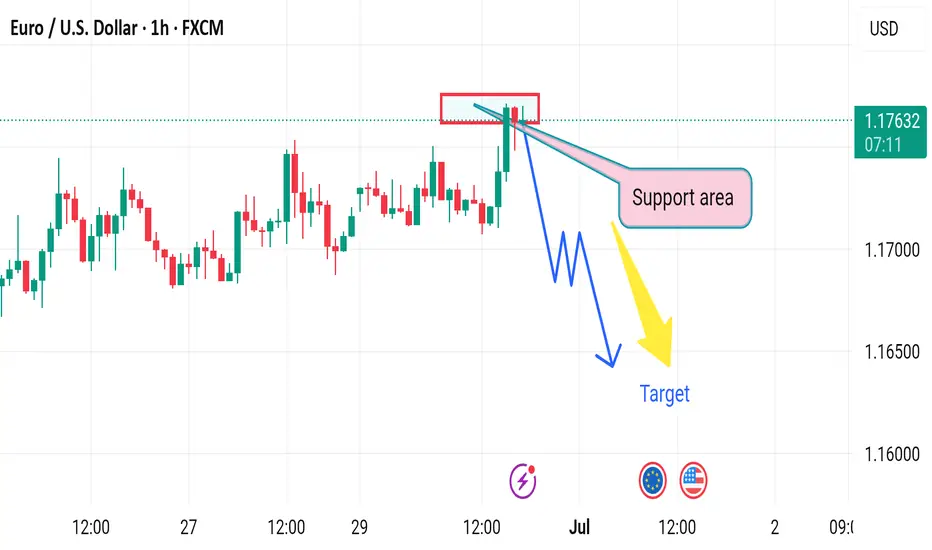
Market next move Disruption Analysis – Bullish Alternative Scenario
While the current chart suggests a bearish setup from a resistance zone (around 1.1765) toward a target near 1.1630, here's a potential bullish disruption that could invalidate the bearish thesis:
---
🟢 Bullish Disruption Possibility:
1. False Breakdown / Liquidity Grab:
Price may fake a dip below the red resistance-turned-support zone to trigger stop-losses before reversing.
This is known as a liquidity sweep or bear trap.
2. Higher Low Formation:
If the pair pulls back slightly but forms a higher low above 1.1700, it may signal bullish continuation.
3. Breakout Confirmation:
A strong bullish candle above 1.1775 could confirm continuation toward 1.1830–1.1850.
4. Fundamental Catalyst:
Positive EU economic news or dovish signals from the U.S. Fed could support Euro strength.
Market next target 🔀 Disruption Analysis - Alternative Scenario
While the current chart suggests a bullish breakout from the support area around $35.85–$35.90 with an upward target above $36.20, a potential bearish disruption scenario could unfold under the following conditions:
⚠️ Bearish Disruption Possibility:
1. Weakening Buying Pressure:
Price has tested the support zone multiple times, showing signs of weakening bullish momentum.
Buyers may be exhausting near the $36.00 area without strong follow-through.
2. Break Below Support:
If price breaks and closes below $35.85 support zone on high volume, it could invalidate the bullish setup.
This would create a lower low, indicating a potential trend reversal to the downside.
3. Next Downside Targets:
Immediate support lies around $35.60.
Further downside could take price to $35.40 if bearish momentum strengthens.
4. Bearish Triggers:
Negative economic data (especially U.S.-related as indicated by the calendar icon).
Rising DXY or bond yields may pressure silver prices

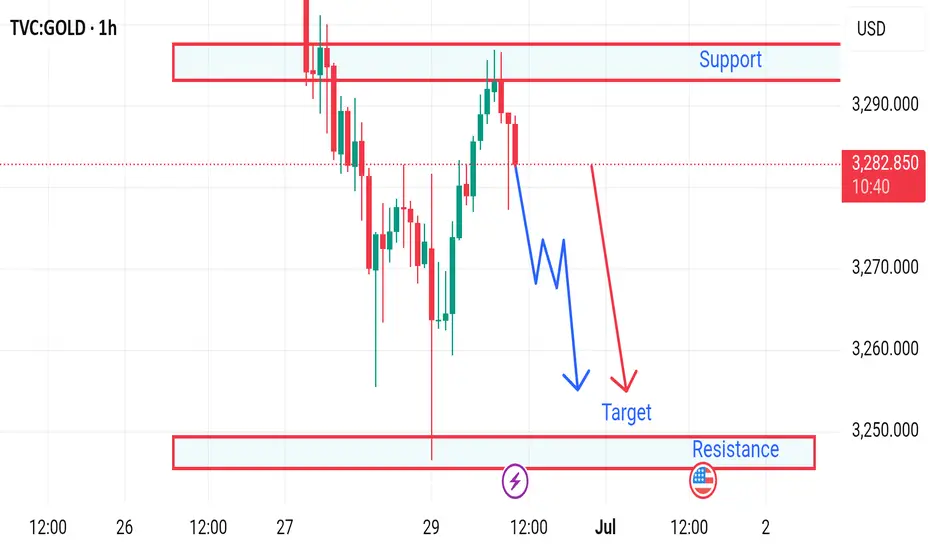
Market next move 📉 Gold Price Disruption Analysis – 1H Chart
Current Price: $3,282.880
Timeframe: 1-Hour
Trend Direction: Bearish bias with possible continuation toward $3,250
---
🔻 Bearish Scenario (Planned Path):
Support Turned Resistance: The area around $3,290 acted as strong resistance (previous support). Price failed to break above.
Lower High Formation: Price has created a lower high, indicating potential continuation to the downside.
Projected Target: A zigzag downward move is expected, with a target near $3,250, aligning with a key demand/support zone.
---
⚠️ Disruption Possibilities (Unexpected Movements):
🔁 1. Bullish Disruption Risk:
If buyers step in aggressively above $3,283–$3,285, we may see:
A break of structure
A reversal toward the $3,290+ zone
Possible formation of a double bottom or inverse head and shoulders
Disruption Target: $3,295–$3,300
🧨 2. False Breakdown at Support ($3,250):
Market could dip slightly below $3,250 to trap sellers and then reverse sharply.
A liquidity grab might lead to sudden bullish pressure, creating a disruption bounce.
📊 3. Fundamental Disruption Factors:
US Dollar strength/weakness
Fed interest rate news
Inflation data releases
These can instantly invalidate technical patterns and push price in either direction.
Market next move 🔄 Disruption Analysis: Contrarian View
⚠️ Original Viewpoint Summary:
The original analysis suggests a bearish breakdown from the rising channel, with a short-term target of 64.36, pointing to a move towards the support zone.
---
📉 Disrupted (Contrarian) Perspective:
🔁 Fakeout Scenario Possibility:
The sharp drop below the trendline may be a bear trap.
Price quickly bounced back into the channel region, showing buyer interest near the support.
🔎 Key Observations:
Wick rejection near the lower support suggests that demand is active around 64.50–64.36 zone.
The structure of higher lows is still valid unless there's a confirmed close below the support box.
Momentum indicators (not shown) may help validate whether this is a temporary pullback or a deeper correction.
📈 Alternative Projection:
If price holds above the support zone, it could rebound back to test 65.50–65.80 resistance.
A false breakdown followed by consolidation may lead to retest of the upper channel (near 66.00).
---
🧭 Revised Strategy Suggestion:
Avoid early shorts unless there is a confirmed candle close below 64.36.
Watch for bullish price action near support (hammer, engulfing) for a potential long re-entry.
Reevaluate if WTI forms a base around 64.40 — possible reversal setup.

NZDJPY Technical + Fundamental Short Alignment = Short SetupToday, I want to review the NZDJPY ( OANDA:NZDJPY ) pair short position from a fundamental and technical perspective . It seems to be in a good zone for a short position.
Do you agree with me?
----------------------------------------
First, let's look at the fundamentals of NZDJPY.
New Zealand (RBNZ):
The Reserve Bank of New Zealand cut the OCR by 25bps in May and hinted at further easing if inflation continues to cool. Recent CPI data has shown clear disinflation trends, increasing the likelihood of more rate cuts in the second half of 2025. Consumer confidence is also declining, and retail sales have been weaker than expected.
Japan (BoJ):
The Bank of Japan is under growing pressure to tighten monetary policy. Inflation remains above 2%, and market expectations for a rate hike later this year are building. Any shift from ultra-loose policy supports JPY strength, especially against weaker yielders like NZD.
Macro Summary:
Diverging monetary policies: RBNZ easing, BoJ possibly tightening.
NZD weakened by soft data, JPY strengthened by policy expectations.
Risk sentiment is currently neutral-to-negative, favoring safe-haven JPY.
Conclusion:
Short NZDJPY is fundamentally justified. The pair aligns with macro forces: NZD is pressured by rate cuts and weak growth, while JPY is poised to strengthen with upcoming policy shifts.
----------------------------------------
Now let's take a look at the NZDJPY chart on the 4-hour time frame .
NZDJPY is currently trading near the Potential Reversal Zone(PRZ) .
In terms of classic technical analysis , it appears that NZDJPY has successfully formed a Rising Wedge Pattern .
Also, we can see the Regular Divergence(RD-) between Consecutive Peaks.
Based on the above explanation , I expect NZDJPY to drop to at least 87.159 JPY if the lower line of the Rising Wedge Pattern and the Support zone(86.50 JPY-87.00 JPY) are broken, the second target could be 86.043 JPY .
Note: Stop Loss(SL): 88.378 JPY
Please respect each other's ideas and express them politely if you agree or disagree.
New Zealand Dollar/ Japanese Yen Analyze (NZDJPY), 4-hour time frame.
Be sure to follow the updated ideas.
Do not forget to put a Stop loss for your positions (For every position you want to open).
Please follow your strategy and updates; this is just my Idea, and I will gladly see your ideas in this post.
Please do not forget the ✅' like '✅ button 🙏😊 & Share it with your friends; thanks, and Trade safe.

EURUSD WEEKLY HIGHER TIME FRAME FORECAST Q3 W27 Y25EURUSD WEEKLY HIGHER TIME FRAME FORECAST Q3 W27 Y25
Professional Risk Managers👋
Welcome back to another FRGNT chart update📈
Diving into some Forex setups using predominantly higher time frame order blocks alongside confirmation breaks of structure.
Let’s see what price action is telling us today! 👀
💡Here are some trade confluences📝
✅Weekly Order block identified
✅Daily Order block identified
✅4H Order Block identified
🔑 Remember, to participate in trading comes always with a degree of risk, therefore as professional risk managers it remains vital that we stick to our risk management plan as well as our trading strategies.
📈The rest, we leave to the balance of probabilities.
💡Fail to plan. Plan to fail.
🏆It has always been that simple.
❤️Good luck with your trading journey, I shall see you at the very top.
🎯Trade consistent, FRGNT X
