Market next target 🟥 Disrupted (Bearish or Cautious) Analysis:
1. Failed Bullish Attempt Risk
While a bounce from the support zone (~3,260 USD) is visible, the momentum lacks strong bullish confirmation. The rejection from the support area could be a dead-cat bounce, especially since the overall trend leading into this zone was sharply downward.
2. Volume Divergence
The volume spike on the large red candle suggests heavy selling pressure, not accumulation. The weak follow-up volume on the minor green recovery bars indicates a lack of buyer confidence.
3. False Breakout Possibility
If price does push toward the “Target” or even the “Resistance” zone (3,290–3,310), it might be a bull trap, luring late buyers in before a reversal back downward.
4. Bearish Continuation Scenario
Price may retest the support zone (3,260) again.
If this support breaks decisively, it could trigger a strong sell-off, with potential to test lower zones around 3,240 or even 3,200.
Forexsignal

Market next move Disruption (Bearish Scenario):
1. False Breakout Risk:
The price has recently tested the lower support range (red boxes) several times without strong follow-through. This could suggest weak buying momentum.
2. Volume Spike Trap:
The large volume spike on the wick down may represent stop-loss hunting or a liquidity grab rather than true accumulation. If it were strong accumulation, we would expect a more sustained bounce.
3. Resistance Zone Ahead:
The price is nearing resistance around $3,275–$3,280, where previous breakdowns started. If it fails to break above this zone decisively, a rejection and continued downtrend is possible.
4. Lower High Formation:
The most recent price action could form a lower high, suggesting a continuation of the bearish trend instead of a reversal.
---
🔽 Bearish Path (Alternative Projection):
Price retests $3,275–$3,280, fails to break out.
Drops below the red box support (~$3,260).
Heads toward the next support levels around $3,240 or lower.
📉 "Target becomes invalidated if price fails to hold above the red box support zone."

Market next target ⚠️ Disruption & Analytical Weaknesses:
1. Support Zone Already Broken (Wick Penetration):
The candlestick wick clearly pierced the support level drawn on the chart.
This indicates that buyers are weak at that level — the support is not holding firmly.
Relying on this support for a bullish bias is risky, as it may soon turn into resistance.
2. Volume Confirms Weakness, Not Strength:
The bounce from the support zone happens on low or declining volume, suggesting lack of strong buying interest.
A legitimate bullish reversal should be backed by a volume surge — here, that’s absent.
3. False Sense of Recovery:
The analysis shows arrows projecting straight up to the “Target” level, implying a smooth bullish recovery.
This is unrealistic given the recent choppy price action and repeated failures to hold gains above 107,200.
Price action suggests uncertainty or distribution, not clean bullish momentum.
4. Tight Range and High Volatility Ignored:
Price has been ranging between ~106,400 and ~107,600 with rapid whipsaws.
This kind of structure is often indicative of indecision, and setting a clear directional target without breakout confirmation is premature

Market next target ⚠️ Disruption & Counterpoints:
1. Premature Breakout Bias:
The chart shows price repeatedly rejecting the resistance zone (highlighted in red).
The arrow assumes a clean breakout without confirmation — this is speculative, as the price hasn’t closed convincingly above the resistance.
This could easily turn into a false breakout or double top if price fails again.
2. Volume Mismatch:
A breakout should be backed by strong bullish volume. However, the current volume is mixed and not showing a clear surge in buyer strength.
Lack of volume confirmation makes the breakout less reliable.
3. Ignoring Recent Rejections:
The red zone was tested multiple times in the last sessions without success. That typically signals strong supply or institutional selling.
Repeating this setup without accounting for historical failure adds downside risk.
4. Missing Bearish Scenario:
No alternate path is considered. A failed breakout could lead to a pullback toward 144.00 or lower, especially with U.S. news events (indicated by the flag).
A balanced analysis should always prepare for both breakout and rejection.
5. Macroeconomic Event Risk:
Similar to the GBP/USD chart, this one also shows an upcoming U.S. economic event. That could heavily move USD/JPY, and technical setups may become invalid fast.
The analysis ignores the need to wait for the news catalyst or confirmation after the release.

Market next move ⚠️ Disruption & Counterpoints:
1. Labeling Error – "Bullish" in a Bearish Trend:
The chart clearly shows a strong downtrend starting after the peak on June 28.
Despite this, the word "Bullish" is used alongside a downward zigzag, which is misleading. This is not a bullish structure — it's a bearish continuation pattern or possibly a bear flag, which suggests further downside.
Using “Bullish” here may confuse traders into thinking a reversal is expected, while the actual trend favors further decline.
2. No Confirmed Reversal Pattern:
There's no double bottom, inverse head and shoulders, or any bullish candlestick formation (e.g., engulfing or hammer) to indicate a likely bullish reversal.
Without strong reversal signals, expecting a bullish move here lacks technical support.
3. Target Box Ambiguity:
The “Target” box is not clearly justified. There are no Fibonacci levels, previous support zones, or measured move explanations backing it.
A target should be based on a technical level — such as the bottom of a previous range, a support zone, or a projection from a pattern.

Market next target 🔍 Disruption Analysis of the EUR/USD Chart
1. "Support" Label Positioned at the Current Price Level
Disruption: The chart marks 1.1705 as “Support,” but price is sitting directly on or slightly above it.
Challenge: If price is already breaking through or hovering at support without bouncing, it’s a sign of weakness — this zone may no longer be valid as support.
✅ Correction: Re-label this area as “Potential Resistance” if a breakdown confirms.
---
2. Directional Bias Assumes Continuation Without Confirmation
Disruption: Three yellow arrows indicate a bearish continuation, yet no bearish candlestick pattern, volume spike, or break-close-below-support has been confirmed.
Challenge: This is a premature projection that lacks price action validation.
✅ Correction: Wait for a confirmed candle close below 1.1700 with increased volume to validate the move.
---
3. Volume Ignored Despite Clear Clues
Disruption: There is rising volume during the move down near support — this could indicate either strong selling or smart money accumulation.
Challenge: Volume analysis is completely overlooked, missing a critical layer of confirmation.
✅ Correction: Analyze the volume spike on the red candles; if followed by weak follow-through, a bullish reversal may be setting up instead

Market next move 🔍 Disruptive Analysis of the Original Chart
1. Labeling Conflict: "Bullish" with Bearish Arrow
Disruption: The term "Bullish" is written, yet the arrow clearly shows a downward movement. This is contradictory.
Challenge: A downward movement typically suggests bearish sentiment. Either the label is incorrect, or the directional analysis is flawed.
2. Support/Resistance Confusion
Disruption:
The chart shows "Support" at around 36.15 but labels the zone below it as "Target" and "Resistance", which is illogical.
Resistance should be above the current price; support below.
Challenge: It appears that the analyst has inverted the traditional roles of support and resistance.
3. Unclear Volume Interpretation
Disruption: The volume at the bottom is not analyzed or discussed. Yet volume spikes correlate with high selling pressure near resistance.
Challenge: Without volume context, predicting price movement is speculative.

XAUUSD GOLD buy holdXAUUSD GOLD BUY NOW – LONG TRADE SETUP ACTIVE 🟡📈
Gold has pulled back to a key support area and is now showing signs of strength at the current price of $3301.
This zone is acting as a strong base for buyers, signaling a potential bullish continuation in the coming sessions.
We are entering a LONG position with a favorable risk-to-reward ratio, supported by market structure and technical confirmation.
🔹 Current Price: $3301
🎯 Target Levels: First target at $3350, extended target at $3400+
🛑 Stop Loss: Recommended below $3275 to protect capital
As long as price holds above the support zone, bulls remain in control.
Patience, discipline, and proper risk management are key — let the trend do the work.
Gold is poised for upside — time to ride the wave!

Market next target 📉 Disruption: Bearish Outlook Contradiction
1. Resistance Zone Rejection:
The price action is repeatedly failing near the 107,800–108,000 resistance zone.
The chart shows several long upper wicks, indicating strong selling pressure when BTC tries to move higher.
2. False Breakout Risk:
The recent bullish candle with a long lower wick could be a bull trap—designed to lure buyers before a reversal.
Price may retest the red box (support turned resistance) and fail to hold above it.
3. Volume Analysis:
Despite a small recovery, volume is not increasing significantly, which is not typical of a strong bullish move.
A lack of strong buyer volume could indicate exhaustion.
4. Lower High Structure:
The chart is still forming lower highs, a sign of a downtrend continuation unless it breaks above 108,000 convincingly.

Market next move Disruption of the Bullish USD/JPY Analysis
1. Weak Bullish Momentum
The current bullish attempt is showing small-bodied candles with low follow-through.
Disruption: This suggests a lack of conviction from buyers. If there’s no strong bounce soon, it could indicate distribution rather than accumulation.
2. Volume Imbalance
Notice the recent spike in bearish volume (red bars), especially during the last price drop.
Disruption: Volume is supporting the downtrend, not the rebound. This suggests sellers are still in control.
3. Lower High Structure
The price recently failed to form a higher high and continues forming lower highs and lower lows.
Disruption: This pattern is a classic sign of a continuing bearish trend, contradicting the bullish target.
4. Fundamental Headwinds
The U.S. economic icon (flag) suggests an upcoming high-impact event — likely NFP, GDP, or rate decision.
Disruption: If U.S. data is weak or if there's talk of the Fed pausing rate hikes, USD could weaken, pushing USD/JPY further below 144.000.

Market next target 🔁 Disruption of the Current Bullish Analysis
1. Resistance Rejection Likelihood
The chart suggests a breakout above resistance will turn the red box into support.
Disruption: The price is currently at a key resistance zone, and multiple rejections in this area previously suggest selling pressure.
We could see a double top formation or a false breakout trapping bulls.
Look for wicks or long upper shadows indicating weakness.
2. Volume Divergence
Recent bullish candles show declining or inconsistent volume.
Disruption: A strong bullish breakout requires rising volume. If volume doesn't confirm price action, this move may lack conviction and reverse sharply.
3. Overbought Conditions
After a strong uptrend, RSI or Stochastic indicators (not shown, but implied) could be entering overbought territory.
Disruption: This suggests limited upside and a potential for mean reversion or correction.
4. Bearish Candlestick Pattern Watch
Watch closely for a bearish engulfing, shooting star, or evening star at this resistance zone.
Disruption: Any bearish reversal pattern here would strongly contradict the bullish breakout thesis.

Market next move
🔁 Disruption of the Current Analysis
1. False Breakout Scenario
The chart assumes a bullish move breaking resistance before a bearish reversal.
Disruption: This could be a false breakout, where the price appears to break above resistance but lacks strong volume and momentum. Traders get trapped long, and the price quickly reverses below resistance, invalidating the bullish leg entirely.
2. Stronger Uptrend Continuation
Despite calling for a bearish target, the overall trend appears strong with higher highs and higher lows.
Disruption: Instead of a retracement, EUR/USD could break through the resistance zone convincingly, possibly reaching 1.1750–1.1800, supported by:
Increasing volume
Bullish candles closing above resistance
No signs of bearish divergence on RSI/MACD (if added)
3. Fundamental Factors
The chart ignores macro data.
Disruption: If upcoming EU economic data is stronger than expected, or if US data disappoints, the euro could strengthen further.
Upcoming events with the euro and US flags suggest possible volatility.
4. Volume Contradiction
Recent bullish candles are supported by strong volume, suggesting accumulation.
Disruption: If smart money is accumulating positions, this would support further bullish continuation, not reversal.

Market next move Disruptive (Bearish) Scenarios:
1. False Breakout Risk
The recent bullish candles could be a bull trap.
Price may test the “support” trendline, fail to hold, and break downwards instead of continuing upward.
Watch for rejection near the target area or sharp sell-offs on high volume.
2. Overhead Resistance Zone
Price is approaching historical resistance near the $3,350–$3,355 area.
If it fails to close above this level on strong volume, it may reverse sharply.
3. Divergence Warning (Check RSI/MACD)
If you check oscillators like RSI or MACD, and they show bearish divergence (price makes higher highs, indicator makes lower highs), that could signal a weakening bullish momentum.
4. Volume Decline
The volume spikes on the recent bullish move, but volume drops afterward could indicate lack of buying interest to sustain the rally.
5. Fundamental Triggers
Any sudden macroeconomic news (e.g. strong USD data, interest rate hikes, geopolitical developments) could trigger a sharp selloff in gold, invalidating the bullish setup.

Market next target 🚀 Bullish Disruption Analysis
1. Support Holds Above 35.80
The market may dip slightly but find strong support around the 35.90–36.00 zone.
Instead of continuing lower, buyers absorb the selling pressure, leading to a sharp bullish reversal.
2. Bullish Continuation After Consolidation
The current pullback could just be a healthy retracement following the strong recovery move from the previous dip.
This could form a bullish flag or ascending triangle, eventually breaking above 36.20 and pushing higher.
3. Volume Clue
If the pullback happens with declining red volume, while previous green candles had strong volume, it signals a temporary correction rather than a trend reversal.
Watch for a bullish engulfing candle backed by strong volume to confirm.
4. Macro Trigger / Fundamental Support
Any dovish signal from the Fed, rising inflation, or weakening USD could increase investor demand for silver, pushing prices back up.
A news-driven reversal could invalidate the bearish path quickly.
5. Bullish Price Target
If buyers take control, silver could retest and break above 36.30–36.40, aiming toward 36.60 or even 36.80.

Market next move 🔻 Bearish Disruption Analysis
1. False Breakout / Bull Trap
The price might briefly break above the red resistance zone (highlighted), triggering buy orders.
However, instead of continuing higher, sellers step in aggressively, pushing the price back below resistance.
This would form a fakeout or bull trap, catching breakout buyers off-guard.
2. Volume Divergence
Look at the volume at the breakout: if the breakout occurs on declining or weak volume, it's a warning sign that the move lacks conviction.
The breakout may not sustain without strong volume backing it.
3. Lower High Formation
If the price fails to make a higher high above the previous peak (~3,340-3,345), and reverses downward, it indicates buying exhaustion.
4. MACRO/FUNDAMENTAL Trigger
Sudden news (e.g., strong USD data, interest rate hike comments from the Fed, or geopolitical tension easing) could cause a sharp sell-off in gold.
This would invalidate the bullish pattern entirely.
5. Bearish Price Target
If the disruption plays out, price could drop back to 3,300 or below, especially if support is weak.
A confirmed lower low below 3,310 would suggest a larger bearish structure

Gold Holding Strong – Eyes on $3400 and Beyond! (READ)By analyzing the gold chart on the 4-hour timeframe, we can see that after our last analysis, the price corrected down to $3341, then rallied back up to $3399. Currently, gold is trading around $3373, and if it manages to hold above $3355, we can expect further upside movement.
Potential bullish targets are $3400, $3417, $3450, and $3468.

Market next target ⚠️ Disruption Analysis – BTC/USDT
1. False Bullish Narrative
The chart labels the structure as “Bullish”, yet recent price action shows:
A strong rejection near 106,000.
Followed by multiple red candles with increasing volume — a common sign of sell pressure re-entering the market.
The bullish label may be premature or misleading based on this momentum shift.
2. Bearish Structure Developing
The price is starting to form a lower high after the sharp drop.
The outlined path resembles a head-and-shoulders pattern in early development, often preceding a bearish breakdown.
The breakdown could lead directly to the "Target" zone or even below if momentum increases.
3. Volume Divergence
The volume spike during the pump was not sustained. Post-spike, volume is declining on green candles, suggesting buyers are exhausted.
Sellers are likely using liquidity at the top to exit positions, not initiate new longs.
4. Support Turned Resistance
The red boxes mark failed support zones which now may act as resistance.
If price attempts to retest these zones and fails, it would confirm bearish control and validate the downward path toward the target (104,400–104,000).

Market next target ⚠️ Disruption Analysis – BTC/USD
1. Questionable Bullish Bias
The chart labels the structure as "Bullish," but the current setup looks more like a potential distribution phase than a healthy continuation pattern.
The price is moving sideways with declining volume, suggesting buyers are losing strength.
2. Volume Discrepancy
Notice the spike in volume during the sharp move up, followed by flat candles and lower volume.
This is typical of a "pump and fade" structure, where large players exit after a rapid price move, leaving retail traders with poor entries.
3. Resistance Not Clearly Broken
Price failed to sustain above 105,800–106,000, indicating that the resistance zone remains valid.
The recent rejection candles near this level suggest sellers are active and overhead pressure is strong.
4. Descending Into Compression
The blue "descending" structure before the sideways move may signal a bearish flag or a pause before further downside—not necessarily a bullish sign.
5. False Reversal Warning
The bullish pattern drawn with zig-zags (implying consolidation before continuation) could actually be setting up a bull trap.
If price fakes a bounce and then breaks below 104,800, a sharper decline toward the 103,000 target could accelerate quickly.

Market next target ⚠️ Disruption Analysis – USD/JPY
1. Sideways/Flat Price Action
Price is consolidating in a tight range with small-bodied candles.
This indicates indecision and lack of momentum, not strength.
The upward arrows suggest bullish bias, but no strong signal confirms a breakout yet.
2. Bearish Momentum
The recent red candles dominate, showing a clear drop from above 146.000 earlier.
The overall trend (short-term) is down, and the support area could be tested again.
3. Decreasing Volume
Volume is fading out, especially the most recent bar (around 1.01K).
This suggests waning interest—any bullish breakout without volume support is likely to fail or reverse.
4. Resistance Area is Strong
The resistance zone near 145.800–146.000 is clearly tested before and held.
Without a significant catalyst, it's unlikely to break in the near term.
5. False Breakout Risk Above Target
The marked "target" just below resistance could trigger false bullish entries.

Market next move ⚠️ Disruption Analysis of the Chart
1. False Breakout Risk
The price is currently within an ascending channel, which is often seen as bullish.
However, the recent candlesticks show smaller bodies with wicks on top, indicating buyer exhaustion.
A false breakout above the upper trendline or support around 1.3632 could trap buyers before a sharp reversal.
2. Low Volume Confirmation
Volume peaked earlier but has significantly decreased in the last few candles.
Weak volume during a price rise signals a lack of conviction, increasing the likelihood of a pullback.
3. Resistance Flip Not Confirmed
The level around 1.3600 is marked as resistance-turned-support, but there is no strong retest confirmation yet.
If price revisits this zone and fails to bounce, this support could break, leading to a downside reversal.
4. Divergence Watch
While not visible in this static image, if you overlay RSI or MACD, there could be signs of bearish divergence (price making higher highs while momentum indicators make lower highs).
This is often a leading indicator of trend weakening.

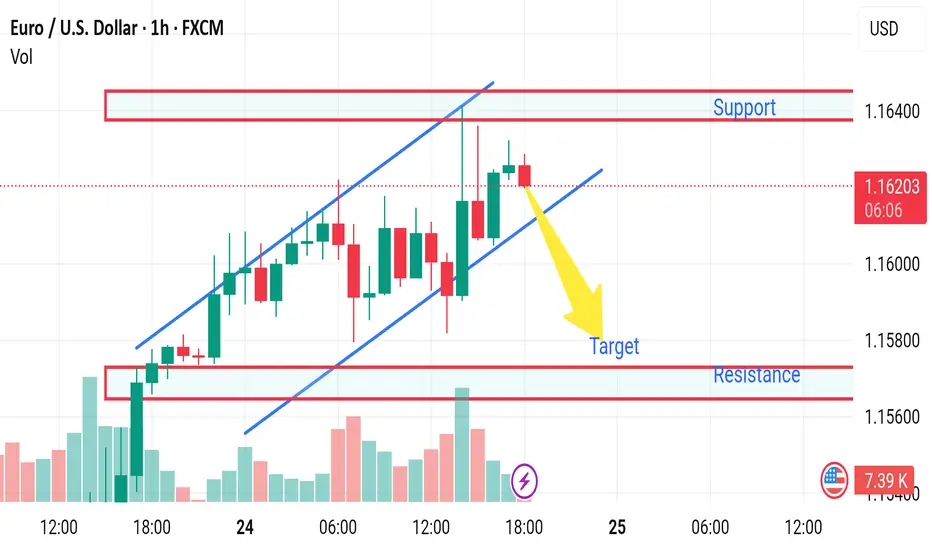
Market next target 🔁 Disrupted Analysis (Bullish Scenario Instead of Bearish)
1. Price in an Upward Channel:
The price remains within a clear ascending channel, respecting both upper and lower bounds.
The bearish arrow prematurely predicts a breakdown while no support break has occurred.
2. Strong Bullish Momentum:
Price is making higher highs and higher lows, a textbook bullish structure.
The recent dip respected the lower trendline and was followed by strong green candles.
3. Volume Confirmation:
Notice the increasing bullish volume on the recent push higher.
That suggests buyers are still in control, contradicting the bearish prediction.
4. Invalidation of Bearish Breakdown:
Until the lower blue trendline is clearly broken with volume, the bearish target is speculative.
Support is holding at 1.1610–1.1600 zone, which may become a launchpad for further gains.
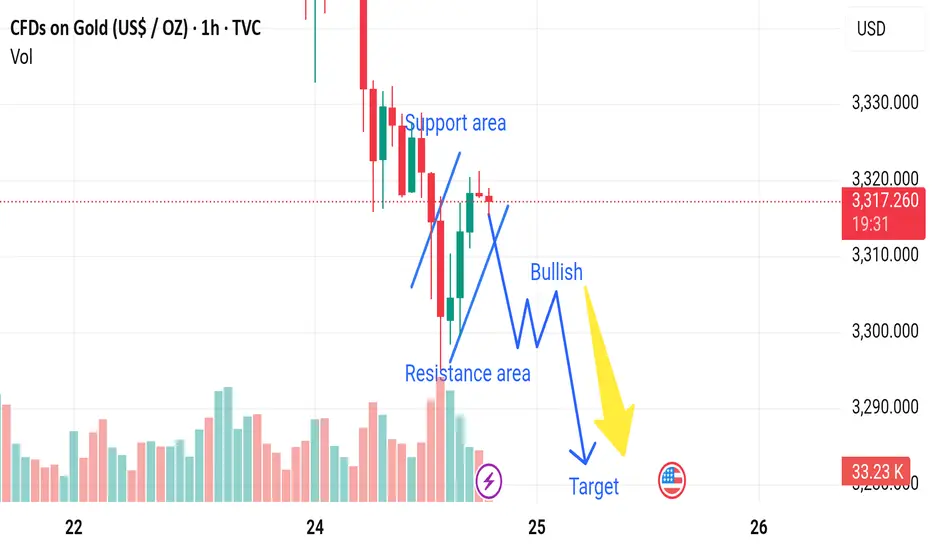
Market next move 🔁 Disrupted Analysis (Bullish Scenario Instead of Bearish)
1. Support Holding Firm:
The analysis assumes the price will drop after failing resistance, but the current price action is showing higher lows, suggesting accumulation.
The support area has been tested multiple times, showing strength.
2. Volume Analysis Contradiction:
Recent green volume bars indicate buying interest at lower levels.
No significant volume spike on the last downward leg, suggesting lack of strong selling pressure.
3. Potential Inverted Head and Shoulders:
The current formation could be the right shoulder of an inverted head and shoulders pattern, a classic bullish reversal setup.
If confirmed, this could lead to a breakout above the resistance area, not a drop.
4. Trendline Breakout Watch:
There's a potential bullish breakout of the descending trendline.
A break above 3,320 USD could invalidate the bearish thesis and suggest a target near 3,340–3,350 USD.

Market next target 🔁 Disrupted Analysis (Bullish Scenario Instead of Bearish)
1. Support Holding Firm:
The analysis assumes the price will drop after failing resistance, but the current price action is showing higher lows, suggesting accumulation.
The support area has been tested multiple times, showing strength.
2. Volume Analysis Contradiction:
Recent green volume bars indicate buying interest at lower levels.
No significant volume spike on the last downward leg, suggesting lack of strong selling pressure.
3. Potential Inverted Head and Shoulders:
The current formation could be the right shoulder of an inverted head and shoulders pattern, a classic bullish reversal setup.
If confirmed, this could lead to a breakout above the resistance area, not a drop.
4. Trendline Breakout Watch:
There's a potential bullish breakout of the descending trendline.
A break above 3,320 USD could invalidate the bearish thesis and suggest a target near 3,340–3,350 USD.