Trading strategy the beginning of the week,waiting for NonfarmWorld gold prices tend to decrease with spot gold down 2.1 USD compared to last week's closing level to 2,080.2 USD/ounce.
Last week, the gold market entered a new trading week relatively quiet without catalysts. Prices were nearly flat until Thursday when a report showed consumer prices were lower than forecast. After a slow start Friday morning, the precious metal began to attract some follow-on buying momentum following the results of the University of Michigan's consumer sentiment survey and weaker-than-expected manufacturing data. April gold futures prices continuously increased and closed the week at 2,095.2 USD/ounce, up 2% compared to the previous week. This was the best weekly gain since November.
Although gold had a spectacular breakthrough last week, experts are still cautious about this precious metal in the short term. Some opinions say that the gold market may be under profit-taking pressure this week and the price is likely to be pushed back to the range that gold has maintained in recent times. Besides, although recently released data shows that inflationary pressures are decreasing, according to experts, that is still not enough for the US Federal Reserve (Fed) to change its view on interest rates. . The data released this week is considered very important as it can change the newly rekindled market optimism.
This week, the market will wait for the February non-farm payroll report. This employment data is considered very important by investors and can take away everything that gold had last week. . Forexlive.com expert Adam Button said that he only believes last week's price increase in gold is sustainable if the upcoming report shows that the job market is actually going down.
Forexsignal

Forex preview: NFP, Powell’s testimony, and BoC and ECB decisionThe key events for the week are concentrated mainly between Wednesday and Friday.
In the United States, the focus will be on January jobs data and speeches by Federal Reserve officials. The most important of the bunch is of course Federal Reserve Chair Powell two-day testimony in Congress on monetary policy starting Wednesday. Traders will look for cues regarding the future trajectory of monetary policy, with special attention paid to the Q&A session following Powell's opening remarks.
Friday will bring the release of Non-Farm Payroll (NFP) data, with expectations of a 188,000 job increase in February. This would be a significant drop from the 353,000 jobs added in January. JOLTs job openings are anticipated to fall to 8.9 million in January after two consecutive months of increases (Wednesday).
In Canada, the Bank of Canada is anticipated to maintain interest rates unchanged for the fifth consecutive time on Thursday.
In Europe, the European Central Bank (ECB) is expected to keep rates unchanged on Thursday. ECB members continue to advocate for a patient stance, with the consensus being to wait for Q1 2024 wage data before considering a rate cut in June, aligning with current market expectations.
In the United Kingdom, all eyes will be on Finance Minister Jeremy Hunt's pre-election budget on Wednesday, which is expected to include tax cuts, which according to the guardian “... runs the risk of getting an adverse reaction from the markets which would snuff out what is still a lukewarm and tentative economic recovery.”

Dollar bearish trend on NFP can rise read the caption The Fed must be holding back the temptation to say, ‘we told you so’ now that market expectations match those released in the Fed’s December summary of economic projections. Three rate cuts in 2024 is the new expectation, down from six and potentially seven at one stage. As such, the dollar has found its footing in the early weeks

Long Signal for EURAUD!In the EURAUD 4-hour chart, prices made a retest, also known as pullback, to the broken resistance zone. This zone also corresponds to the Fibonacci 0.382 level. The uptrend may continue from where it left off. This is not an investment advice!

Xauusd up Gold climbs to multi-week high near $2,050 as US yields edge lower
Gold gained traction and advanced to its highest level since early February above $2,040 on Thursday. The benchmark 10-year US Treasury bond yield drops toward 4.2% after US PCE inflation data, providing a boost to XAU/USD.
Gold has been considered a highly valuable commodity for millennia and the gold price is widely followed in financial markets around the world. Mostly quoted in US Dollars (XAU/USD), gold price tends to increase as stocks and bonds decline. The metal holds its value well, making it a reliable safe-haven. It’s traded constantly based on the intra-day spot rate. Improve your technical analysis of live gold prices with the real-time XAU/USD chart, and read our latest gold news, expert analysis and gold price forecast.
Gold now buy 2046
Target 2050
Target 2055
Target 2060
SL 2036

Gold record making move read the caption Gold according to the 1-hour chart, XAU/USD lost momentum but holds on to gains, limiting the risk of a steeper slide. The 20 SMA heads firmly north, far below the current level, momentum, while the longer moving averages remain directionless. XAU/USD hovers around a flat 100 SMA Technical indicators, in the meantime, eased from near overbought readings, reflecting the ongoing retracement rather than suggesting

CADJPY:🟢Is it bullish...?!🟢(Details on caption)
As you can see, the price took the sell-side liquidity and had a bearish reaction, in addition, we can see the price created the bullish breaker block and FVG.
Now, we can expect the price to move higher to collect the buy-side liquidity, for that, it may happen from here or retrace more to a bullish order block which formed on the 50% level Fibonacci.
💡Wait for the update!
🗓️01/03/2024
🔎 DYOR
💌It is my honor to share your comments with me💌

AUDCAD SELL | Trading AnalysisHello Traders, here is the full analysis.
I think we can soon see more fall from this range! GOOD LUCK! Great SELL opportunity AUDCAD
I still did my best and this is the most likely count for me at the moment.
Support the idea with like and follow my profile TO SEE MORE.
Traders, if you liked this idea or if you have your own opinion about it, write in the comments. I will be glad 🤝
Patience is the If You Have Any Question, Feel Free To Ask 🤗
Just follow chart with idea and analysis and when you are ready come in THE GROVE | VIP GROUP, earn more and safe, wait for the signal at the right moment and make money with us💰

Eurusd return to sell read the caption The EUR/USD daily chart sees the pair remaining confined to the 1.0801 -1.0862 area during the last three days, bracing around the 200-day moving average (DMA) at 1.0821 Relative Strength Index (RSI) studies turned bullish, but buyers need to achieve a daily close above last Friday’s high, to remain hopeful of testing the 50-DMA at 1.0882 ahead of the 1.0901 figure. Otherwise, the pair could dive towards the 200-DMA and below, exposing the 1.0801
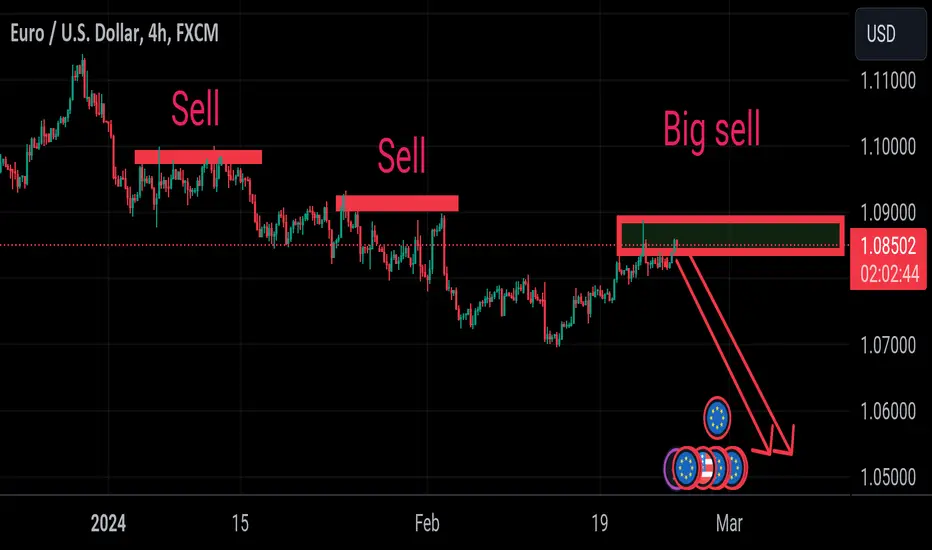
EURUASHello traders ,what do you think about EURUSD ? This currency pair has broken its trend line and is pulling back to the broken zone. It is expected to fall at least yo the specified level after the completion the pullback
If this post was useful to you, do not forget to like and comment.❤️

XAU detained after receiving news of Durable Goods Orders m/mThe world gold market is quiet as investors are waiting for important reports this week. It is expected that the personal consumption expenditure index (PCE) report, which is expected to influence the interest rate direction of the US Federal Reserve (Fed), will be published today.
In recent statements, Fed officials left open the possibility that the US Central Bank will not discuss cutting interest rates until mid-year.
With that in mind, this expert said that the short-term direction of gold will continue to depend on upcoming economic data and their impact on the USD, yields and, not least, the future. Hope for interest rate cuts.

analysis update on USDJPY ( 28 February 2024 )this is an update from yesterdays USDJPY analysis, as yall can see price went in the predicted direction. Now I'm expecting sell entries soon but lets not get our hopes up anything can happen. Ill keep yall updated. please keep in mind these are not signals and I don't provide financial advice or sell anything, I just enjoy analysing my charts and being active in the market. Yall can use my videos as ideas and please feel free to comment , share your ideas and tips. Thank you.
#forex #forextrading #USDJPY #money #falconfx

EURCHF,🔴Sell opportunity🔴(Details on caption)Well, as you can see the price grabbed the liquidity above the previous day's high and shifted the market structure.
We can enter the sell position only with the LTF confirmation in the supply zone.
If you have questions, feel free to ask.
💡Wait for the update!
🗓️28/02/2024
🔎 DYOR
💌It is my honor to share your comments with me💌


AUDUSD 200pips SELL see WHY below.AUDUSD just tanked below the PML - Previous Monthly Low. Considering we didn't get a proper DIVERGENCE on the last Leg we are now expecting this leg to get us the proper DIV leg we have been expecting.
We expect a pullback to the PML then a FLUSH to the next KEY ZONE.

USDCAD BUY | Day Trading AnalysisHello Traders, here is the full analysis.
Price reversal going up, levels for BUY .. GOOD LUCK! Great BUY opportunity USDCAD
I still did my best and this is the most likely count for me at the moment.
Support the idea with like and follow my profile TO SEE MORE.
Traders, if you liked this idea or if you have your own opinion about it, write in the comments. I will be glad 🤝
Patience is the If You Have Any Question, Feel Free To Ask 🤗
Just follow chart with idea and analysis and when you are ready come in THE GROVE | VIP GROUP, earn more and safe, wait for the signal at the right moment and make money with us💰
