Opportunity for selling EURUSDI see that EURUSD has confirmed strong resistance, so I took a sell trade with it.
Forexsignal

XAU/USD Bullish Continuation SetupThe chart illustrates a bullish market structure for XAU/USD, with price action currently trending upwards. Key technical observations:
Support Zone:
Price has recently bounced from a support zone around 3,399.710, indicating strong buying interest.
Bullish Projection:
A bullish continuation is expected. The chart outlines a potential scenario with a minor retracement towards 3,432.835 or 3,399.710, followed by a strong upward move.
Targets:
Immediate resistance is around 3,502.669.
If broken, price may aim for 3,550.351.
Final projected target lies near 3,680.000, which aligns with a historical supply zone.
Indicators:
The green enveloping bands suggest increasing volatility, with the price respecting the upper band, supporting bullish momentum.
Conclusion:
XAU/USD appears poised for a bullish breakout continuation. A potential pullback could offer a buy opportunity, targeting higher resistance zones as long as the structure remains intact

Try a R/R1 BuyThis signal is based on a 60% win rate backtested strategy...
1st order:
Buy @ 3418.3
SL: 3410
TP: 3426
2nd order:
Buy Limit @ 3414
SL: 3410
TP: 3426
Manage your Risk...

Opportunity for buying EURUSDEURUSD touched strong support, so I think it will rise further, as shown.

GBPCHF Breaks Rising Wedge – Reversal Targets 1.0940 and 1.0815GBPCHF has broken down from a rising wedge formation on the 4H chart, signaling a shift from bullish momentum to bearish control. The pattern break comes near the 50% retracement level, with price now trading below ascending trendline support. With fundamental headwinds weighing on the British pound and safe-haven demand supporting the Swiss franc, the setup favors a short bias targeting the 1.0940 and 1.0815 zones.
🔍 Technical Analysis
Pattern: Rising wedge → broken to the downside
Breakout Confirmation: Price has closed below the wedge support (trendline)
Key Support Levels:
1.0940 → 38.2% fib + previous structure support
1.0815 → 23.6% fib retracement + horizontal support zone
1.0608 → Full wedge base (longer-term target)
Resistance / Invalidation:
1.1150 – a close back above this level invalidates the breakdown
Candle Behavior:
Bearish structure forming with lower highs
Clean engulfing candle closed below wedge
📉 Bias: Bearish (confirmed technical reversal)
🌍 Fundamental Context
🇬🇧 British Pound (GBP)
UK CPI expected to rise (3.3% forecast), which may limit BoE cuts, but not bullish enough to support GBP
Political uncertainty resurfaces (Labour slipping in polls)
BoE speakers are split; no clear support from policy
🇨🇭 Swiss Franc (CHF)
Safe-haven flows rising on:
Global growth slowdown
Tensions between U.S.–Iran
Downgrade of U.S. debt → risk aversion favors CHF
SNB remains cautious, but CHF gains defensive strength in risk-off conditions
🎯 Trade Setup
Bias: Sell
Entry Zone: 1.1080–1.1100 (breakout confirmation)
Targets:
TP1: 1.0940
TP2: 1.0815
TP3: 1.0608 (extension target)
Stop Loss: Above 1.1150
⚠️ Risk Factors
CPI surprise tomorrow could cause GBP spikes — be cautious around the release
If equities rally hard or CHF weakens globally, price could retest the wedge structure before falling
BoE hawkish surprise could challenge short-term bearish bias
🧭 Conclusion
GBP/CHF has broken out of a rising wedge — a classic bearish reversal signal. The technical break aligns with macro weakness in GBP and CHF strength in a risk-off environment. Short trades remain valid below 1.1150, targeting a drop to 1.0940 and 1.0815 in the coming sessions.

GBPNZD Important Resistance and SupportThe pair is heading towards the resistance at 2.363, which has not been tested by the sellers, so there are still many sellers waiting in this area. The uptrend could extend to 2.276, the highest peak of last month.
If the resistance at 2.263 cannot be broken, then 2.238 is the sideway border of the pair, which helps support the price increase. When it breaks out, it confirms a reversal to the downtrend.
The price reaction zone can be noted around 2.229 before touching the strong support zone at 2.220.
Support: 2.238, 2.229, 2.220
Resistance: 2.263, 2.276

AUD/USD at Critical Resistance — Bearish Outlook Below 0.65381. Major Resistance Zone: 0.65380
Price is currently testing a strong horizontal resistance level at 0.65380, a level that has been tested multiple times (as shown by the pink circles).
This level has acted as a historical turning point, which increases its significance.
2. Price Structure: Lower Highs and Equal Highs
The chart reveals a potential double top or distribution pattern, forming under the 0.65380 resistance.
This suggests weakening bullish momentum and increases the probability of a bearish reversal.
3. Projected Bearish Path (White Dotted Lines):
If price fails to break above 0.65380 decisively, the expected move is a stepwise decline.
The projected path targets several support levels:
0.65003
0.64647
0.64213
0.63957
Final target: 0.63627, a key support from early May.
4. Support & Resistance Zones:
Resistance Levels:
0.65380 (Major)
0.65003
Support Levels (Sequential Targets):
0.64647
0.64213
0.63957
0.63627
5. Confluence with Fundamentals:
U.S. economic events (highlighted at the bottom with calendar icons) may act as volatility triggers, potentially accelerating this move.
✅ Summary & Trading Implications:
Bias: Bearish below 0.65380
Trade Idea: Watch for rejection at resistance or break below 0.65003 for confirmation.
Bearish Targets: Gradual move toward 0.63627 with key pauses at intermediate support levels.
Invalidation: Daily close above 0.65380 would negate the bearish setup and open potential for new highs.

USOIL || Geopolitical Spike Hits Major Resistance - Watch $77.77🛢️
📅 June 13, 2025
👤 By: MJTRADING
🔍 🧭 Fundamental Context – Risk Premium on the Rise:
Crude oil surged sharply today following reports of Israeli airstrikes on Iranian territory — a move that reawakens fears of broader Middle East escalation. Iran plays a crucial role in OPEC and controls the strategic Strait of Hormuz , through which ~20% of global oil passes.
While Iran has not officially responded yet, markets are pricing in the potential for:
* Military retaliation
* Disruption of oil exports or maritime routes
* Heightened volatility across global risk assets
=======================================================
📉 📊 Technical Structure – Tag of Key Resistance at $77.7:
Price exploded upward, piercing the descending channel that's been intact since mid-2022.
Today's daily wick tagged the $77.70 level, a major horizontal resistance and channel top.
This zone has repeatedly acted as a pivot in both bullish and bearish phases.
Volume confirmed the move – highest daily volume in months, suggesting institutional reaction.
💡 Trading Outlook:
🔼 Scenario A – Breakout & Close Above $77.7 = Bull Continuation
If tomorrow closes firmly above $77.70:
Target 1: $88.88 supply zone
Target 2: $90.00 psychological resistance
Setup: Conservative entries on retest of $75–77 area with tight invalidation
🔽 Scenario B – Failed Breakout → Fade Back Inside Channel
If this was a headline-driven spike with no follow-through, bears may re-enter strongly
A close below $75 could confirm bull trap
Support zone to watch: $66.66 (mid-channel, EMA confluence)
⚠️ Risk Factors to Monitor:
Iran’s response (military, diplomatic, strategic)
US/NATO reaction to potential escalation
Strait of Hormuz disruption
OPEC commentary or Saudi-led output adjustment
Market sentiment unwind (profit-taking from overbought spike)
💬 Markets love emotion, but traders survive with structure. This is not the time to be reckless — size down, be responsive, and respect both breakouts and fakeouts.
📎 #CrudeOil #Geopolitics #OilSpike #WTI #MiddleEastTensions #Iran #IranIsrael #TechnicalAnalysis #MJTRADING

USDCAD Hits Support as Fed-Hawkish & BoC Cuts! Big Bounce ComingUSDCAD ( OANDA:USDCAD ) is trading at the Potential Reversal Zone(PRZ) and near the important Support line and Support lines .
In terms of Elliott Wave theory , it seems that USDCAD has managed to complete 5 main down waves and we can expect more up waves .
Also, we can see the Regular Divergence(RD+) between Consecutive Valleys .
I expect USDCAD to rise to at least 1.37860 CAD.
Fundamental View:
The Bank of Canada initiated its rate-cutting cycle , while the Federal Reserve remains firm with no immediate plans to ease.
Strong NFP data on Friday reinforced USD ( TVC:DXY ) strength .
Oil prices( BLACKBULL:BRENT ) may offer temporary support to CAD , but macro divergences clearly favor the dollar .
Note: Stop Loss(SL)= 1.36110 CAD
U.S Dollar/Canadian Dollar Analyze (USDCAD), 4-hour time frame.
Be sure to follow the updated ideas.
Do not forget to put a Stop loss for your positions (For every position you want to open).
Please follow your strategy; this is just my idea, and I will gladly see your ideas in this post.
Please do not forget the ✅' like '✅ button 🙏😊 & Share it with your friends; thanks, and Trade safe.

Inverse H&S Breakout! EURGBP Eyes Resistance Zone Amid Eurozone EURGBP ( OANDA:EURGBP ) is moving between two Support zone(0.83870 GBP-0.83500 GBP) and Resistance zone(0.8511 GBP-0.8470 GBP) .
In terms of Classic Technical Analysis , EURGBP has managed to break the Neckline of the Inverse Head and Shoulders Pattern .
I expect EURGBP to rise to at least 0.84911 GBP and attack the Resistance zone(0.8511 GBP- 0.8470 GBP) .
-----------------------------------------------------------
EURGBP Fundamental Analysis:
1. Eurozone (EUR) Overview :
The Eurozone economy has shown moderate recovery signs after pandemic disruptions.
Inflation remains a concern, but the European Central Bank (ECB) is expected to maintain or even tighten monetary policy gradually to combat inflation.
Economic data such as GDP growth and industrial production are mixed but generally indicate slow growth.
Political stability in the Eurozone is relatively steady compared to the UK.
The ECB’s forward guidance leans towards cautious optimism, supporting EUR strength over time.
2. United Kingdom (GBP) Overview :
The UK economy faces several challenges, including slower growth prospects compared to the Eurozone.
Inflation has been high but the Bank of England (BoE) has been raising interest rates aggressively to control it.
Political uncertainties related to Brexit aftermath, trade deals, and fiscal policies have created some volatility.
Consumer confidence and retail sales have shown signs of weakness in recent months.
Overall, the BoE’s hawkish stance is strong, but economic fundamentals are less robust compared to the Eurozone.
3. Comparative Factors Favoring EUR Long :
The Eurozone's relatively better economic stability and growth prospects support EUR strength.
UK economic challenges and political uncertainties weaken GBP.
ECB’s more gradual tightening approach may prevent shocks, making EUR attractive.
Brexit-related trade issues continue to pose risks for GBP.
4. Risks to Consider :
Unexpected ECB dovish moves could weaken EUR.
Positive UK economic surprises or faster-than-expected BoE tightening might strengthen GBP.
External shocks like geopolitical tensions can affect risk sentiment, impacting both currencies.
-----------------------------------------------------------
Note: Stop Loss(SL)= 0.84221 GBP
Euro/British Pound Analyze (EURGBP), 4-hour time frame.
Be sure to follow the updated ideas.
Do not forget to put a Stop loss for your positions (For every position you want to open).
Please follow your strategy; this is just my idea, and I will gladly see your ideas in this post.
Please do not forget the ✅' like '✅ button 🙏😊 & Share it with your friends; thanks, and Trade safe.

GBPUSDHello Traders! 👋
What are your thoughts on GBPUSD?
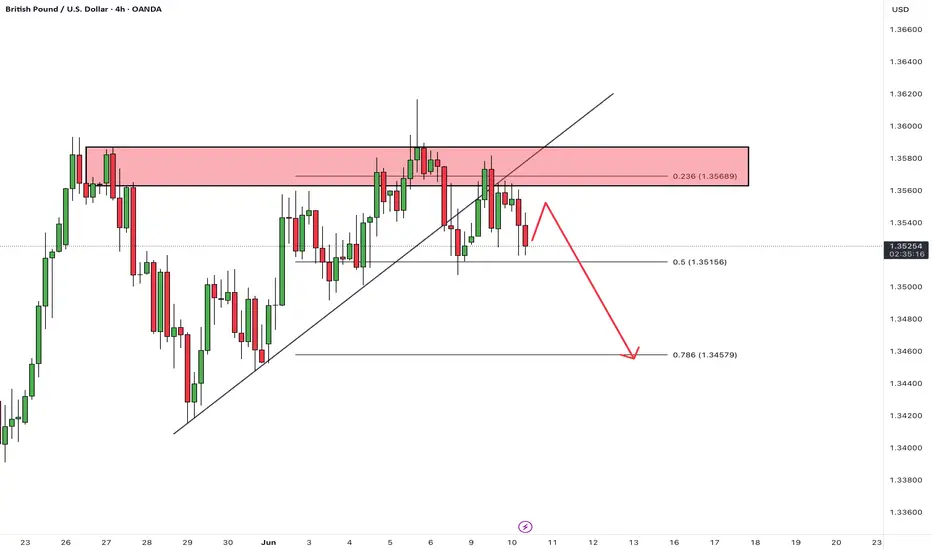
On the 4-hour timeframe, GBPUSD has broken below its ascending trendline and is now trading below a key resistance zone.
We expect the pair to consolidate briefly within this area, and then move lower toward the specified support level.
As long as the price remains below the resistance and the broken trendline, the bearish bias remains valid.
Don’t forget to like and share your thoughts in the comments! ❤️
EURGBP forex rallying as expected off weekly demand levelWeekly uptrend. Weekly demand imbalance at 0.83 is still in control and trying to play out as expected. Any swing long positions should be managed. I hope you could take advantage of long positions using the smaller timeframes for those intraday and short-term forex traders.

Market next move Bearish Disruption Analysis:
1. False Breakout Risk:
The current price is consolidating in a tight range.
The support area may fail to hold due to low volume and indecision (notice the decreasing volume in recent candles).
2. Lower High Formation:
A potential lower high is forming compared to the peak from earlier on June 5.
This could signal a trend reversal or weakening bullish momentum.
3. Volume Divergence:
The bullish candles have lower volume than previous strong moves, indicating a lack of strong buying interest.
4. Support Breakdown Scenario:
If price breaks below the marked support area (~3360), we could see:
Drop toward the 3340 area (next visible support).
Acceleration if stop-losses are triggered below the support zone.
GBPUSD reaches resistance zone: Watching for potential reversalOANDA:GBPJPY has reached a pretty significant resistance level, that has been an obvious turning point in the past, with several strong reversals from the area. So naturally, I’m watching to see how price reacts here again.
If we get confirmation of rejection (what I usually watch for: like a bearish engulfing candle, long upper wicks or signs of increased selling pressure), I’ll be looking for short setups from there.
🟥 My sell idea is based on the expectation that this resistance will hold. I would be targeting a move down toward the 192.000 level, which I feel is a realistic and clean target, especially if price respects this structure again.
But if price breaks above and starts holding strong above the zone, then I’ll back off the bearish bias and reassess, and I’d consider the bearish idea invalidated, with potential for further upside 🚀
Just sharing how I see the chart right now, not financial advice 💕✨

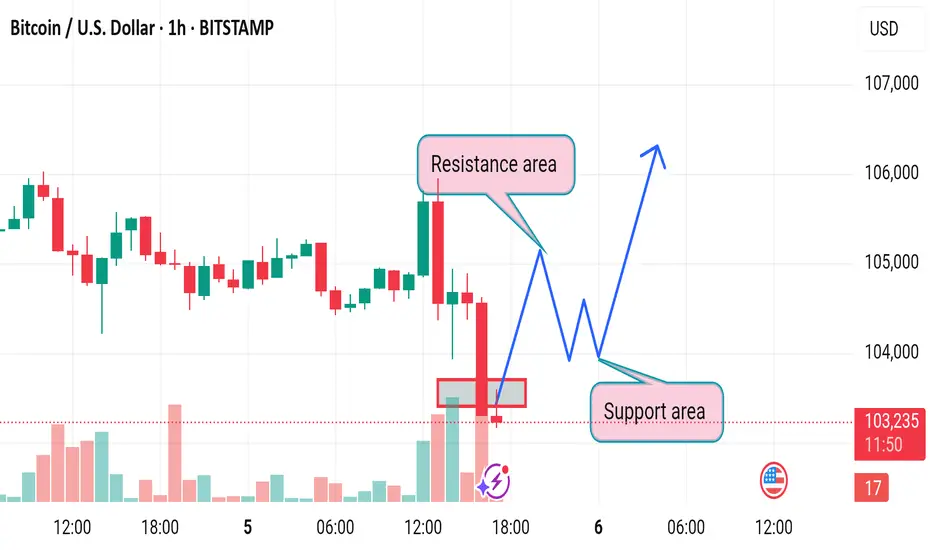
Market next move 🔍 Original Interpretation:
Support Zone: The red rectangle suggests a support level between ~102,800 and ~103,300.
Bullish Bias: The blue arrow anticipates a bounce from this zone, potentially forming a higher low before continuing upward.
Bearish Bias: The red arrow marks a potential resistance, predicting rejection and a move lower if the bullish breakout fails.
---
⚠️ Disruptive Analysis:
1. False Support Breakout Risk:
A false breakdown beneath the support zone could trigger panic selling before a rapid recovery (fakeout).
Traders might place stop-losses just below the box — a perfect target for market makers before price reverses.
2. Volume Deception:
Volume increased during the sell-off but did not show strong absorption by buyers (green volume wasn't dominant).
This suggests sellers still dominate and a continuation lower could occur before any bounce.
3. Lower Highs Formation:
The last few green candles failed to break the previous highs, indicating weaker buying strength.
Price may form a lower high, hinting at a short-term bearish trend.
4. Macro Trend Consideration:
If this is just a retracement within a larger downtrend, the bounce could be short-lived.
Broader market sentiment or macro news could push BTC toward 100,000 support or lower.
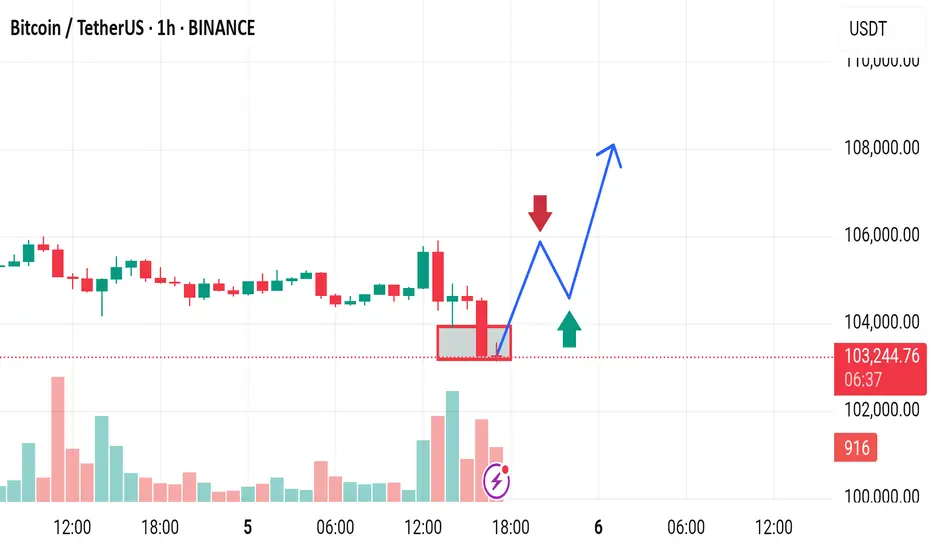
Market next move Disruptive Bearish Scenarios:
1. Support Area Breakdown
The recent strong bearish candle with high volume shows aggressive selling pressure.
If the price fails to hold above the support area and closes below it, especially on high volume, it could invalidate the bullish recovery.
> Bearish Alternative: Price breaks below 103,000, retests it as resistance (bearish flip), and continues down toward 101,000–100,000.
---
2. Lower High Trap
The projected bounce could form a lower high below the 106,000 resistance, creating a classic bearish structure.
> Disruption Path: After a minor recovery toward 104,500–105,000, sellers regain control, and BTC resumes the downtrend.
---
3. Fake Support Bounce
The support area could create a fake-out bounce, tricking long traders before a sharper reversal.
The move up may lack follow-through due to diminishing bullish volume.
Market next move Disruption Points:
1. Bullish Accumulation Underway
The recent candles show higher lows and lower volume on red candles, suggesting selling pressure is decreasing.
> Disruptive scenario: Price may bounce off minor support (around 1.3560–1.3570) and form a higher low, triggering a bullish rally back above 1.3620.
---
2. Fake Bearish Setup (Liquidity Trap)
The three arrows predicting a drop might represent a classic retail trap where too many anticipate the same direction.
> Contrary idea: A false breakdown below 1.3550 may occur just to collect stop-losses, followed by a strong reversal upward.
---
3. Divergence Risk
If momentum indicators (e.g., RSI, MACD) show bullish divergence while price moves sideways or dips, it may signal an upcoming bullish impulse.
> Disruption: Downward arrows may be misinterpreting consolidation as weakness rather than a setup for continuation of the previous uptrend.
---
4. Fundamental Wildcard
The chart shows an upcoming U.S. economic event, likely to impact the dollar.
If the data is weak for the USD, GBP/USD could surge sharply, invalidating the bearish scenario.

Market next target 🧨 Disruption Points:
1. Bullish Accumulation Underway
The recent candles show higher lows and lower volume on red candles, suggesting selling pressure is decreasing.
> Disruptive scenario: Price may bounce off minor support (around 1.3560–1.3570) and form a higher low, triggering a bullish rally back above 1.3620.
---
2. Fake Bearish Setup (Liquidity Trap)
The three arrows predicting a drop might represent a classic retail trap where too many anticipate the same direction.
> Contrary idea: A false breakdown below 1.3550 may occur just to collect stop-losses, followed by a strong reversal upward.
---
3. Divergence Risk
If momentum indicators (e.g., RSI, MACD) show bullish divergence while price moves sideways or dips, it may signal an upcoming bullish impulse.
> Disruption: Downward arrows may be misinterpreting consolidation as weakness rather than a setup for continuation of the previous uptrend.
---
4. Fundamental Wildcard
The chart shows an upcoming U.S. economic event, likely to impact the dollar.
If the data is weak for the USD, GBP/USD could surge sharply, invalidating the bearish scenario.

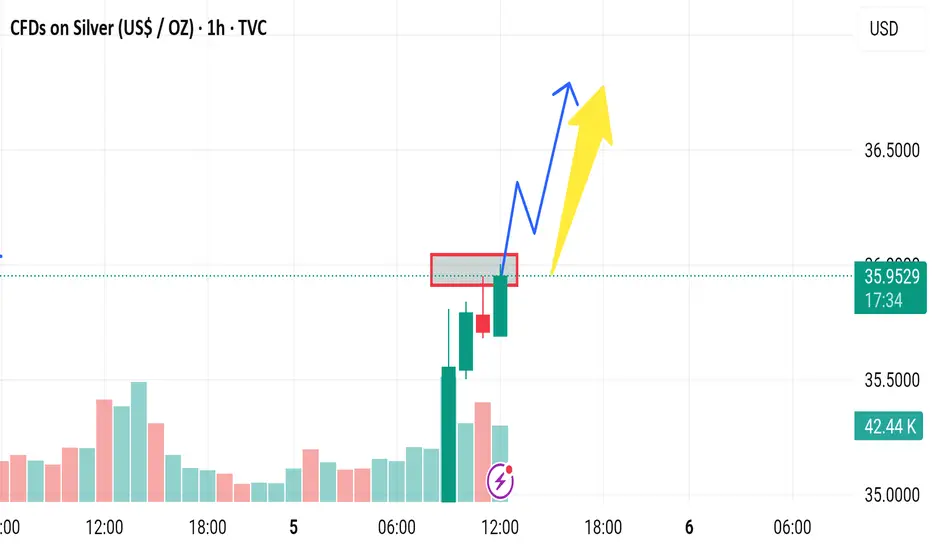
Market next target 🧨 Disruption Points:
1. Overbought Condition / RSI Divergence
Even though the price is surging (+3.30%), there could be an overbought condition forming.
If RSI or other momentum indicators (not shown here) diverge, it might signal weakness in bullish momentum.
> Disruptive idea: Price may fake the breakout (blue arrow) and then sharply reverse, trapping late buyers.
---
2. False Breakout Trap
The red-box area could be a liquidity zone where smart money might induce a fake breakout before dumping.
> Alternative path: Price breaks above temporarily (as in blue path), but then reverses violently back into the range, forming a “bull trap.”
---
3. Volume Anomaly
The volume appears to be decreasing on recent bullish candles after the initial spike.
This suggests that the uptrend may be losing strength, making the yellow arrow scenario less likely.
> Contrary outlook: Lack of volume confirmation could mean a sideways consolidation or reversal is more probable.
---
4. News/Event Risk (Fundamental Disruption)
The chart shows an upcoming economic event (U.S. flag icon), possibly Non-Farm Payrolls (NFP), interest rate news, or CPI.
These events could cause extreme volatility and invalidate all technical patterns.

Market next move 🧨 Disruption Points:
1. Overbought Condition / RSI Divergence
Even though the price is surging (+3.30%), there could be an overbought condition forming.
If RSI or other momentum indicators (not shown here) diverge, it might signal weakness in bullish momentum.
> Disruptive idea: Price may fake the breakout (blue arrow) and then sharply reverse, trapping late buyers.
---
2. False Breakout Trap
The red-box area could be a liquidity zone where smart money might induce a fake breakout before dumping.
> Alternative path: Price breaks above temporarily (as in blue path), but then reverses violently back into the range, forming a “bull trap.”
---
3. Volume Anomaly
The volume appears to be decreasing on recent bullish candles after the initial spike.
This suggests that the uptrend may be losing strength, making the yellow arrow scenario less likely.
> Contrary outlook: Lack of volume confirmation could mean a sideways consolidation or reversal is more probable.

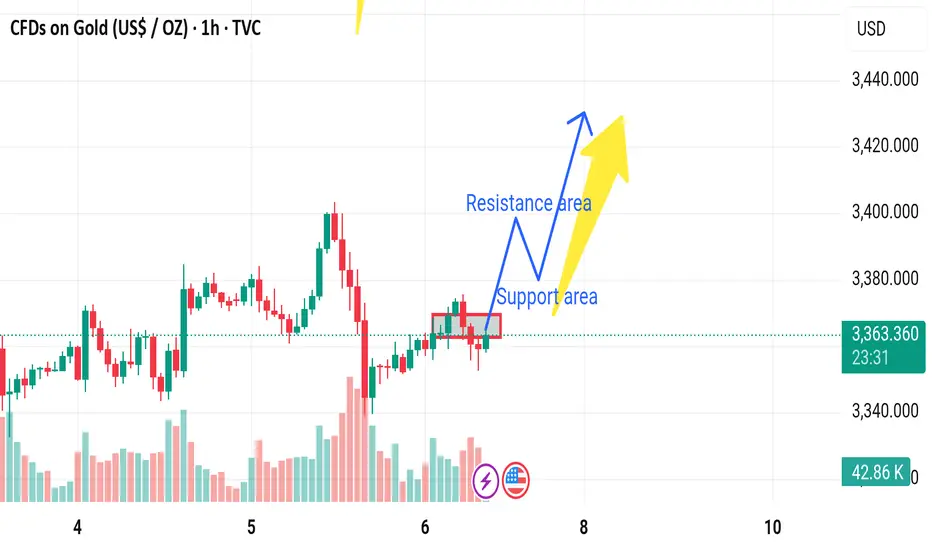
Market next move 🔍 Bearish Disruption Perspective
1. Supply Zone Rejection
The red box marks a strong resistance zone. Current price action shows rejection at that level (long upper wicks).
This signals that sellers are defending this zone, increasing the likelihood of a false breakout.
2. Exhaustion After Strong Rally
The massive green candle just before the resistance may have exhausted short-term buying power.
Without a clear consolidation or volume surge, the price could reverse or retrace to gather strength.
3. Volume Discrepancy
Volume spikes with price often suggest conviction. However, this chart shows moderate volume on the test of resistance—not enough to confirm breakout strength.
4. Bearish Candlestick Pattern
The small red candle following the green surge could be forming a bearish engulfing or rejection candle, depending on the close.
Market next move 🔍 Disruptive Technical Perspective
1. Overextension After Rally
The current sharp upward move may be overextended.
Lack of consolidation suggests the rally may be unsustainable without a pullback to test support.
2. Volume Divergence
While price is rising, the volume bar at the most recent candle is not increasing proportionally.
This signals weakening momentum, which often precedes a reversal or consolidation.
3. Unconfirmed Breakout
The chart doesn't clearly show a confirmed breakout above a significant resistance zone.
This could indicate a potential fakeout rather than a true breakout.
4. Potential Double Top Formation Risk
If price stalls near current levels and pulls back, a double top pattern might form—often a bearish reversal signal.
A drop back below $3,380 could trigger heavy selling.

Market next move 🔍 Disruptive Counter-Analysis
1. False Breakout Risk
The current breakout could be a bull trap. Price may break above the resistance level temporarily before reversing sharply.
Volume Analysis: The volume isn't significantly higher at the breakout candle, which may suggest a lack of strong momentum or institutional participation.
2. Resistance Zone Ahead
The 1.14500 to 1.15000 range is historically a supply zone, where sellers may aggressively enter the market.
This makes any upside move vulnerable to a reversal near that zone.
3. Macroeconomic Risk
A red-circled economic event icon appears on the chart (likely an ECB or Fed-related release). This adds uncertainty—news can invalidate technical patterns.
If the event is bearish for the euro (e.g., weak data or dovish ECB comments), the pair could reverse sharply.
4. Overbought Short-Term
A series of green candles without significant pullback suggests short-term overbought conditions.
RSI or other momentum indicators (not shown here) may confirm this. A correction to the previous base is possible.
