Forexsignals

DXY Short-term rebound quite likely.The U.S. Dollar index (DXY) has been trading within almost a 3-year Channel Down, which has assisted us in choosing the right levels to sell high and buy low.
Despite being now on its 2nd major Bearish Leg, we see a short-term bounce possibly up to August quite likely based on the previous major Bearish Leg. As you see, the current setup resembles the April 13 023 Low after which the price rebounded short-term just above the 0.786 Fibonacci level, only to get rejected later and complete the bottom on the 1.1 Fib extension.
Even the 1W RSI sequences between the two fractals are identical. Therefore, before diving below 96.000, we believe a 100.000 test is quite likely.
-------------------------------------------------------------------------------
** Please LIKE 👍, FOLLOW ✅, SHARE 🙌 and COMMENT ✍ if you enjoy this idea! Also share your ideas and charts in the comments section below! This is best way to keep it relevant, support us, keep the content here free and allow the idea to reach as many people as possible. **
-------------------------------------------------------------------------------
💸💸💸💸💸💸
👇 👇 👇 👇 👇 👇

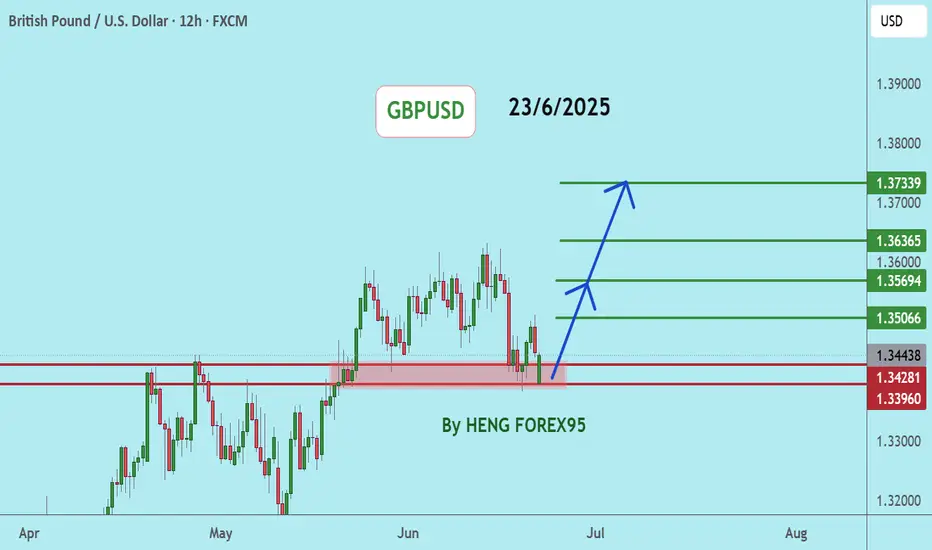
GBPUSDGBPUSD price is near the support zone 1.33917. If the price cannot break through 1.33917, it is expected that the price will have a chance to bounce back. Consider buying in the red zone.
🔥Trading futures, forex, CFDs and stocks carries a risk of loss.
Please consider carefully whether such trading is suitable for you.
>>GooD Luck 😊
❤️ Like and subscribe to never miss a new idea!
EURUSD Sell SetupBy: MJTrading:
EUR/USD has rallied into a significant resistance zone, approaching the upper boundary of a rising wedge/channel pattern. The price is now hovering around a key confluence zone, where trendline resistance and horizontal supply intersect ( 1.16300 —1.16500 )
There are to possible scenarios:
1) If the price Rejects directly from previous High
🔹 Position 1: Sell Stop @ 1.15915
🛑 Stop Loss: 1.6375
🎯 Take Profit: 1.5454
R/R:1
isk Level: Medium
2) If price tries to reach the boundary of the wedge or make a Fake breakout:
🔹🔹 Position 2: Sell Limit @ 1.16300
🛑 Stop Loss: 1.6930
🎯 Take Profit: 1.5000
R/R:2
Risk Level: Low
📌 This zone offers a high-probability reversal setup
📉 Why it Matters:
Price action shows signs of exhaustion after a parabolic move.
EMA structure is stretched, hinting at a potential pullback.
Lets ZOOM OUT:
Daily Chart:
ZOOM IN:
Stay disciplined, let price come to you, and manage risk.
—
#EURUSD #ForexSetup #TradingStrategy #TechnicalAnalysis #ChartPattern #FXTrading #ShortTrade #MJTrading #BearishReversal #PriceAction #SwingTrade #ForexIdeas #Trendlines #BreakoutOrFakeout #RiskReward

AUD/USD – Rejection at 2025 High?By: MJTrading
📉 AUD/USD – Rejection at 2025 High?
The Aussie is struggling at its 2025 high, printing successive lower highs (LH) and flirting with the 60-period EMA. With momentum leaning bearish, a short opportunity opens up near 0.64878, targeting the 0.64094 support zone. Confirmation from the EMA breakdown and rejection wicks strengthens the setup. Stop-loss above 0.65285 protects against a breakout trap.
Entry: 0.64883
Stop Loss: 0.65285
TP1: 0.64500
TP2: 0.64100
#Hashtags: #AUDUSD #ForexTrading #TechnicalAnalysis #ReversalSetup #BearishBias #LowerHighs #EMARejection #ShortThePop #PriceAction

Hellena | EUR/USD (4H): LONG to the resistance area 1.17300.Colleagues, I believe that the upward five-wave impulse is not over yet. At the moment, I see the formation of wave “3” of the lower order and wave “3” of the middle order, which means that the upward movement will continue at least to the resistance area of 1.17300. This area is located between two levels (1.16529-1.18252) of Fibonacci extension.
A correction is possible — be careful.
Manage your capital correctly and competently! Only enter trades based on reliable patterns!

Market next move Disruptive (Bearish) Scenarios:
1. False Breakout Risk
The recent bullish candles could be a bull trap.
Price may test the “support” trendline, fail to hold, and break downwards instead of continuing upward.
Watch for rejection near the target area or sharp sell-offs on high volume.
2. Overhead Resistance Zone
Price is approaching historical resistance near the $3,350–$3,355 area.
If it fails to close above this level on strong volume, it may reverse sharply.
3. Divergence Warning (Check RSI/MACD)
If you check oscillators like RSI or MACD, and they show bearish divergence (price makes higher highs, indicator makes lower highs), that could signal a weakening bullish momentum.
4. Volume Decline
The volume spikes on the recent bullish move, but volume drops afterward could indicate lack of buying interest to sustain the rally.
5. Fundamental Triggers
Any sudden macroeconomic news (e.g. strong USD data, interest rate hikes, geopolitical developments) could trigger a sharp selloff in gold, invalidating the bullish setup.

Falling towards major support?The Loonie (USD/CAD) is falling towards the pivot, which has been identified as an overlap support and could bounce to the 1st resistance.
Pivot: 1.3690
1st Support: 1.3667
1st Resistance: 1.3747
Risk Warning:
Trading Forex and CFDs carries a high level of risk to your capital and you should only trade with money you can afford to lose. Trading Forex and CFDs may not be suitable for all investors, so please ensure that you fully understand the risks involved and seek independent advice if necessary.
Disclaimer:
The above opinions given constitute general market commentary, and do not constitute the opinion or advice of IC Markets or any form of personal or investment advice.
Any opinions, news, research, analyses, prices, other information, or links to third-party sites contained on this website are provided on an "as-is" basis, are intended only to be informative, is not an advice nor a recommendation, nor research, or a record of our trading prices, or an offer of, or solicitation for a transaction in any financial instrument and thus should not be treated as such. The information provided does not involve any specific investment objectives, financial situation and needs of any specific person who may receive it. Please be aware, that past performance is not a reliable indicator of future performance and/or results. Past Performance or Forward-looking scenarios based upon the reasonable beliefs of the third-party provider are not a guarantee of future performance. Actual results may differ materially from those anticipated in forward-looking or past performance statements. IC Markets makes no representation or warranty and assumes no liability as to the accuracy or completeness of the information provided, nor any loss arising from any investment based on a recommendation, forecast or any information supplied by any third-party.

Bearish continuation?The Swissie (USD/CHF) has rejected off the pivot which has been identified as a pullback resistance and could drop to the 1st support.
Pivot: 0.8070
1st Support: 0.7962
1st Resistance: 0.8104
Risk Warning:
Trading Forex and CFDs carries a high level of risk to your capital and you should only trade with money you can afford to lose. Trading Forex and CFDs may not be suitable for all investors, so please ensure that you fully understand the risks involved and seek independent advice if necessary.
Disclaimer:
The above opinions given constitute general market commentary, and do not constitute the opinion or advice of IC Markets or any form of personal or investment advice.
Any opinions, news, research, analyses, prices, other information, or links to third-party sites contained on this website are provided on an "as-is" basis, are intended only to be informative, is not an advice nor a recommendation, nor research, or a record of our trading prices, or an offer of, or solicitation for a transaction in any financial instrument and thus should not be treated as such. The information provided does not involve any specific investment objectives, financial situation and needs of any specific person who may receive it. Please be aware, that past performance is not a reliable indicator of future performance and/or results. Past Performance or Forward-looking scenarios based upon the reasonable beliefs of the third-party provider are not a guarantee of future performance. Actual results may differ materially from those anticipated in forward-looking or past performance statements. IC Markets makes no representation or warranty and assumes no liability as to the accuracy or completeness of the information provided, nor any loss arising from any investment based on a recommendation, forecast or any information supplied by any third-party.

Could the price reverse from here?The Cable (GBP?USD) is reacting off the pivot and could reverse to the 1st support which acts as a pullback support.
Pivot: 1.3710
1st Support: 1.3620
1st Resistance: 1.3799
Risk Warning:
Trading Forex and CFDs carries a high level of risk to your capital and you should only trade with money you can afford to lose. Trading Forex and CFDs may not be suitable for all investors, so please ensure that you fully understand the risks involved and seek independent advice if necessary.
Disclaimer:
The above opinions given constitute general market commentary, and do not constitute the opinion or advice of IC Markets or any form of personal or investment advice.
Any opinions, news, research, analyses, prices, other information, or links to third-party sites contained on this website are provided on an "as-is" basis, are intended only to be informative, is not an advice nor a recommendation, nor research, or a record of our trading prices, or an offer of, or solicitation for a transaction in any financial instrument and thus should not be treated as such. The information provided does not involve any specific investment objectives, financial situation and needs of any specific person who may receive it. Please be aware, that past performance is not a reliable indicator of future performance and/or results. Past Performance or Forward-looking scenarios based upon the reasonable beliefs of the third-party provider are not a guarantee of future performance. Actual results may differ materially from those anticipated in forward-looking or past performance statements. IC Markets makes no representation or warranty and assumes no liability as to the accuracy or completeness of the information provided, nor any loss arising from any investment based on a recommendation, forecast or any information supplied by any third-party.

Bullish continuation for the Fiber?The price is falling towards the pivot point, which is a pullback support, and could bounce to the 1st resistance, which is also a pullback resistance.
Pivot: 1.1630
1st Support: 1.1591
1st Resistance: 1.1692
Risk Warning:
Trading Forex and CFDs carries a high level of risk to your capital and you should only trade with money you can afford to lose. Trading Forex and CFDs may not be suitable for all investors, so please ensure that you fully understand the risks involved and seek independent advice if necessary.
Disclaimer:
The above opinions given constitute general market commentary, and do not constitute the opinion or advice of IC Markets or any form of personal or investment advice.
Any opinions, news, research, analyses, prices, other information, or links to third-party sites contained on this website are provided on an "as-is" basis, are intended only to be informative, is not an advice nor a recommendation, nor research, or a record of our trading prices, or an offer of, or solicitation for a transaction in any financial instrument and thus should not be treated as such. The information provided does not involve any specific investment objectives, financial situation and needs of any specific person who may receive it. Please be aware, that past performance is not a reliable indicator of future performance and/or results. Past Performance or Forward-looking scenarios based upon the reasonable beliefs of the third-party provider are not a guarantee of future performance. Actual results may differ materially from those anticipated in forward-looking or past performance statements. IC Markets makes no representation or warranty and assumes no liability as to the accuracy or completeness of the information provided, nor any loss arising from any investment based on a recommendation, forecast or any information supplied by any third-party.

Potential bulllish reveresal?The US Dollar Index (DXY) is falling towards the pivot, which aligns with the Fibonacci confluence and could reverse to the 1st resistance.
Pivot: 97.08
1st Support: 96.44
1st Resistance: 98.10
Risk Warning:
Trading Forex and CFDs carries a high level of risk to your capital and you should only trade with money you can afford to lose. Trading Forex and CFDs may not be suitable for all investors, so please ensure that you fully understand the risks involved and seek independent advice if necessary.
Disclaimer:
The above opinions given constitute general market commentary, and do not constitute the opinion or advice of IC Markets or any form of personal or investment advice.
Any opinions, news, research, analyses, prices, other information, or links to third-party sites contained on this website are provided on an "as-is" basis, are intended only to be informative, is not an advice nor a recommendation, nor research, or a record of our trading prices, or an offer of, or solicitation for a transaction in any financial instrument and thus should not be treated as such. The information provided does not involve any specific investment objectives, financial situation and needs of any specific person who may receive it. Please be aware, that past performance is not a reliable indicator of future performance and/or results. Past Performance or Forward-looking scenarios based upon the reasonable beliefs of the third-party provider are not a guarantee of future performance. Actual results may differ materially from those anticipated in forward-looking or past performance statements. IC Markets makes no representation or warranty and assumes no liability as to the accuracy or completeness of the information provided, nor any loss arising from any investment based on a recommendation, forecast or any information supplied by any third-party.

Potential bullish rise?EUR/NZD has bounced off the support level which is a pullback support that aligns with the 38.2% Fibonacci retracement and could rise from this level to our take profit.
Entry: 1.92267
Why we like it:
There is a pullback support level that lines up with the 38.2% Fibonacci retracement.
Stop loss: 1.91362
Why we like it:
There is a pullback support level that lines up with the 50% Fibonacci retracement.
Take profit: 1.94477
Why we like it:
There is a pullback resistance level.
Enjoying your TradingView experience? Review us!
Please be advised that the information presented on TradingView is provided to Vantage (‘Vantage Global Limited’, ‘we’) by a third-party provider (‘Everest Fortune Group’). Please be reminded that you are solely responsible for the trading decisions on your account. There is a very high degree of risk involved in trading. Any information and/or content is intended entirely for research, educational and informational purposes only and does not constitute investment or consultation advice or investment strategy. The information is not tailored to the investment needs of any specific person and therefore does not involve a consideration of any of the investment objectives, financial situation or needs of any viewer that may receive it. Kindly also note that past performance is not a reliable indicator of future results. Actual results may differ materially from those anticipated in forward-looking or past performance statements. We assume no liability as to the accuracy or completeness of any of the information and/or content provided herein and the Company cannot be held responsible for any omission, mistake nor for any loss or damage including without limitation to any loss of profit which may arise from reliance on any information supplied by Everest Fortune Group.

Bullish bounce off overlap support?EUR/GBP is reacting off the support level which is an overlap support that lines up with the 23.6% Fibonacci retracement and could rise from this level to our take profit.
Entry: 0.8515
Why we like it:
There is an overlap support level that aligns with the 23.6% Fibonacci retracement.
Stop loss: 0.8482
Why we like it:
There is a pullback support level that is slightly below the 38.2% Fibonacci retracement.
Take profit: 0.8575
Why we like it:
There is a pullback resistance level.
Enjoying your TradingView experience? Review us!
Please be advised that the information presented on TradingView is provided to Vantage (‘Vantage Global Limited’, ‘we’) by a third-party provider (‘Everest Fortune Group’). Please be reminded that you are solely responsible for the trading decisions on your account. There is a very high degree of risk involved in trading. Any information and/or content is intended entirely for research, educational and informational purposes only and does not constitute investment or consultation advice or investment strategy. The information is not tailored to the investment needs of any specific person and therefore does not involve a consideration of any of the investment objectives, financial situation or needs of any viewer that may receive it. Kindly also note that past performance is not a reliable indicator of future results. Actual results may differ materially from those anticipated in forward-looking or past performance statements. We assume no liability as to the accuracy or completeness of any of the information and/or content provided herein and the Company cannot be held responsible for any omission, mistake nor for any loss or damage including without limitation to any loss of profit which may arise from reliance on any information supplied by Everest Fortune Group.

Bullish momentum to extend?AUD/CAD has bounced off the support level which is a pullback support and could potentially rise from this level to our take profit.
Entry: 0.89033
Why we like it:
There is a pullback support level.
Stop loss: 0.8858
Why we like it:
There is a pullback support level.
Take profit: 0.9009
Why we like it:
There is a pullback resistance that is slightly below the 161.8% Fibonacci extension.
Enjoying your TradingView experience? Review us!
Please be advised that the information presented on TradingView is provided to Vantage (‘Vantage Global Limited’, ‘we’) by a third-party provider (‘Everest Fortune Group’). Please be reminded that you are solely responsible for the trading decisions on your account. There is a very high degree of risk involved in trading. Any information and/or content is intended entirely for research, educational and informational purposes only and does not constitute investment or consultation advice or investment strategy. The information is not tailored to the investment needs of any specific person and therefore does not involve a consideration of any of the investment objectives, financial situation or needs of any viewer that may receive it. Kindly also note that past performance is not a reliable indicator of future results. Actual results may differ materially from those anticipated in forward-looking or past performance statements. We assume no liability as to the accuracy or completeness of any of the information and/or content provided herein and the Company cannot be held responsible for any omission, mistake nor for any loss or damage including without limitation to any loss of profit which may arise from reliance on any information supplied by Everest Fortune Group.

Bullish bounce?NZD/JPY is falling towards the support level which is a pullback support that lines up with the 23.6% Fibonacci retracement and could bounce from this level to our take profit.
Entry: 87.562
Why we like it:
There is a pullback support level that aligns with the 23.6% Fibonacci retracement.
Stop loss: 87.34
Why we like it:
There is a pullback support that aligns with the 50% Fibonacci retracement.
Take profit: 87.98
Why we like it:
There is a pullback resistance level that lines up with the 145% Fibonacci extension.
Enjoying your TradingView experience? Review us!
Please be advised that the information presented on TradingView is provided to Vantage (‘Vantage Global Limited’, ‘we’) by a third-party provider (‘Everest Fortune Group’). Please be reminded that you are solely responsible for the trading decisions on your account. There is a very high degree of risk involved in trading. Any information and/or content is intended entirely for research, educational and informational purposes only and does not constitute investment or consultation advice or investment strategy. The information is not tailored to the investment needs of any specific person and therefore does not involve a consideration of any of the investment objectives, financial situation or needs of any viewer that may receive it. Kindly also note that past performance is not a reliable indicator of future results. Actual results may differ materially from those anticipated in forward-looking or past performance statements. We assume no liability as to the accuracy or completeness of any of the information and/or content provided herein and the Company cannot be held responsible for any omission, mistake nor for any loss or damage including without limitation to any loss of profit which may arise from reliance on any information supplied by Everest Fortune Group.

Market next move 🔻 Bearish Disruption Analysis
1. False Breakout / Bull Trap
The price might briefly break above the red resistance zone (highlighted), triggering buy orders.
However, instead of continuing higher, sellers step in aggressively, pushing the price back below resistance.
This would form a fakeout or bull trap, catching breakout buyers off-guard.
2. Volume Divergence
Look at the volume at the breakout: if the breakout occurs on declining or weak volume, it's a warning sign that the move lacks conviction.
The breakout may not sustain without strong volume backing it.
3. Lower High Formation
If the price fails to make a higher high above the previous peak (~3,340-3,345), and reverses downward, it indicates buying exhaustion.
4. MACRO/FUNDAMENTAL Trigger
Sudden news (e.g., strong USD data, interest rate hike comments from the Fed, or geopolitical tension easing) could cause a sharp sell-off in gold.
This would invalidate the bullish pattern entirely.
5. Bearish Price Target
If the disruption plays out, price could drop back to 3,300 or below, especially if support is weak.
A confirmed lower low below 3,310 would suggest a larger bearish structure

GOLDCurrently on a buy trade on Gold but we also have 2 supply levels above as our POI where we could be watching closely for sell opportunities. Personally, i prefer the extreme POI because it has FVG right below it which i expect to be filled up so my bias on GOLD is buy to sell.

Edge of the Wedge || GBPJPY
Simply Breakout and retest of the Edge of the Wedge
Entry: 198
Tp1: 200
TP2: 202
TP3: 204
SL: 196
A classic trend following setup

Gold Trading Strategy June 25The Daily Candle shows a strong selling force breaking out of the 3-day accumulation zone. Gold touches the support zone of 3296 and bounces back as analyzed yesterday. Today, it is difficult for the bullish force to return, there is a possibility of an increase in the Asian session and the European session, and the US session will return with the Selling force.
The recovery from 3296 towards 3342, some selling force may appear around 3342, forming a strong bearish structure. The bearish wave structure will weaken if it breaks 3342. The 3363 area still has a reaction but the bearish wave structure is no longer strong.
The market closed above 3363 confirming the downtrend break and heading towards the resistance zone of 3388. The bottom support of 3302 will help to temporarily stop the price decline before heading towards the target of 3278.
Support: 3321-3302-3278
Resistance: 3342-3363-3388
Break out: 3342-3322
Recommended trading signal
BUY GOLD 3302-3300 SL 3297
SELL GOLD 3363-3365 SL 3369

EURJPY: Bullish Trend Continues 🇪🇺🇯🇵
EURJPY shows a strength after a test of a significant demand zone.
Bullish breakout of a resistance line of a flag pattern provides
a strong trend-following signal.
Goal - 169.64
❤️Please, support my work with like, thank you!❤️
I am part of Trade Nation's Influencer program and receive a monthly fee for using their TradingView charts in my analysis.

EURCHF: Bearish Continuation After Breakout 🇪🇺🇨🇭
EURCHF violated a significant horizontal support.
Retesting that, a bearish flag pattern was formed.
Its support violation provides a strong intraday confirmation.
The pair may drop lower at least to 0.9328
❤️Please, support my work with like, thank you!❤️
I am part of Trade Nation's Influencer program and receive a monthly fee for using their TradingView charts in my analysis.

Bullish bounce off pullback support?The Loonie (USD/CAD) has bounced of the pivot and could rise to the 1st resistance which acts as a pullback resistance.
Pivot: 1.3674
1st Support: 1.3599
1st Resistance: 1.3793
Risk Warning:
Trading Forex and CFDs carries a high level of risk to your capital and you should only trade with money you can afford to lose. Trading Forex and CFDs may not be suitable for all investors, so please ensure that you fully understand the risks involved and seek independent advice if necessary.
Disclaimer:
The above opinions given constitute general market commentary, and do not constitute the opinion or advice of IC Markets or any form of personal or investment advice.
Any opinions, news, research, analyses, prices, other information, or links to third-party sites contained on this website are provided on an "as-is" basis, are intended only to be informative, is not an advice nor a recommendation, nor research, or a record of our trading prices, or an offer of, or solicitation for a transaction in any financial instrument and thus should not be treated as such. The information provided does not involve any specific investment objectives, financial situation and needs of any specific person who may receive it. Please be aware, that past performance is not a reliable indicator of future performance and/or results. Past Performance or Forward-looking scenarios based upon the reasonable beliefs of the third-party provider are not a guarantee of future performance. Actual results may differ materially from those anticipated in forward-looking or past performance statements. IC Markets makes no representation or warranty and assumes no liability as to the accuracy or completeness of the information provided, nor any loss arising from any investment based on a recommendation, forecast or any information supplied by any third-party.
