Market next move ⚠️ Disruption Analysis of the Chart
1. False Breakout Risk
The price is currently within an ascending channel, which is often seen as bullish.
However, the recent candlesticks show smaller bodies with wicks on top, indicating buyer exhaustion.
A false breakout above the upper trendline or support around 1.3632 could trap buyers before a sharp reversal.
2. Low Volume Confirmation
Volume peaked earlier but has significantly decreased in the last few candles.
Weak volume during a price rise signals a lack of conviction, increasing the likelihood of a pullback.
3. Resistance Flip Not Confirmed
The level around 1.3600 is marked as resistance-turned-support, but there is no strong retest confirmation yet.
If price revisits this zone and fails to bounce, this support could break, leading to a downside reversal.
4. Divergence Watch
While not visible in this static image, if you overlay RSI or MACD, there could be signs of bearish divergence (price making higher highs while momentum indicators make lower highs).
This is often a leading indicator of trend weakening.
Forexsignals

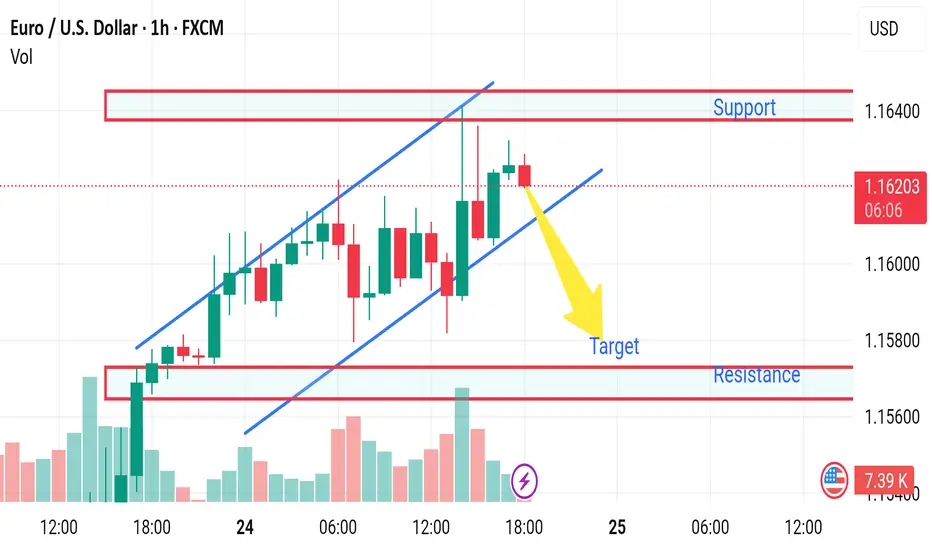
Market next target 🔁 Disrupted Analysis (Bullish Scenario Instead of Bearish)
1. Price in an Upward Channel:
The price remains within a clear ascending channel, respecting both upper and lower bounds.
The bearish arrow prematurely predicts a breakdown while no support break has occurred.
2. Strong Bullish Momentum:
Price is making higher highs and higher lows, a textbook bullish structure.
The recent dip respected the lower trendline and was followed by strong green candles.
3. Volume Confirmation:
Notice the increasing bullish volume on the recent push higher.
That suggests buyers are still in control, contradicting the bearish prediction.
4. Invalidation of Bearish Breakdown:
Until the lower blue trendline is clearly broken with volume, the bearish target is speculative.
Support is holding at 1.1610–1.1600 zone, which may become a launchpad for further gains.
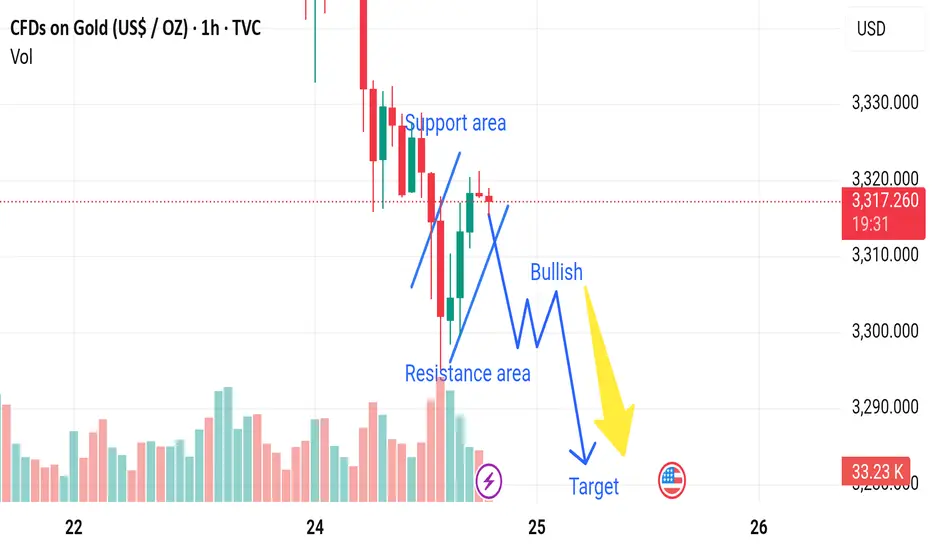
Market next move 🔁 Disrupted Analysis (Bullish Scenario Instead of Bearish)
1. Support Holding Firm:
The analysis assumes the price will drop after failing resistance, but the current price action is showing higher lows, suggesting accumulation.
The support area has been tested multiple times, showing strength.
2. Volume Analysis Contradiction:
Recent green volume bars indicate buying interest at lower levels.
No significant volume spike on the last downward leg, suggesting lack of strong selling pressure.
3. Potential Inverted Head and Shoulders:
The current formation could be the right shoulder of an inverted head and shoulders pattern, a classic bullish reversal setup.
If confirmed, this could lead to a breakout above the resistance area, not a drop.
4. Trendline Breakout Watch:
There's a potential bullish breakout of the descending trendline.
A break above 3,320 USD could invalidate the bearish thesis and suggest a target near 3,340–3,350 USD.

EUR/CHF Channel Breakdown – Bearish MomentumThe EUR/CHF pair has broken down from a well-defined ascending parallel channel, indicating a shift in market structure and a possible continuation to the downside. The price had been consistently respecting the resistance zone near 0.9435–0.9440 (marked in red) and the support zone near 0.9375–0.9380 (marked in green), forming an upward-sloping consolidation channel.
After multiple rejections at the upper resistance, the price decisively broke below the support line with strong bearish momentum, confirming a bearish breakout from the channel.
🔻 Breakdown Implication
The height of the channel—measured from the support to the resistance—has been used to project the next potential downside target. The projected breakdown target is marked near 0.9309, which aligns with historical price reaction zones and provides a clean structure-based price objective.
This suggests the bearish move could extend further in the coming sessions unless the price quickly recovers and climbs back above the broken support, which would invalidate the breakdown structure.
🧠 Trading Outlook
Bias: Bearish after confirmed breakdown from channel
Entry (if not in already): Consider selling on retest of broken support (~0.9375)
Target: 0.9309 (based on channel height)
Stop Loss: Above 0.9390–0.9400 (above breakdown point)
This setup is ideal for momentum traders looking to capitalize on trend continuation after a failed bullish structure.
=================================================================
Disclosure: I am part of Trade Nation's Influencer program and receive a monthly fee for using their TradingView charts in my analysis.
=================================================================

Market next target 🔁 Disrupted Analysis (Bullish Scenario Instead of Bearish)
1. Support Holding Firm:
The analysis assumes the price will drop after failing resistance, but the current price action is showing higher lows, suggesting accumulation.
The support area has been tested multiple times, showing strength.
2. Volume Analysis Contradiction:
Recent green volume bars indicate buying interest at lower levels.
No significant volume spike on the last downward leg, suggesting lack of strong selling pressure.
3. Potential Inverted Head and Shoulders:
The current formation could be the right shoulder of an inverted head and shoulders pattern, a classic bullish reversal setup.
If confirmed, this could lead to a breakout above the resistance area, not a drop.
4. Trendline Breakout Watch:
There's a potential bullish breakout of the descending trendline.
A break above 3,320 USD could invalidate the bearish thesis and suggest a target near 3,340–3,350 USD.
Bearish reversal off pullback resistance?NZD/USD is reacting off the reistance level which is a pullback resistance that lines up with the 127.2% Fibonacci extension and the 78.6% Fibonacci retracement and could drop from this level to our take profit.
Entry: 0.6039
Why we like it:
There is a pullback resistance level that lines up with the 78.6% Fibonacci retracement and the 127.2% Fibonacci extension.
Stop loss: 0.6060
Why we like it:
There is a pullback resistance level that is slightly below the 161.8% Fibonacci extension.
Take profit: 0.5966
Why we like it:
There is a pullback support that lines up with the 50% Fibonacci retracement.
Enjoying your TradingView experience? Review us!
Please be advised that the information presented on TradingView is provided to Vantage (‘Vantage Global Limited’, ‘we’) by a third-party provider (‘Everest Fortune Group’). Please be reminded that you are solely responsible for the trading decisions on your account. There is a very high degree of risk involved in trading. Any information and/or content is intended entirely for research, educational and informational purposes only and does not constitute investment or consultation advice or investment strategy. The information is not tailored to the investment needs of any specific person and therefore does not involve a consideration of any of the investment objectives, financial situation or needs of any viewer that may receive it. Kindly also note that past performance is not a reliable indicator of future results. Actual results may differ materially from those anticipated in forward-looking or past performance statements. We assume no liability as to the accuracy or completeness of any of the information and/or content provided herein and the Company cannot be held responsible for any omission, mistake nor for any loss or damage including without limitation to any loss of profit which may arise from reliance on any information supplied by Everest Fortune Group.

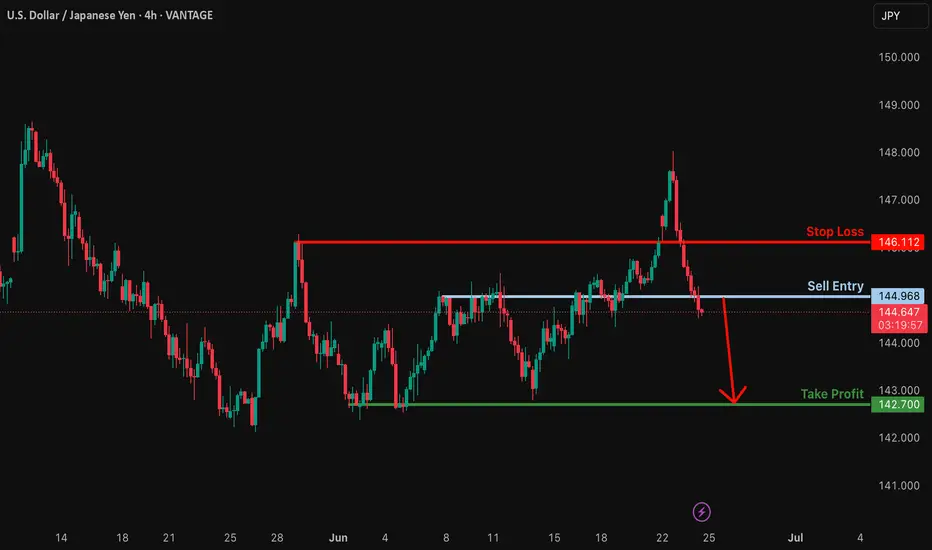
Potential bearish drop?USD/JPY is reacted off the support level which is an overlap support and could drop from this level to our tak eprofit.
Entry: 144.96
Why we like it:
There is an overlap support level.
Stop loss: 146.11
Why we like it:
There is a pullback resistance level.
Take profit: 142.70
Why we like it:
There is a pullback support level.
Enjoying your TradingView experience? Review us!
Please be advised that the information presented on TradingView is provided to Vantage (‘Vantage Global Limited’, ‘we’) by a third-party provider (‘Everest Fortune Group’). Please be reminded that you are solely responsible for the trading decisions on your account. There is a very high degree of risk involved in trading. Any information and/or content is intended entirely for research, educational and informational purposes only and does not constitute investment or consultation advice or investment strategy. The information is not tailored to the investment needs of any specific person and therefore does not involve a consideration of any of the investment objectives, financial situation or needs of any viewer that may receive it. Kindly also note that past performance is not a reliable indicator of future results. Actual results may differ materially from those anticipated in forward-looking or past performance statements. We assume no liability as to the accuracy or completeness of any of the information and/or content provided herein and the Company cannot be held responsible for any omission, mistake nor for any loss or damage including without limitation to any loss of profit which may arise from reliance on any information supplied by Everest Fortune Group.
Bullish bounce?USD/CAD has bouned off the support level which is an overlap support and could rise from this level too ur take profit.
Entry: 1.3687
Why we like it:
There is an overlap support level.
Stop loss: 1.3668
Why we like it:
There is a pullback support level.
Take profit: 1.3740
Why we like it:
There is a pullback resistance level that lines up with the 50% Fibonacci retracement.
Enjoying your TradingView experience? Review us!
Please be advised that the information presented on TradingView is provided to Vantage (‘Vantage Global Limited’, ‘we’) by a third-party provider (‘Everest Fortune Group’). Please be reminded that you are solely responsible for the trading decisions on your account. There is a very high degree of risk involved in trading. Any information and/or content is intended entirely for research, educational and informational purposes only and does not constitute investment or consultation advice or investment strategy. The information is not tailored to the investment needs of any specific person and therefore does not involve a consideration of any of the investment objectives, financial situation or needs of any viewer that may receive it. Kindly also note that past performance is not a reliable indicator of future results. Actual results may differ materially from those anticipated in forward-looking or past performance statements. We assume no liability as to the accuracy or completeness of any of the information and/or content provided herein and the Company cannot be held responsible for any omission, mistake nor for any loss or damage including without limitation to any loss of profit which may arise from reliance on any information supplied by Everest Fortune Group.

EURNZD: Time to Grow 🇪🇺🇳🇿
EURNZD is strongly bullish after a test of a key horizontal support.
A bullish violation of a resistance line of a falling channel provide
a strong bullish signal.
Goal - 1.936
❤️Please, support my work with like, thank you!❤️
I am part of Trade Nation's Influencer program and receive a monthly fee for using their TradingView charts in my analysis.

EURNZD Eyes 1.99 — Technical & Fundamental Bulls AlignedToday, I want to analyze EURNZD ( OANDA:EURNZD ) for you, which is in good shape both technically and fundamentally .
Please stay with me.
EURNZD is moving close to the Support zone(1.88750 NZD-1.7970 NZD) and 100_SMA(Daily) and has managed to form a Double Bottom Pattern .
From the perspective of Elliott Wave theory , EURNZD seems to have completed the main wave 4 , and we should wait for the main wave 5 . The main wave 5 could complete at the Heavy Resistance zone(2.120 NZD-1.9927 NZD) .
-----------------------------------
EURNZD – Fundamental Analysis:
The EURNZD pair currently reflects a divergence between two very different economic outlooks.
Eurozone (EUR):
The European Central Bank (ECB) has recently begun cutting interest rates to support slowing economic activity, especially in the industrial and manufacturing sectors. Despite this dovish shift, inflation remains relatively under control, and the euro has held up well against riskier currencies thanks to global uncertainty and safe-haven flows.
New Zealand (NZD):
New Zealand's economy is under pressure. The latest GDP figures confirmed a weak growth outlook, and signs of a technical recession are mounting. While the Reserve Bank of New Zealand (RBNZ) has maintained a relatively hawkish tone, it faces a dilemma: inflation is sticky, but domestic demand and housing remain fragile. The RBNZ may be forced to soften its stance sooner than expected.
Outlook:
This fundamental backdrop supports a bullish bias for EURNZD. The euro’s relative stability versus the increasingly vulnerable New Zealand dollar makes this pair attractive for long positions — especially if upcoming NZ data disappoints or global risk sentiment weakens further.
-----------------------------------
Based on the above explanation, I expect EURNZD to rise to at least 1.9917 NZD .
Note: Stop Loss(SL): 1.8779 NZD
Please respect each other's ideas and express them politely if you agree or disagree.
Euro/New Zealand Dollar Analyze (EURNZD), Daily time frame.
Be sure to follow the updated ideas.
Do not forget to put a Stop loss for your positions (For every position you want to open).
Please follow your strategy and updates; this is just my Idea, and I will gladly see your ideas in this post.
Please do not forget the ✅' like '✅ button 🙏😊 & Share it with your friends; thanks, and Trade safe.

EURUSD Short Part IIEURUSD Analysis
On EURUSD daily chart from CMC Markets quota, indicates a bullish trend with a symmetrical triangle pattern forming. The price has recently broken above a key resistance level, suggesting potential for continued upward movement.
Key Price Levels
Current Price: 1.16932
Stop Loss (SL): 1.16549
Take Profit 1 (TP1): 1.12003
Take Profit 2 (TP2): 1.09318
Trend Analysis
EURUSD shows clear signs on an ascending trend supported by higher lows and higher highs since early 2025. Both orange trend-lines which I created form a symmetrical triangle, with the price nearing the apex, hinting at a potential breakout or reversal which I have been looking for a reversal bearish breakout.
The upward momentum is strong, but the proximity to the upper trend-line and set take-profit levels indicates preparation for a possible correction. I still believe in shorts on EURUSD.
Conclusion
Traders and investors should monitor the price action near the triangle apex for breakout confirmation. The set stop loss and take-profit levels provide a structured approach to managing the trade, balancing potential gains with risk mitigation. Stay tuned for more updates on the trade.

Technical + Fundamental Alignment: GBPUSD Short in PlayGBPUSD ( FX:GBPUSD ) is moving near the Resistance zone($1.354-$1,350) and has managed to break the Support line .
In terms of Elliott Wave theory , it seems that GBPUSD has completed the Zigzag Correction(ABC/5-3-5) , we can expect the next five bearish waves .
--------------------------------------------------------
Fundamental Analysis
1-Weak UK Economic Data:
Recent reports including Retail Sales, Industrial Output, and PMIs have come in below expectations.
Labour market is softening, and wage growth is decelerating.
2-Dovish Expectations for BoE:
With inflation cooling down, the Bank of England is expected to hold or even cut rates soon, reducing support for the pound.
3-Stronger USD Outlook
Despite some weaker U.S. data, the Fed maintains a hawkish stance. U.S. retail sales and inflation still support the dollar overall.
4-UK Political Risk
Upcoming UK elections on July 4 are adding uncertainty and downside risk to GBP.
--------------------------------------------------------
I expect GBPUSD to attack at least the Support lines based on the above explanation.
Targets: 1.3
1)1.3353 USD =>Risk-To-Reward: 1.51
2)1.3315 USD =>Risk-To-Reward: 2.00
Note: Stop Loss(SL): 1.3549 USD
Please respect each other's ideas and express them politely if you agree or disagree.
British Pound / U.S Dollar Analyze (GBPUSD), 1-hour time frame.
Be sure to follow the updated ideas.
Do not forget to put a Stop loss for your positions (For every position you want to open).
Please follow your strategy and updates; this is just my Idea, and I will gladly see your ideas in this post.
Please do not forget the ✅' like '✅ button 🙏😊 & Share it with your friends; thanks, and Trade safe.

GOLD BUY BIAS • Demand Zone (Grey Box):
Price tapped into a clear demand/support zone around 3300–3310, showing rejection wicks and slowing bearish momentum.
• Reversal Expectation:
Bullish projection drawn on the chart suggests a potential rally if price holds above this zone.
• Upside Targets:
• First target: ~3390 (previous structure high)
• Next: ~3410–3440 (liquidity sweep area)

EURAUD – Rejection From Resistance: Bearish Momentum BuildingThe recent rally on EURAUD has met strong rejection near the 1.7980–1.8000 supply zone, signaling exhaustion of bullish momentum. With price forming a clear lower high and pushing away from the upper range, traders may be eyeing short setups targeting deeper fib retracements. Here's how the fundamentals align with the technical picture:
🔻 Bias: Bearish
🔑 Key Fundamentals
Eurozone: While the German Ifo business sentiment has improved, hard data (like industrial output) remains weak. ECB speakers such as Panetta and Knot continue to lean dovish, signaling no urgency for further tightening.
Australia: The AUD is finding strength from a risk-on global environment, falling oil prices (positive for AUD importers), and stability in China-sensitive commodities. The RBA remains relatively hawkish versus the ECB.
Yield Spread: Euro-Australia rate differentials are narrowing, reducing EUR’s relative appeal.
⚠️ Risks to Bias
Unexpected Hawkish ECB Commentary
Risk-Off Event (e.g., equity sell-off or new geopolitical tensions) that could weaken AUD
China PMI Miss dragging AUD if demand outlook sours
📅 News/Events to Watch
June 28: U.S. Core PCE (Fed impact → EURUSD spillover)
June 30: China PMIs (key for AUD demand outlook)
Ongoing: ECB member speeches, Eurozone CPI prelims
🔄 Potential Leader
AUD Crosses (e.g., AUDJPY, AUDUSD) may lead broader moves if China PMI surprises or if commodities rebound further.
This technical rejection from the key resistance zone aligns with the macro shift favoring AUD strength over EUR. As long as price stays below the 1.7980–1.8000 zone, EURAUD may slide toward 1.7730, 1.7595, and even 1.7460 in extension.
🔔 Trade idea: Watch for bearish confirmation on the H4 close below 1.7830 to validate momentum continuation.

AUDUSD - 4h |||Check this out for comprehensive analysis...
#AUSUSD #MJTRADING #FOREX #FXsignals #chart

NASDAQ, USTECUSTEC price is currently near the main resistance level of 22168-22229. If the price cannot break through the level of 22229, it is expected that the price will have a chance to go down. Consider selling the red zone.
🔥Trading futures, forex, CFDs and stocks carries a risk of loss.
Please consider carefully whether such trading is suitable for you.
>>GooD Luck 😊
❤️ Like and subscribe to never miss a new idea!

AUDCHF: Bearish Move From Resistance Confirmed?! 🇦🇺🇨🇭
AUDCHF may drop from the underlined blue supply zone,
following a bearish breakout of a support line of an expanding
wedge pattern on an hourly time frame.
Goal - 0.5253
❤️Please, support my work with like, thank you!❤️

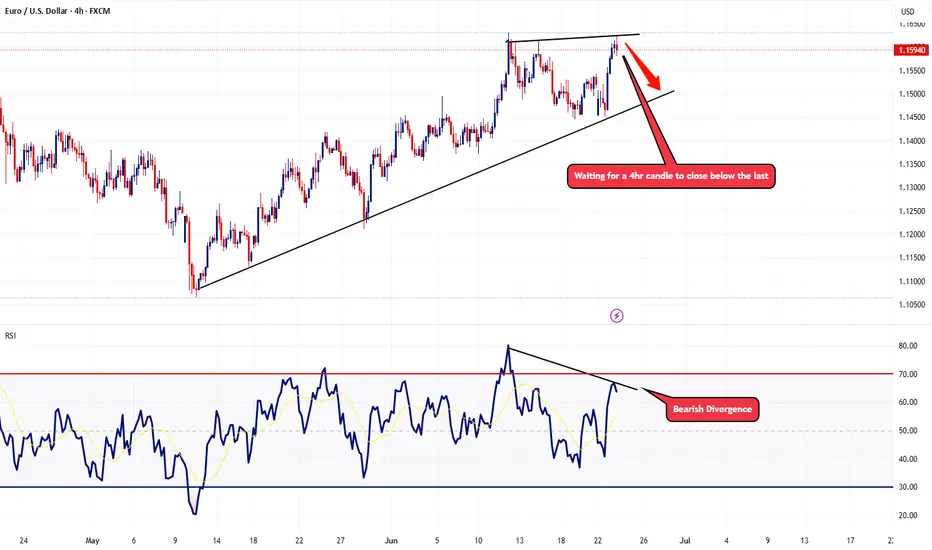
EURUSD Potential Topping ActionTaking a look at the 4hr chart, RSI is showing signs that the bullish momentum is starting to fade with the bearish divergence. In the event we get a 4hr candle that closes below the last, I'll be looking to start scaling some short positions with this pair.
Trade Safe - Trade Well.
CADCHF: Confirmed Bearish Trap?! 🇨🇦🇨🇭
There is a high chance that CADCHF will bounce from the underlined
blue support.
As a confirmation, I see a cup & handle pattern on an hourly time frame
that compose a bearish trap.
Goal - 0.5926
❤️Please, support my work with like, thank you!❤️
I am part of Trade Nation's Influencer program and receive a monthly fee for using their TradingView charts in my analysis.

CAD/JPY Holds Trendline Support with Bullish Bias IntactFenzoFx—CAD/JPY dipped from 107.34, finding support at a bullish FVG while staying above the ascending trendline.
The Stochastic Oscillator signals oversold, suggesting a potential reversal. The outlook remains bullish above 105.61, targeting a retest of 107.35. A break below 105.61 would invalidate the bullish scenario.

Bearish continuation for the Swissie?The price is rising towards the pivot which is a pullback resistance and could reverse to the pullback support.
Pivot: 0.8156
1st Support: 0.8054
1st Resistance: 0.8238
Risk Warning:
Trading Forex and CFDs carries a high level of risk to your capital and you should only trade with money you can afford to lose. Trading Forex and CFDs may not be suitable for all investors, so please ensure that you fully understand the risks involved and seek independent advice if necessary.
Disclaimer:
The above opinions given constitute general market commentary, and do not constitute the opinion or advice of IC Markets or any form of personal or investment advice.
Any opinions, news, research, analyses, prices, other information, or links to third-party sites contained on this website are provided on an "as-is" basis, are intended only to be informative, is not an advice nor a recommendation, nor research, or a record of our trading prices, or an offer of, or solicitation for a transaction in any financial instrument and thus should not be treated as such. The information provided does not involve any specific investment objectives, financial situation and needs of any specific person who may receive it. Please be aware, that past performance is not a reliable indicator of future performance and/or results. Past Performance or Forward-looking scenarios based upon the reasonable beliefs of the third-party provider are not a guarantee of future performance. Actual results may differ materially from those anticipated in forward-looking or past performance statements. IC Markets makes no representation or warranty and assumes no liability as to the accuracy or completeness of the information provided, nor any loss arising from any investment based on a recommendation, forecast or any information supplied by any third-party.

Heading into overlap resistance?The Kiwi (NZD/USD) is rising towards the pivot which has been identified as an overlap resistance that aligns with the 61.8% Fibonacci retracement and could reverse to the 1st support which is a pullback support.
Pivot: 0.6009
1st Support: 0.5940
1st Resistance: 0.6044
Risk Warning:
Trading Forex and CFDs carries a high level of risk to your capital and you should only trade with money you can afford to lose. Trading Forex and CFDs may not be suitable for all investors, so please ensure that you fully understand the risks involved and seek independent advice if necessary.
Disclaimer:
The above opinions given constitute general market commentary, and do not constitute the opinion or advice of IC Markets or any form of personal or investment advice.
Any opinions, news, research, analyses, prices, other information, or links to third-party sites contained on this website are provided on an "as-is" basis, are intended only to be informative, is not an advice nor a recommendation, nor research, or a record of our trading prices, or an offer of, or solicitation for a transaction in any financial instrument and thus should not be treated as such. The information provided does not involve any specific investment objectives, financial situation and needs of any specific person who may receive it. Please be aware, that past performance is not a reliable indicator of future performance and/or results. Past Performance or Forward-looking scenarios based upon the reasonable beliefs of the third-party provider are not a guarantee of future performance. Actual results may differ materially from those anticipated in forward-looking or past performance statements. IC Markets makes no representation or warranty and assumes no liability as to the accuracy or completeness of the information provided, nor any loss arising from any investment based on a recommendation, forecast or any information supplied by any third-party.

Bullish momentum to rise?The Aussie (AUD/USD) is reacting off the pivot which acts as an overlap resistance and could rise to the 1st resistance.
Pivot: 0.6457
1st Support: 0.6388
1st Resistance: 0.6546
Risk Warning:
Trading Forex and CFDs carries a high level of risk to your capital and you should only trade with money you can afford to lose. Trading Forex and CFDs may not be suitable for all investors, so please ensure that you fully understand the risks involved and seek independent advice if necessary.
Disclaimer:
The above opinions given constitute general market commentary, and do not constitute the opinion or advice of IC Markets or any form of personal or investment advice.
Any opinions, news, research, analyses, prices, other information, or links to third-party sites contained on this website are provided on an "as-is" basis, are intended only to be informative, is not an advice nor a recommendation, nor research, or a record of our trading prices, or an offer of, or solicitation for a transaction in any financial instrument and thus should not be treated as such. The information provided does not involve any specific investment objectives, financial situation and needs of any specific person who may receive it. Please be aware, that past performance is not a reliable indicator of future performance and/or results. Past Performance or Forward-looking scenarios based upon the reasonable beliefs of the third-party provider are not a guarantee of future performance. Actual results may differ materially from those anticipated in forward-looking or past performance statements. IC Markets makes no representation or warranty and assumes no liability as to the accuracy or completeness of the information provided, nor any loss arising from any investment based on a recommendation, forecast or any information supplied by any third-party.
