EURGBP: Strong Bullish Confirmation 🇪🇺🇬🇧
EURGBP is going to continue rising in an uptrend
that the pair established at the end of May.
A completion of a consolidation and a formation of a new local Higher High
indicate a highly probable bullish continuation soon.
Next resistance - 0.8605
❤️Please, support my work with like, thank you!❤️
I am part of Trade Nation's Influencer program and receive a monthly fee for using their TradingView charts in my analysis.
Forexsignals

#USOIIL #WTI 1H📈 #USOIL 1H Buy Setup – Liquidity Sweep in Play
Crude Oil is consolidating after a sharp decline, forming a potential setup for a liquidity sweep below the current range, followed by a bullish reversal. We're anticipating a fakeout move to grab sell-side liquidity before price targets the Fair Value Gap (FVG) and premium supply zone above.
🟩 Buy Limit: 64.50 / 64.00
🎯 Targets: 70.00 → 72.00+
❌ Stop Loss: 63.00
This setup offers high risk-to-reward potential if the liquidity sweep plays out as expected. Monitor price action closely at the buy zone.
#CrudeOil #WTI #SmartMoney #TradingStrategy

Another RR2 Position On EURUSDThesis: EUR/USD is showing signs of exhaustion near the 1.1800 psychological resistance, with price rejecting the upper band of a recent range.
Entry: 🔻 Sell at 1.17883 (current price action confirms rejection)
Stop-Loss: 🔺 1.17943 – Above recent swing high and psychological resistance
Take-Profit: ✅ 1.17767 – Targeting the lower bound of the recent range and prior support
Risk-Reward Ratio: ~1:2 – High conviction setup with tight risk and extended downside potential

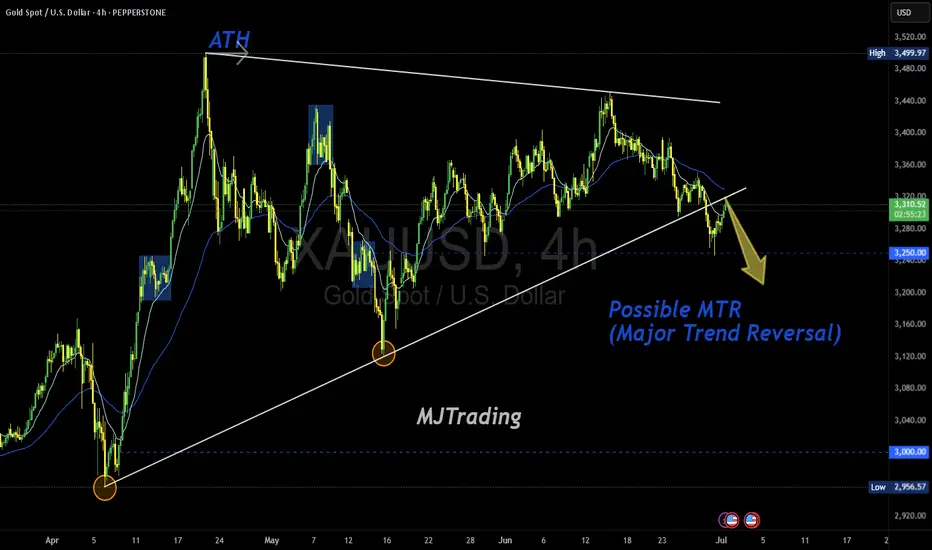
Possible MTR in Play (TBC)Gold has printed a textbook structure for a potential Major Trend Reversal (MTR) off the ATH zone, with a clean rejection and a shift in character. The descending trendline from the top aligns with lower highs, while the ascending base from April is now under pressure.
📌 Key Levels to Watch:
3,280.0 – neckline of the potential MTR
3,250.00 – psychological magnet and structural support
3,000.00 – major downside target if the reversal confirms
🧠 “Markets top on euphoria, not logic.” If price breaks and retests the neckline with momentum, the MTR thesis gains traction. Until then — TBC.
#XAUUSD #Gold #MajorTrendReversal #MTR #PriceAction #TechnicalAnalysis #GoldBears #ATHRejection #TrendShift #MJTrading
Could the Aussie reverse from here?The price is rising towards the pivot and could drop to the 1st support.
Pivot: 0.6598
1st Support: 0.6548
1st Resistance: 0.6628
Risk Warning:
Trading Forex and CFDs carries a high level of risk to your capital and you should only trade with money you can afford to lose. Trading Forex and CFDs may not be suitable for all investors, so please ensure that you fully understand the risks involved and seek independent advice if necessary.
Disclaimer:
The above opinions given constitute general market commentary, and do not constitute the opinion or advice of IC Markets or any form of personal or investment advice.
Any opinions, news, research, analyses, prices, other information, or links to third-party sites contained on this website are provided on an "as-is" basis, are intended only to be informative, is not an advice nor a recommendation, nor research, or a record of our trading prices, or an offer of, or solicitation for a transaction in any financial instrument and thus should not be treated as such. The information provided does not involve any specific investment objectives, financial situation and needs of any specific person who may receive it. Please be aware, that past performance is not a reliable indicator of future performance and/or results. Past Performance or Forward-looking scenarios based upon the reasonable beliefs of the third-party provider are not a guarantee of future performance. Actual results may differ materially from those anticipated in forward-looking or past performance statements. IC Markets makes no representation or warranty and assumes no liability as to the accuracy or completeness of the information provided, nor any loss arising from any investment based on a recommendation, forecast or any information supplied by any third-party.

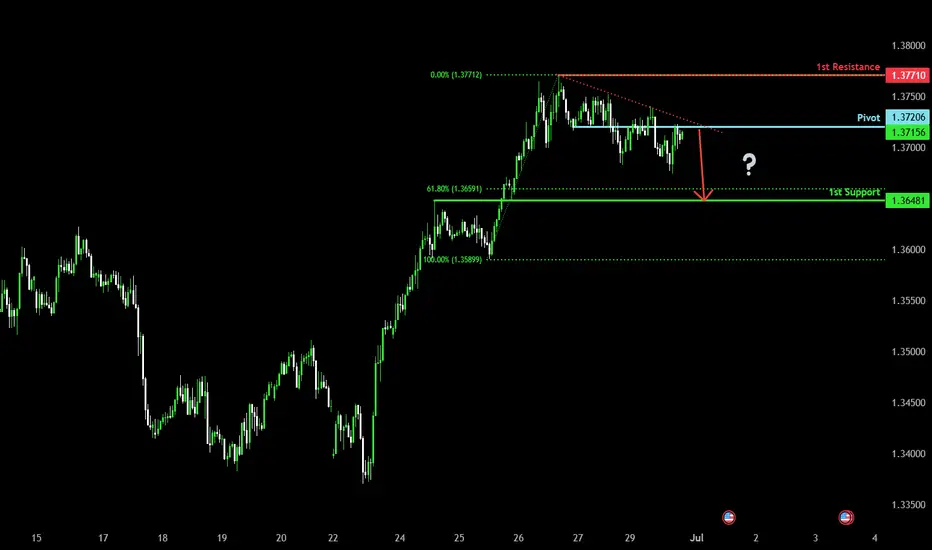
Bearish drop?The Cable (GBP/USD) is reacting off the pivot and could drop to the 1st support.
Pivot: 1.3720
1st Support: 1.3648
1st Resistance: 1.3771
Risk Warning:
Trading Forex and CFDs carries a high level of risk to your capital and you should only trade with money you can afford to lose. Trading Forex and CFDs may not be suitable for all investors, so please ensure that you fully understand the risks involved and seek independent advice if necessary.
Disclaimer:
The above opinions given constitute general market commentary, and do not constitute the opinion or advice of IC Markets or any form of personal or investment advice.
Any opinions, news, research, analyses, prices, other information, or links to third-party sites contained on this website are provided on an "as-is" basis, are intended only to be informative, is not an advice nor a recommendation, nor research, or a record of our trading prices, or an offer of, or solicitation for a transaction in any financial instrument and thus should not be treated as such. The information provided does not involve any specific investment objectives, financial situation and needs of any specific person who may receive it. Please be aware, that past performance is not a reliable indicator of future performance and/or results. Past Performance or Forward-looking scenarios based upon the reasonable beliefs of the third-party provider are not a guarantee of future performance. Actual results may differ materially from those anticipated in forward-looking or past performance statements. IC Markets makes no representation or warranty and assumes no liability as to the accuracy or completeness of the information provided, nor any loss arising from any investment based on a recommendation, forecast or any information supplied by any third-party.
Market next target 🔀 Disruption Analysis – Bullish Alternative Scenario
The current chart suggests a bearish outlook from the resistance zone (~$2,495–$2,500), targeting a drop below $2,425. However, here’s how a bullish disruption could break this bearish narrative:
---
🟢 Bullish Disruption Possibility:
1. Support Reclaim & Strong Buyer Reaction:
If price reclaims and holds above the marked “support area” (~$2,495), it could signal strength and trap early sellers.
A strong bullish candle closing above $2,505 could invalidate the bearish scenario.
2. Higher Low Formation:
If ETH prints a higher low above $2,470, it would suggest buyers are stepping in early, reinforcing bullish momentum.
3. Target Shift – Bullish Continuation:
A confirmed breakout above $2,505 may open the path to $2,540–$2,560 as the new short-term target zone.
4. Momentum Catalyst:
A positive U.S. macroeconomic event or crypto-specific bullish news (e.g., ETF, institutional inflows) could fuel upside disruption.

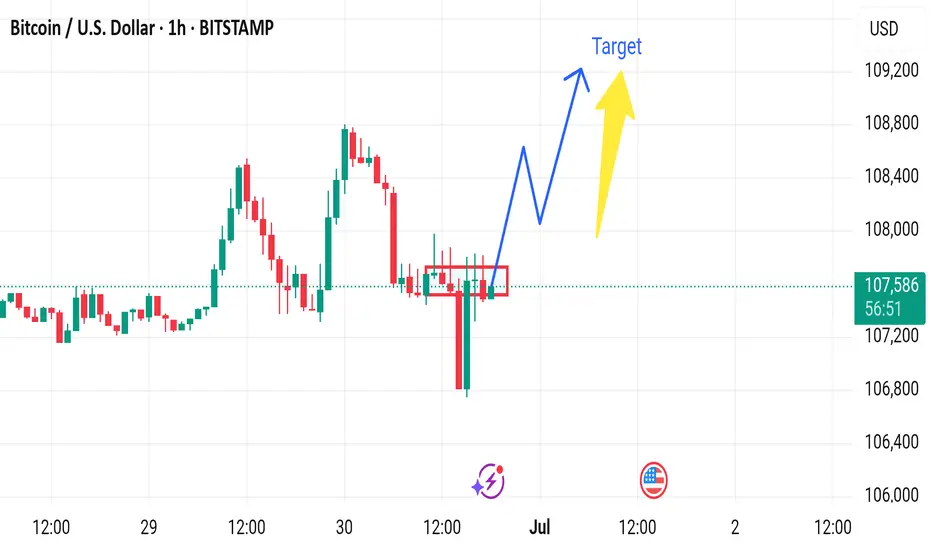
Market next target 🔀 Disruption Analysis – Bearish Alternative Scenario
The current chart suggests a bullish continuation from the consolidation zone around $107,300–$107,500, with a projected move toward $108,500+. However, the following bearish disruption could invalidate that path:
---
🔻 Bearish Disruption Possibility:
1. False Breakout Trap:
If price briefly spikes above the consolidation zone and quickly reverses, it could trap breakout buyers.
A failed bullish move around $107,800–$108,000 would be the first bearish signal.
2. Weak Volume Confirmation:
Lack of volume during the breakout would signal lack of institutional interest, increasing downside risk.
3. Break Below Support Zone:
If BTC breaks below $107,000, it would signal a loss of momentum and invalidate the bullish scenario.
This breakdown may lead to a quick move toward $106,000 or even $105,800, the recent swing low.
4. Macro Influence:
Any negative U.S. economic data or regulatory news could spark bearish sentiment and accelerate the drop.
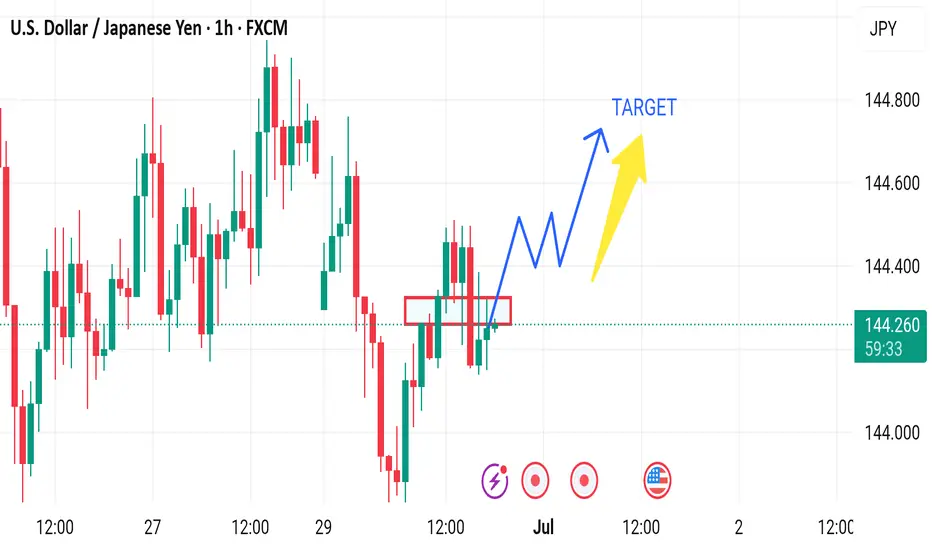
Market next move 🔀 Disruption Analysis – Bearish Alternative Scenario
While the current setup points to a bullish continuation above the support zone (around 144.10–144.20) with a projected target near 144.60, here’s how a bearish disruption could unfold instead:
---
🔻 Bearish Disruption Possibility:
1. Failed Breakout / Bull Trap:
Price may fake a move upward to trap breakout buyers near 144.40–144.50, then sharply reverse.
This would indicate a false breakout and potential reversal setup.
2. Rejection at Resistance:
Repeated failure to close above 144.40 may signal exhaustion.
Bearish divergence could form on momentum indicators (like RSI) as price rises.
3. Break Below Support Area:
A decisive break below the red support zone (around 144.10) may shift momentum bearish.
That would confirm a lower high and suggest downside continuation.
4. Next Bearish Target:
Initial support lies at 143.85, with further potential drop toward 143.60.
Market next target 🔀 Disruption Analysis – Bullish Alternative Scenario
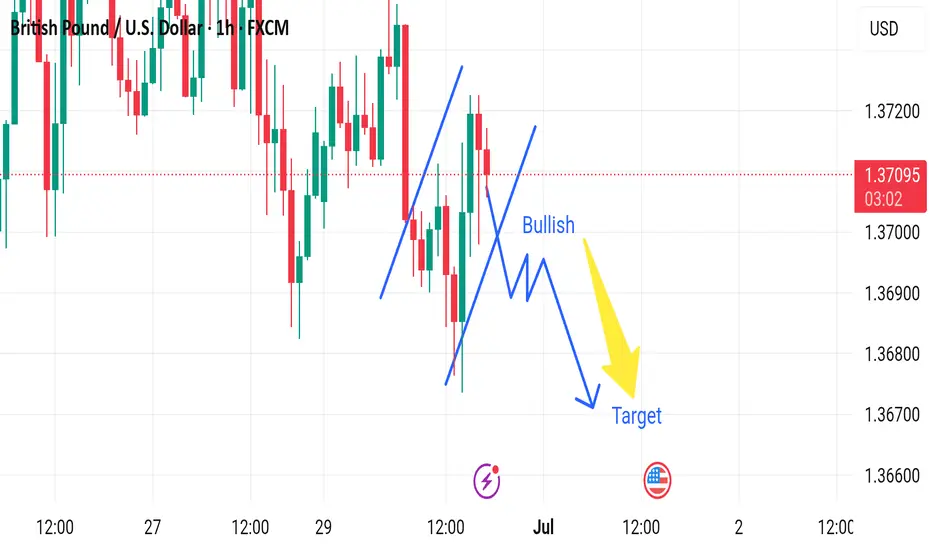
While the current chart outlines a bearish scenario after a short-term bullish correction, leading to a drop toward the target near 1.36600, here’s how a bullish disruption could unfold instead:
---
🟢 Bullish Disruption Possibility:
1. False Breakdown / Bear Trap:
The market may dip slightly below recent lows to trigger sell stops and liquidity grab, then reverse upward.
If price finds strong buying interest around 1.3690–1.3700, it could spark a bullish reversal.
2. Strong Rejection Candles:
Watch for bullish engulfing or pin bar formations on lower timeframes (15m or 30m) near the dip area.
These would signal loss of bearish momentum.
3. Break of Lower High Structure:
A break above 1.3720 would shift short-term market structure to bullish.
It could lead to a move toward 1.3750–1.3780.
4. Macro Fundamentals:
Hawkish BOE comments or weak U.S. data could reverse USD strength, lifting GBP/USD.
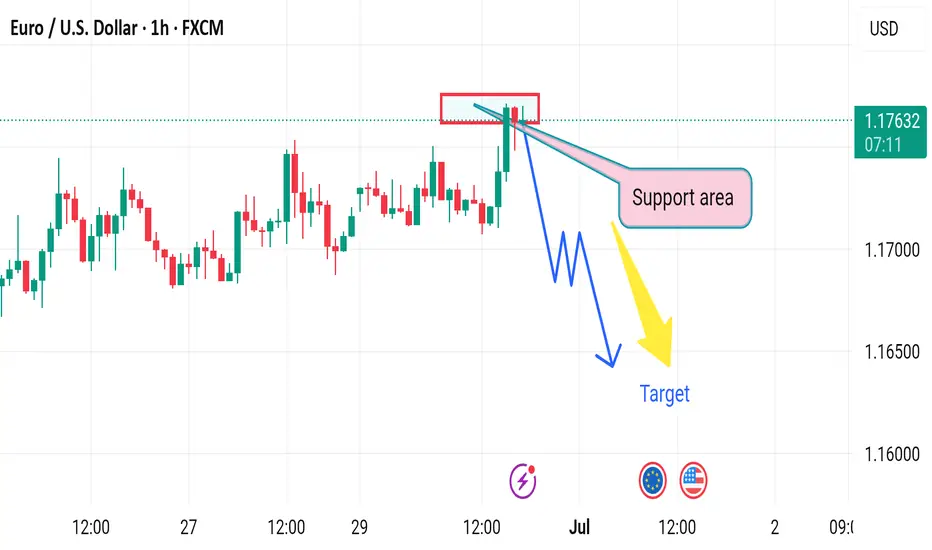
Market next move Disruption Analysis – Bullish Alternative Scenario
While the current chart suggests a bearish setup from a resistance zone (around 1.1765) toward a target near 1.1630, here's a potential bullish disruption that could invalidate the bearish thesis:
---
🟢 Bullish Disruption Possibility:
1. False Breakdown / Liquidity Grab:
Price may fake a dip below the red resistance-turned-support zone to trigger stop-losses before reversing.
This is known as a liquidity sweep or bear trap.
2. Higher Low Formation:
If the pair pulls back slightly but forms a higher low above 1.1700, it may signal bullish continuation.
3. Breakout Confirmation:
A strong bullish candle above 1.1775 could confirm continuation toward 1.1830–1.1850.
4. Fundamental Catalyst:
Positive EU economic news or dovish signals from the U.S. Fed could support Euro strength.
Market next target 🔀 Disruption Analysis - Alternative Scenario
While the current chart suggests a bullish breakout from the support area around $35.85–$35.90 with an upward target above $36.20, a potential bearish disruption scenario could unfold under the following conditions:
⚠️ Bearish Disruption Possibility:
1. Weakening Buying Pressure:
Price has tested the support zone multiple times, showing signs of weakening bullish momentum.
Buyers may be exhausting near the $36.00 area without strong follow-through.
2. Break Below Support:
If price breaks and closes below $35.85 support zone on high volume, it could invalidate the bullish setup.
This would create a lower low, indicating a potential trend reversal to the downside.
3. Next Downside Targets:
Immediate support lies around $35.60.
Further downside could take price to $35.40 if bearish momentum strengthens.
4. Bearish Triggers:
Negative economic data (especially U.S.-related as indicated by the calendar icon).
Rising DXY or bond yields may pressure silver prices

Bullish continuation for the Aussie?The price has bounced off the support level which is a pullback support and could potentially rise from this level to our take profit.
Entry: 0.5537
Why we like it:
There is a pullback support level.
Stop loss: 0.6490
Why we like it:
There is an overlap support level.
Take profit: 0.6623
Why we like it:
There is a resistance level at the 138.2% Fibonacci extension and the 61.8% Fibonacci projection.
Enjoying your TradingView experience? Review us!
Please be advised that the information presented on TradingView is provided to Vantage (‘Vantage Global Limited’, ‘we’) by a third-party provider (‘Everest Fortune Group’). Please be reminded that you are solely responsible for the trading decisions on your account. There is a very high degree of risk involved in trading. Any information and/or content is intended entirely for research, educational and informational purposes only and does not constitute investment or consultation advice or investment strategy. The information is not tailored to the investment needs of any specific person and therefore does not involve a consideration of any of the investment objectives, financial situation or needs of any viewer that may receive it. Kindly also note that past performance is not a reliable indicator of future results. Actual results may differ materially from those anticipated in forward-looking or past performance statements. We assume no liability as to the accuracy or completeness of any of the information and/or content provided herein and the Company cannot be held responsible for any omission, mistake nor for any loss or damage including without limitation to any loss of profit which may arise from reliance on any information supplied by Everest Fortune Group.

Falling towards pullback support?GBP?USD is falling towards the support level which is a pullback support that lines up with the 38.2% Fibonacci retracement and could drop from this level to our take profit.
Entry: 1.3609
Why we like it:
There is a pullback support level that lines up with the 38.2% Fibonacci retracement.
Stop loss: 1.3534
Why we like it:
There is a pullback support.
Take profit: 1.3746
Why we like it:
There is a pullback resistance.
Enjoying your TradingView experience? Review us!
Please be advised that the information presented on TradingView is provided to Vantage (‘Vantage Global Limited’, ‘we’) by a third-party provider (‘Everest Fortune Group’). Please be reminded that you are solely responsible for the trading decisions on your account. There is a very high degree of risk involved in trading. Any information and/or content is intended entirely for research, educational and informational purposes only and does not constitute investment or consultation advice or investment strategy. The information is not tailored to the investment needs of any specific person and therefore does not involve a consideration of any of the investment objectives, financial situation or needs of any viewer that may receive it. Kindly also note that past performance is not a reliable indicator of future results. Actual results may differ materially from those anticipated in forward-looking or past performance statements. We assume no liability as to the accuracy or completeness of any of the information and/or content provided herein and the Company cannot be held responsible for any omission, mistake nor for any loss or damage including without limitation to any loss of profit which may arise from reliance on any information supplied by Everest Fortune Group.

EURUSD Sell signal at the top of the Channel Up.Last time we analyzed the EURUSD pair (June 23, see chart below) we gave a strong buy signals at the bottom of the 1.5-month Channel Up:
The price is almost near our Target but since it's been consolidating for so many 4H candles on the pattern's top, it is better to take the good profit and turn bearish.
The 0.5 Fibonacci retracement level has been a solid target for the previous two Bearish Legs, but since the last one bottomed just above it on the 4H MA100 (green trend-line), we will place the Target a little higher this time also at 1.16100.
-------------------------------------------------------------------------------
** Please LIKE 👍, FOLLOW ✅, SHARE 🙌 and COMMENT ✍ if you enjoy this idea! Also share your ideas and charts in the comments section below! This is best way to keep it relevant, support us, keep the content here free and allow the idea to reach as many people as possible. **
-------------------------------------------------------------------------------
Disclosure: I am part of Trade Nation's Influencer program and receive a monthly fee for using their TradingView charts in my analysis.
💸💸💸💸💸💸
👇 👇 👇 👇 👇 👇

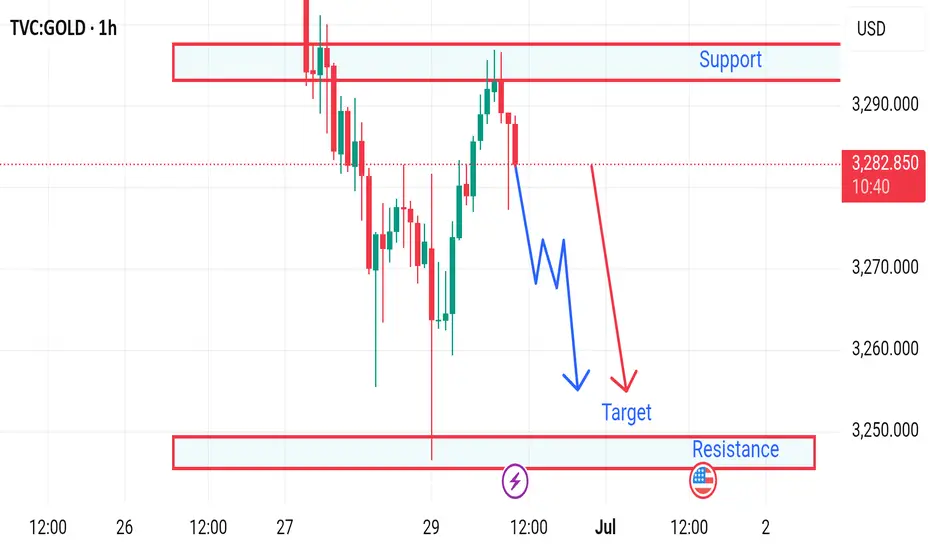
Market next move 📉 Gold Price Disruption Analysis – 1H Chart
Current Price: $3,282.880
Timeframe: 1-Hour
Trend Direction: Bearish bias with possible continuation toward $3,250
---
🔻 Bearish Scenario (Planned Path):
Support Turned Resistance: The area around $3,290 acted as strong resistance (previous support). Price failed to break above.
Lower High Formation: Price has created a lower high, indicating potential continuation to the downside.
Projected Target: A zigzag downward move is expected, with a target near $3,250, aligning with a key demand/support zone.
---
⚠️ Disruption Possibilities (Unexpected Movements):
🔁 1. Bullish Disruption Risk:
If buyers step in aggressively above $3,283–$3,285, we may see:
A break of structure
A reversal toward the $3,290+ zone
Possible formation of a double bottom or inverse head and shoulders
Disruption Target: $3,295–$3,300
🧨 2. False Breakdown at Support ($3,250):
Market could dip slightly below $3,250 to trap sellers and then reverse sharply.
A liquidity grab might lead to sudden bullish pressure, creating a disruption bounce.
📊 3. Fundamental Disruption Factors:
US Dollar strength/weakness
Fed interest rate news
Inflation data releases
These can instantly invalidate technical patterns and push price in either direction.
MarketBreakdown | EURUSD, GBPUSD, USDJPY, USDCHF
Here are the updates & outlook for multiple instruments in my watch list.
1️⃣ #EURUSD weekly time frame 🇪🇺🇺🇸
The pair is unstoppable.
The market violated a significant weekly resistance cluster last week.
It opens more growth potential after a pullback.
2️⃣ #GBPUSD weekly time frame 🇬🇧🇺🇸
In comparison to EURUSD, GBPUSD is now approaching a major
resistance area. I think that we can expect a retracement from that.
3️⃣ #USDJPY daily time frame 🇺🇸🇯🇵
The market continues a correctional movement lower.
The closest strong support that I see is based on a rising trend line.
I think that buying interest may spark again after its text.
4️⃣ #USDCHF daily time frame 🇺🇸🇨🇭
The price updated a historic low on Friday.
The next strong support that I see is based on a falling trend line.
We can expect a pullback from that.
Do you agree with my market breakdown?
❤️Please, support my work with like, thank you!❤️
I am part of Trade Nation's Influencer program and receive a monthly fee for using their TradingView charts in my analysis.

Potential bearish drop?USD/JPY has rejected off the resistance level which is a pullback resistance and could drop from this level to our take profit.
Entry: 144.61
Why we like it:
There is a pullback resistance level.
Stop loss: 146.11
Why we like it:
There is a pullback resistance level.
Take profit: 142.70
Why we like it:
There is a pullback support level that lines up with the 100% Fibonacci projection.
Enjoying your TradingView experience? Review us!
Please be advised that the information presented on TradingView is provided to Vantage (‘Vantage Global Limited’, ‘we’) by a third-party provider (‘Everest Fortune Group’). Please be reminded that you are solely responsible for the trading decisions on your account. There is a very high degree of risk involved in trading. Any information and/or content is intended entirely for research, educational and informational purposes only and does not constitute investment or consultation advice or investment strategy. The information is not tailored to the investment needs of any specific person and therefore does not involve a consideration of any of the investment objectives, financial situation or needs of any viewer that may receive it. Kindly also note that past performance is not a reliable indicator of future results. Actual results may differ materially from those anticipated in forward-looking or past performance statements. We assume no liability as to the accuracy or completeness of any of the information and/or content provided herein and the Company cannot be held responsible for any omission, mistake nor for any loss or damage including without limitation to any loss of profit which may arise from reliance on any information supplied by Everest Fortune Group.

Bullish reversal?USD/CHF is falling towards the support level which aligns with the 161.8% Fibonacci extension and the 78.4% Fibonacci projection and could bounce from this level to our take profit.
Entry: 0.7950
Why we like it:
There is a support level at the 161.8% Fibonacci extension and the 78.4% Fibonacci projection.
Stop loss: 0.7899
Why we like it:
There is a support level at the 100% Fibonacci projection.
Take profit: 0.8052
Why we like it:
Thee is a pullback resistance that lines up with the 38.2% Fibonacci retracement.
Enjoying your TradingView experience? Review us!
Please be advised that the information presented on TradingView is provided to Vantage (‘Vantage Global Limited’, ‘we’) by a third-party provider (‘Everest Fortune Group’). Please be reminded that you are solely responsible for the trading decisions on your account. There is a very high degree of risk involved in trading. Any information and/or content is intended entirely for research, educational and informational purposes only and does not constitute investment or consultation advice or investment strategy. The information is not tailored to the investment needs of any specific person and therefore does not involve a consideration of any of the investment objectives, financial situation or needs of any viewer that may receive it. Kindly also note that past performance is not a reliable indicator of future results. Actual results may differ materially from those anticipated in forward-looking or past performance statements. We assume no liability as to the accuracy or completeness of any of the information and/or content provided herein and the Company cannot be held responsible for any omission, mistake nor for any loss or damage including without limitation to any loss of profit which may arise from reliance on any information supplied by Everest Fortune Group.

Bearish drop?USD/CAD is reacting off the resistance level which is pullback resistance that aligns with the 38.2% Fibonacci retracement and could drop from this level to our take profit.
Entry: 1.3690
Why we like it:
There is a pullback resistance that aligns with the 38.2% Fibonacci retracement.
Stop loss: 1.3797
Why we like it:
There is a pullback resistance.
Take profit: 1.3555
Why we like it:
There is a pullback support level.
Enjoying your TradingView experience? Review us!
Please be advised that the information presented on TradingView is provided to Vantage (‘Vantage Global Limited’, ‘we’) by a third-party provider (‘Everest Fortune Group’). Please be reminded that you are solely responsible for the trading decisions on your account. There is a very high degree of risk involved in trading. Any information and/or content is intended entirely for research, educational and informational purposes only and does not constitute investment or consultation advice or investment strategy. The information is not tailored to the investment needs of any specific person and therefore does not involve a consideration of any of the investment objectives, financial situation or needs of any viewer that may receive it. Kindly also note that past performance is not a reliable indicator of future results. Actual results may differ materially from those anticipated in forward-looking or past performance statements. We assume no liability as to the accuracy or completeness of any of the information and/or content provided herein and the Company cannot be held responsible for any omission, mistake nor for any loss or damage including without limitation to any loss of profit which may arise from reliance on any information supplied by Everest Fortune Group.

Bearish drop?US Dollar Index (DXY) has reacted off the pivot, which has been identified as a pullback resistance and could drop to the 1st support.
Pivot: 97.80
1st Support: 95.40
1st Resistance: 99.36
Risk Warning:
Trading Forex and CFDs carries a high level of risk to your capital and you should only trade with money you can afford to lose. Trading Forex and CFDs may not be suitable for all investors, so please ensure that you fully understand the risks involved and seek independent advice if necessary.
Disclaimer:
The above opinions given constitute general market commentary, and do not constitute the opinion or advice of IC Markets or any form of personal or investment advice.
Any opinions, news, research, analyses, prices, other information, or links to third-party sites contained on this website are provided on an "as-is" basis, are intended only to be informative, is not an advice nor a recommendation, nor research, or a record of our trading prices, or an offer of, or solicitation for a transaction in any financial instrument and thus should not be treated as such. The information provided does not involve any specific investment objectives, financial situation and needs of any specific person who may receive it. Please be aware, that past performance is not a reliable indicator of future performance and/or results. Past Performance or Forward-looking scenarios based upon the reasonable beliefs of the third-party provider are not a guarantee of future performance. Actual results may differ materially from those anticipated in forward-looking or past performance statements. IC Markets makes no representation or warranty and assumes no liability as to the accuracy or completeness of the information provided, nor any loss arising from any investment based on a recommendation, forecast or any information supplied by any third-party.

Bullish continuation?The Cable (GBP/USD) is falling towards the pivot, which acts as a pullback support and could bounce to the 1st resistance.
Pivot: 1.3617
1st Support: 1.3442
1st Resistance: 1.3795
Risk Warning:
Trading Forex and CFDs carries a high level of risk to your capital and you should only trade with money you can afford to lose. Trading Forex and CFDs may not be suitable for all investors, so please ensure that you fully understand the risks involved and seek independent advice if necessary.
Disclaimer:
The above opinions given constitute general market commentary, and do not constitute the opinion or advice of IC Markets or any form of personal or investment advice.
Any opinions, news, research, analyses, prices, other information, or links to third-party sites contained on this website are provided on an "as-is" basis, are intended only to be informative, is not an advice nor a recommendation, nor research, or a record of our trading prices, or an offer of, or solicitation for a transaction in any financial instrument and thus should not be treated as such. The information provided does not involve any specific investment objectives, financial situation and needs of any specific person who may receive it. Please be aware, that past performance is not a reliable indicator of future performance and/or results. Past Performance or Forward-looking scenarios based upon the reasonable beliefs of the third-party provider are not a guarantee of future performance. Actual results may differ materially from those anticipated in forward-looking or past performance statements. IC Markets makes no representation or warranty and assumes no liability as to the accuracy or completeness of the information provided, nor any loss arising from any investment based on a recommendation, forecast or any information supplied by any third-party.

Bullish bounce off pullback support?USD/JPY is falling towards the pivot and could bounce to the 1st resistance, which is a pullback resistance.
Pivot: 142.53
1st Support: 140.78
1st Resistance: 146.72
Risk Warning:
Trading Forex and CFDs carries a high level of risk to your capital and you should only trade with money you can afford to lose. Trading Forex and CFDs may not be suitable for all investors, so please ensure that you fully understand the risks involved and seek independent advice if necessary.
Disclaimer:
The above opinions given constitute general market commentary, and do not constitute the opinion or advice of IC Markets or any form of personal or investment advice.
Any opinions, news, research, analyses, prices, other information, or links to third-party sites contained on this website are provided on an "as-is" basis, are intended only to be informative, is not an advice nor a recommendation, nor research, or a record of our trading prices, or an offer of, or solicitation for a transaction in any financial instrument and thus should not be treated as such. The information provided does not involve any specific investment objectives, financial situation and needs of any specific person who may receive it. Please be aware, that past performance is not a reliable indicator of future performance and/or results. Past Performance or Forward-looking scenarios based upon the reasonable beliefs of the third-party provider are not a guarantee of future performance. Actual results may differ materially from those anticipated in forward-looking or past performance statements. IC Markets makes no representation or warranty and assumes no liability as to the accuracy or completeness of the information provided, nor any loss arising from any investment based on a recommendation, forecast or any information supplied by any third-party.
