Gold price analysis June 18Yesterday's D1 candle was a Doji candle. It shows the hesitation of buyers and sellers at the price near ATH.
The h4 structure is a sustainable bullish wave structure and is heading towards higher hooks.
The 3400 zone is the immediate resistance zone that Gold is heading towards. This zone will be the breakout zone for the confirmation of the candle closing above 3400.
The profit-taking reaction zone of sellers at 3415 acts as a price reaction when the price uptrend returns and creates momentum towards 3443.
On the other hand, the breakout point of 3472, if broken, will push the price to the support zone of 3343
Forexsignals

Bearish reversal off pullback resistance?The Loonie (USD/CAD) is rising towards the pivot which is a pullback resistance that aligns with the 50% Fibonacci retracement and could reverse to the 1st support.
Pivot: 1.3706
1st Support: 1.3599
1st Resistance: 1.3793
Risk Warning:
Trading Forex and CFDs carries a high level of risk to your capital and you should only trade with money you can afford to lose. Trading Forex and CFDs may not be suitable for all investors, so please ensure that you fully understand the risks involved and seek independent advice if necessary.
Disclaimer:
The above opinions given constitute general market commentary, and do not constitute the opinion or advice of IC Markets or any form of personal or investment advice.
Any opinions, news, research, analyses, prices, other information, or links to third-party sites contained on this website are provided on an "as-is" basis, are intended only to be informative, is not an advice nor a recommendation, nor research, or a record of our trading prices, or an offer of, or solicitation for a transaction in any financial instrument and thus should not be treated as such. The information provided does not involve any specific investment objectives, financial situation and needs of any specific person who may receive it. Please be aware, that past performance is not a reliable indicator of future performance and/or results. Past Performance or Forward-looking scenarios based upon the reasonable beliefs of the third-party provider are not a guarantee of future performance. Actual results may differ materially from those anticipated in forward-looking or past performance statements. IC Markets makes no representation or warranty and assumes no liability as to the accuracy or completeness of the information provided, nor any loss arising from any investment based on a recommendation, forecast or any information supplied by any third-party.

Could the price bounce from here?USD/JPY is falling towards the pivot which is an overlap support and could bounce to the 1st resistance which which acts as a pullback resistance.
Pivot: 144.34
1st Support: 142.98
1st Resistance: 146.15
Risk Warning:
Trading Forex and CFDs carries a high level of risk to your capital and you should only trade with money you can afford to lose. Trading Forex and CFDs may not be suitable for all investors, so please ensure that you fully understand the risks involved and seek independent advice if necessary.
Disclaimer:
The above opinions given constitute general market commentary, and do not constitute the opinion or advice of IC Markets or any form of personal or investment advice.
Any opinions, news, research, analyses, prices, other information, or links to third-party sites contained on this website are provided on an "as-is" basis, are intended only to be informative, is not an advice nor a recommendation, nor research, or a record of our trading prices, or an offer of, or solicitation for a transaction in any financial instrument and thus should not be treated as such. The information provided does not involve any specific investment objectives, financial situation and needs of any specific person who may receive it. Please be aware, that past performance is not a reliable indicator of future performance and/or results. Past Performance or Forward-looking scenarios based upon the reasonable beliefs of the third-party provider are not a guarantee of future performance. Actual results may differ materially from those anticipated in forward-looking or past performance statements. IC Markets makes no representation or warranty and assumes no liability as to the accuracy or completeness of the information provided, nor any loss arising from any investment based on a recommendation, forecast or any information supplied by any third-party.

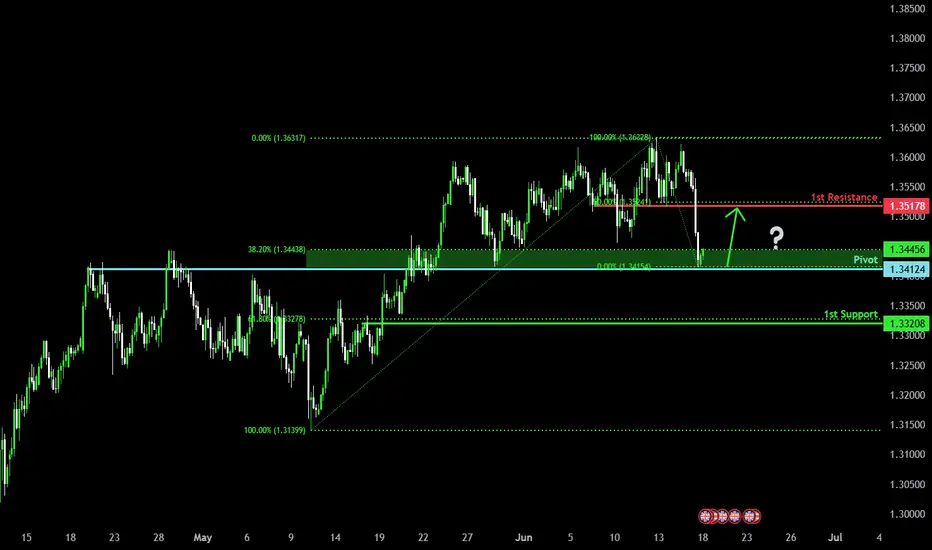
Bullish reversal off overlap support?The Cable (GBP/USD) has bounced off the pivot and could rise to the 50% Fibonacci resistance.
Pivot: 1.3412
1st Support: 1.3320
1st Resistance: 1.3517
Risk Warning:
Trading Forex and CFDs carries a high level of risk to your capital and you should only trade with money you can afford to lose. Trading Forex and CFDs may not be suitable for all investors, so please ensure that you fully understand the risks involved and seek independent advice if necessary.
Disclaimer:
The above opinions given constitute general market commentary, and do not constitute the opinion or advice of IC Markets or any form of personal or investment advice.
Any opinions, news, research, analyses, prices, other information, or links to third-party sites contained on this website are provided on an "as-is" basis, are intended only to be informative, is not an advice nor a recommendation, nor research, or a record of our trading prices, or an offer of, or solicitation for a transaction in any financial instrument and thus should not be treated as such. The information provided does not involve any specific investment objectives, financial situation and needs of any specific person who may receive it. Please be aware, that past performance is not a reliable indicator of future performance and/or results. Past Performance or Forward-looking scenarios based upon the reasonable beliefs of the third-party provider are not a guarantee of future performance. Actual results may differ materially from those anticipated in forward-looking or past performance statements. IC Markets makes no representation or warranty and assumes no liability as to the accuracy or completeness of the information provided, nor any loss arising from any investment based on a recommendation, forecast or any information supplied by any third-party.
Bullish bounce?The Fiber (EUR/USD) is falling towards the pivot and could bounce to the 1st resistance.
Pivot: 1.1451
1st Support: 1.1342
1st Resistance: 1.1614
Risk Warning:
Trading Forex and CFDs carries a high level of risk to your capital and you should only trade with money you can afford to lose. Trading Forex and CFDs may not be suitable for all investors, so please ensure that you fully understand the risks involved and seek independent advice if necessary.
Disclaimer:
The above opinions given constitute general market commentary, and do not constitute the opinion or advice of IC Markets or any form of personal or investment advice.
Any opinions, news, research, analyses, prices, other information, or links to third-party sites contained on this website are provided on an "as-is" basis, are intended only to be informative, is not an advice nor a recommendation, nor research, or a record of our trading prices, or an offer of, or solicitation for a transaction in any financial instrument and thus should not be treated as such. The information provided does not involve any specific investment objectives, financial situation and needs of any specific person who may receive it. Please be aware, that past performance is not a reliable indicator of future performance and/or results. Past Performance or Forward-looking scenarios based upon the reasonable beliefs of the third-party provider are not a guarantee of future performance. Actual results may differ materially from those anticipated in forward-looking or past performance statements. IC Markets makes no representation or warranty and assumes no liability as to the accuracy or completeness of the information provided, nor any loss arising from any investment based on a recommendation, forecast or any information supplied by any third-party.

Bearish reversal?US Dollar Index (DXY) has reacted off the pivot and could drop to the 1st support.
Pivot: 98.89
1st Support: 98.29
1st Resistance: 99.60
Risk Warning:
Trading Forex and CFDs carries a high level of risk to your capital and you should only trade with money you can afford to lose. Trading Forex and CFDs may not be suitable for all investors, so please ensure that you fully understand the risks involved and seek independent advice if necessary.
Disclaimer:
The above opinions given constitute general market commentary, and do not constitute the opinion or advice of IC Markets or any form of personal or investment advice.
Any opinions, news, research, analyses, prices, other information, or links to third-party sites contained on this website are provided on an "as-is" basis, are intended only to be informative, is not an advice nor a recommendation, nor research, or a record of our trading prices, or an offer of, or solicitation for a transaction in any financial instrument and thus should not be treated as such. The information provided does not involve any specific investment objectives, financial situation and needs of any specific person who may receive it. Please be aware, that past performance is not a reliable indicator of future performance and/or results. Past Performance or Forward-looking scenarios based upon the reasonable beliefs of the third-party provider are not a guarantee of future performance. Actual results may differ materially from those anticipated in forward-looking or past performance statements. IC Markets makes no representation or warranty and assumes no liability as to the accuracy or completeness of the information provided, nor any loss arising from any investment based on a recommendation, forecast or any information supplied by any third-party.

Missiles in the Middle East, Headwinds on Nasdaq: NAS100 onHey There;
The trend line on the NAS100 has been broken to the downside. My target level after this breakout is 21,299.47. If the price moves towards this level, I think it will reach my target in line with fundamental analysis due to the broken trend line and Iran-Israel war tensions.
I meticulously prepare these analyses for you, and I sincerely appreciate your support through likes. Every like from you is my biggest motivation to continue sharing my analyses.
I’m truly grateful for each of you—love to all my followers💙💙💙

USDCAD SHORT IDEA- USDCAD Is EXTREMELY WEAK AND READY FOR SELLOANDA:USDCAD USDCAD Is extremely weak I expect price to drop hard from here.
TRADE BREAKDOWN
Weekly Trend is Bearish.
Daily Trend is Bearish.
4H Trend is also Bearish.
This is 100% a trend following strategy trade.
The entry is taken on 4H time frame targeting the recent weekly swing low.
This is a 4RR Trade.


Gold (XAUUSD) – Demand Zone Holding, Silver Leading BreakoutGold has respected its demand zone near $3,367–$3,382 and is attempting to bounce higher. Importantly, Silver (XAGUSD in pink overlay) is leading the upside move, having broken out cleanly above $37.00 and still climbing. This confirms the bullish momentum across precious metals.
Geopolitical tensions, dovish Fed commentary, and risk-off market conditions continue to favor a move toward $3,451, $3,471, and possibly $3,495.
🔍 Technical Breakdown (4H)
Support Zone: $3,367–$3,382 (retest of broken resistance)
Bullish Structure: Rising lows, trendline holds, and higher timeframe support remains intact
Projected Targets:
🎯 TP1: $3,451 (recent high)
🎯 TP2: $3,471 (key extension)
🎯 TP3: $3,495 (top of range)
Stop Loss: Below $3,351 (invalidates demand structure)
🪙 Silver (XAGUSD) Overlay Insight:
Currently at $37.11+, showing leadership in the breakout.
Suggests gold will likely follow through — watch for Gold catching up.
🧠 Macro & Fundamental Context (June 17)
Bullish Drivers:
🔥 Ongoing Middle East war escalation (Iran-Israel, US troop buildup)
🏦 Dovish Fed tone, soft retail sales, rate cuts expected from Sept
🧾 Silver strength confirming demand across metals
Risks:
☮️ Unexpected ceasefire headlines could cause knee-jerk pullbacks
📈 Hot inflation data or hawkish Fed rhetoric could pressure upside
📅 Key Events to Watch:
FOMC members' speeches this week
US Core PCE inflation print
War headline velocity — particularly involving shipping or direct US-Iran confrontation
🧭 Strategy Suggestion:
Tactical Buy on Rejection Wick from current demand zone
Watch Silver momentum — if it breaks $37.50+, gold likely catches up fast
Consider scaling out around $3,451–$3,471 with final target near $3,495

Opportunity for selling EURUSDI see that EURUSD has confirmed strong resistance, so I took a sell trade with it.

Could the Aussie bounce from here?The price is falling towards the support level which is an overlap support that is slightly below the 61.8% Fibonacci retracement and could reverse from this level to our take profit.
Entry: 0.6455
Why we like it:
There is an overlap support that is slightly below the 61.8% Fibonacci retracement.
Stop loss: 0.6407
Why we like it:
There is a pullback support that aligns with the 145% Fibonacci extension.
Take profit: 0.6513
Why we like it:
There is an overlap resistance.
Enjoying your TradingView experience? Review us!
Please be advised that the information presented on TradingView is provided to Vantage (‘Vantage Global Limited’, ‘we’) by a third-party provider (‘Everest Fortune Group’). Please be reminded that you are solely responsible for the trading decisions on your account. There is a very high degree of risk involved in trading. Any information and/or content is intended entirely for research, educational and informational purposes only and does not constitute investment or consultation advice or investment strategy. The information is not tailored to the investment needs of any specific person and therefore does not involve a consideration of any of the investment objectives, financial situation or needs of any viewer that may receive it. Kindly also note that past performance is not a reliable indicator of future results. Actual results may differ materially from those anticipated in forward-looking or past performance statements. We assume no liability as to the accuracy or completeness of any of the information and/or content provided herein and the Company cannot be held responsible for any omission, mistake nor for any loss or damage including without limitation to any loss of profit which may arise from reliance on any information supplied by Everest Fortune Group.

Potential bullish rise?USD/CAD has reacted off the resistance level and could rise from this level to our take profit.
Entry: 1.3603
Why we like it:
There is a pullback resistance level.
Stop loss: 1.3540
Why we like it:
There is a pullback support level.
Take profit: 1.3704
Why we like it:
There is an overlap resistance level that lines up with the 50% Fibonacci retracement.
Enjoying your TradingView experience? Review us!
Please be advised that the information presented on TradingView is provided to Vantage (‘Vantage Global Limited’, ‘we’) by a third-party provider (‘Everest Fortune Group’). Please be reminded that you are solely responsible for the trading decisions on your account. There is a very high degree of risk involved in trading. Any information and/or content is intended entirely for research, educational and informational purposes only and does not constitute investment or consultation advice or investment strategy. The information is not tailored to the investment needs of any specific person and therefore does not involve a consideration of any of the investment objectives, financial situation or needs of any viewer that may receive it. Kindly also note that past performance is not a reliable indicator of future results. Actual results may differ materially from those anticipated in forward-looking or past performance statements. We assume no liability as to the accuracy or completeness of any of the information and/or content provided herein and the Company cannot be held responsible for any omission, mistake nor for any loss or damage including without limitation to any loss of profit which may arise from reliance on any information supplied by Everest Fortune Group.

Bullish bounce off overlap support?GBP/USD is falling towards the support level which is an overlap support that aligns with the 38.2% Fibonacci retracement and could bounce from this level to our take profit.
Entry: 1.3443
Why we like it:
There is an overlap support level.
Stop loss: 1.3359
Why we like it:
There is a pullback support that is slightly below the 50% Fibonacci retracement.
Take profit: 1.3530
Why we like it:
There is a pullback resistance level.
njoying your TradingView experience? Review us!
Please be advised that the information presented on TradingView is provided to Vantage (‘Vantage Global Limited’, ‘we’) by a third-party provider (‘Everest Fortune Group’). Please be reminded that you are solely responsible for the trading decisions on your account. There is a very high degree of risk involved in trading. Any information and/or content is intended entirely for research, educational and informational purposes only and does not constitute investment or consultation advice or investment strategy. The information is not tailored to the investment needs of any specific person and therefore does not involve a consideration of any of the investment objectives, financial situation or needs of any viewer that may receive it. Kindly also note that past performance is not a reliable indicator of future results. Actual results may differ materially from those anticipated in forward-looking or past performance statements. We assume no liability as to the accuracy or completeness of any of the information and/or content provided herein and the Company cannot be held responsible for any omission, mistake nor for any loss or damage including without limitation to any loss of profit which may arise from reliance on any information supplied by Everest Fortune Group.

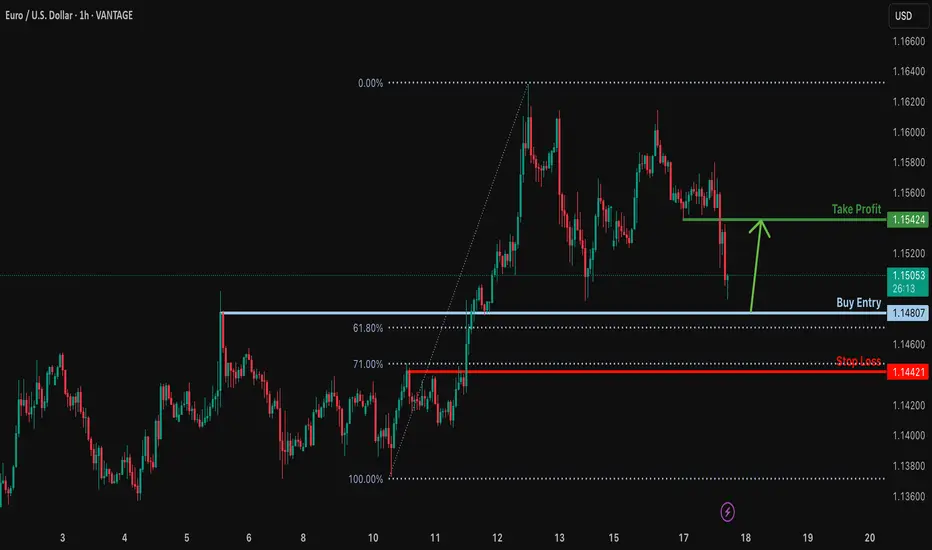
Bullish bounce?EUR/USD is falling towards the support level which is an overlap support that is slightly above the 61.8% Fibonacci retracement and could bounce from this level to our take profit.
Entry: 1.1480
Why we like it:
There is an overlap support that is slightly above the 61.8% Fibonacci retracement.
Stop loss: 1.1438
Why we like it:
There is a pullback support level that lines up with the 71% Fibonacci retracement.
Take profit: 1.1542
Why we like it:
There is a pullback resistance.
njoying your TradingView experience? Review us!
Please be advised that the information presented on TradingView is provided to Vantage (‘Vantage Global Limited’, ‘we’) by a third-party provider (‘Everest Fortune Group’). Please be reminded that you are solely responsible for the trading decisions on your account. There is a very high degree of risk involved in trading. Any information and/or content is intended entirely for research, educational and informational purposes only and does not constitute investment or consultation advice or investment strategy. The information is not tailored to the investment needs of any specific person and therefore does not involve a consideration of any of the investment objectives, financial situation or needs of any viewer that may receive it. Kindly also note that past performance is not a reliable indicator of future results. Actual results may differ materially from those anticipated in forward-looking or past performance statements. We assume no liability as to the accuracy or completeness of any of the information and/or content provided herein and the Company cannot be held responsible for any omission, mistake nor for any loss or damage including without limitation to any loss of profit which may arise from reliance on any information supplied by Everest Fortune Group.
Dollar consolidating - Still long term bearishLets see if the Daily Volume imbalance can hold price lower here. If it breaks higher then the clean highs will be a target for a sweep then return lower again. FOMC Tomorrow!! Stay safe

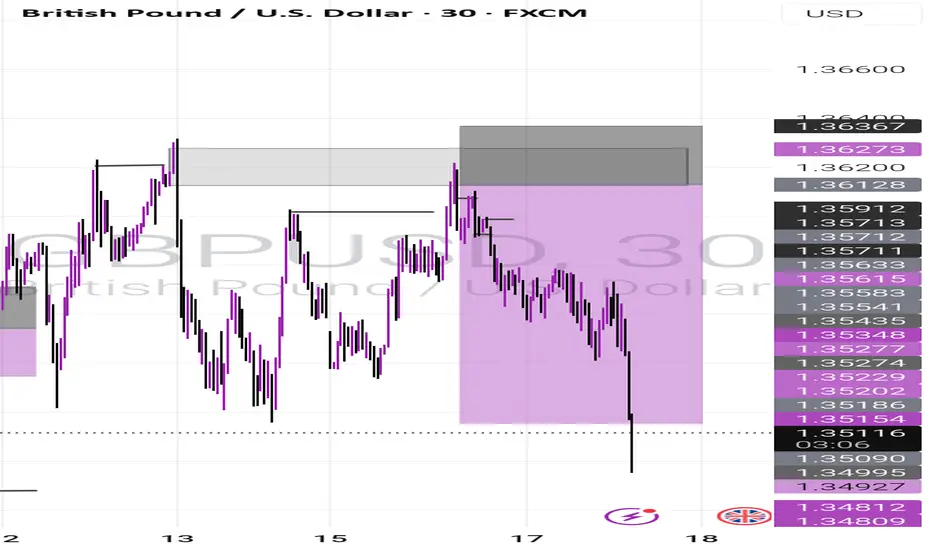
Target hit Last post I talked about the bearish momentum which gbpusd had and how it will follow up the chart. I'm now done for the day, anticipate more sell till it reaches my buy zone
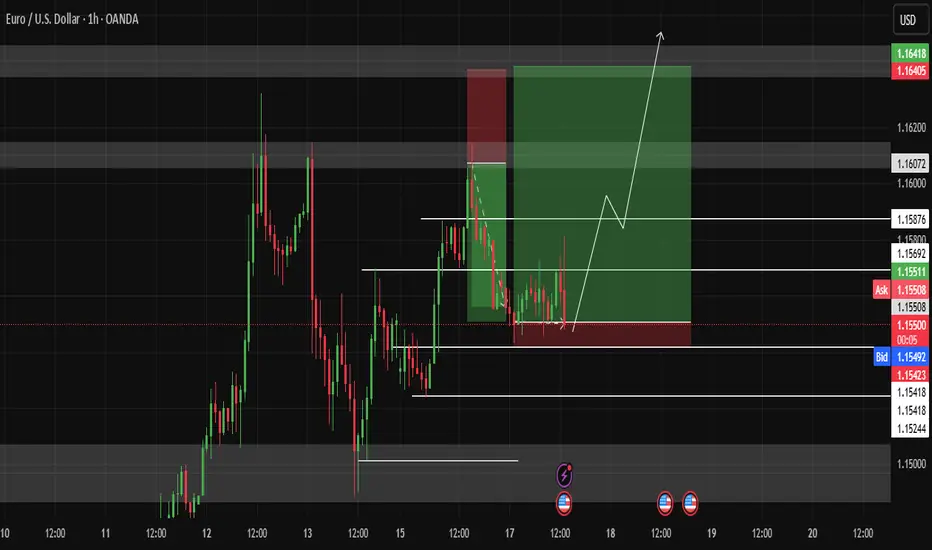
buying EURUSD (update) 1:10 RREURUSD touched strong support, so I think it will rise further, as shown.
USDCHF LONG FORECAST Q2 W25 D17 Y25USDCHF LONG FORECAST Q2 W25 D17 Y25
Professional Risk Managers👋
Welcome back to another FRGNT chart update📈
Diving into some Forex setups using predominantly higher time frame order blocks alongside intraday confirmation & breaks of structure.
Let’s see what price action is telling us today! 🔥
💡Here are some trade confluences📝
✅Weekly order block rejection
✅Daily order block rejection
✅15’ order block
✅Intraday bullish breaks of structure
🔑 Remember, to participate in trading comes always with a degree of risk, therefore as professional risk managers it remains vital that we stick to our risk management plan as well as our trading strategies.
📈The rest, we leave to the balance of probabilities.
💡Fail to plan. Plan to fail.
🏆It has always been that simple.
❤️Good luck with your trading journey, I shall see you at the very top.
🎯Trade consistent, FRGNT X

USDJPYHello Traders! 👋
What are your thoughts on USDJPY?
On the USD/JPY chart, price is currently moving within a symmetrical triangle pattern and is approaching the upper trendline and a key resistance zone.
We expect that upon testing this resistance level, price will likely fail to break above it and enter a bearish phase, potentially falling at least to the specified support level.
For higher-confidence sell entries, it’s recommended to wait for a confirmed downside break of the lower trendline of the triangle, which would validate a bearish continuation.
Will this resistance hold and trigger a drop, or will bulls take control? Share your thoughts below! 🤔👇
Don’t forget to like and share your thoughts in the comments! ❤️

AUDCAD: Pullback From Resistance Confirmed 🇦🇺🇨🇦
AUDCAD is going to retrace from a key intraday horizontal resistance.
A local bearish CHoCH and an imbalance on an hourly time frame
provide a strong bearish confirmation.
Goal - 0.88445
❤️Please, support my work with like, thank you!❤️
I am part of Trade Nation's Influencer program and receive a monthly fee for using their TradingView charts in my analysis.

XAU/USD Bullish Setup Confirmed After Wave C CompletionXAU/USD has completed a classic five-wave impulsive structure to the upside, followed by a clear ABC corrective phase. The price action shows that wave (5) has topped, and the market has since retraced through a three-wave ABC correction inside a well-defined descending channel.
Currently, wave C appears to have found support right at the lower trendline of the broader ascending structure, signaling a potential completion of the correction and the beginning of a new bullish impulse.
The reaction from this level is strong, suggesting that buyers are stepping in to drive the next leg higher
Wave Count: 5-wave impulse up, followed by ABC correction
Structure: Wave C completed at key channel support
Momentum: Bullish recovery expected if price holds above recent swing low
T1: 3332.268
T2: 3354.078
SL: 3289.400

Gold Market Update – Technical Breakdown in FocusGold has broken below the ABCD harmonic pattern structure, a classic sign of a potential trend reversal. This bearish move is now approaching the critical support at $3385, which has acted as a structural pivot in past sessions.
Adding to this bearish outlook, the Momentum oscillator has crossed decisively below the 100-line, confirming a shift in directional strength and reinforcing downside potential.
🔽 TradeIdea – XAUUSD Short Setup
Entry Trigger: Initiate short positions only if price closes below $3385 on strong volume.
Take-Profit Target: $3360 – near the lower harmonic projection and previous demand zone.
Stop-Loss Idea: Above $3412 (structure invalidation level)
This setup aligns with both pattern-based analysis and momentum confirmation, increasing confidence for short-term bearish continuation.
