Bullish bounce off pullback support?USD/JPY is falling towards the support level which is a pullback support that os slightly above the 23.6% Fibonacci retracement and could bounce from this level to our take profit.
Entry: 144.27
Why we like it:
There is a pullback support level that is slightly above the 23.6% Fibonacci retracement.
Stop loss: 143.36
Why we like it:
There is an overlap support level that is slightly below the 61.8% Fibonacci retracement.
Take profit: 146.07
Why we like it:
There is a pullback resistance level.
Enjoying your TradingView experience? Review us!
Please be advised that the information presented on TradingView is provided to Vantage (‘Vantage Global Limited’, ‘we’) by a third-party provider (‘Everest Fortune Group’). Please be reminded that you are solely responsible for the trading decisions on your account. There is a very high degree of risk involved in trading. Any information and/or content is intended entirely for research, educational and informational purposes only and does not constitute investment or consultation advice or investment strategy. The information is not tailored to the investment needs of any specific person and therefore does not involve a consideration of any of the investment objectives, financial situation or needs of any viewer that may receive it. Kindly also note that past performance is not a reliable indicator of future results. Actual results may differ materially from those anticipated in forward-looking or past performance statements. We assume no liability as to the accuracy or completeness of any of the information and/or content provided herein and the Company cannot be held responsible for any omission, mistake nor for any loss or damage including without limitation to any loss of profit which may arise from reliance on any information supplied by Everest Fortune Group.
Forexsignals

Bullish rise?USD/CAD is reacting off the resistance level which is a pullback resistance and could potentially rise from this level to our take profit.
Entry: 1.3691
Why we like it:
There is a pullback resistance level.
Stop loss: 1.365
Why we like it:
There is a pullback support level.
Take profit: 1.3742
Why we like it:
There is a pullback resistance level.
Enjoying your TradingView experience? Review us!
Please be advised that the information presented on TradingView is provided to Vantage (‘Vantage Global Limited’, ‘we’) by a third-party provider (‘Everest Fortune Group’). Please be reminded that you are solely responsible for the trading decisions on your account. There is a very high degree of risk involved in trading. Any information and/or content is intended entirely for research, educational and informational purposes only and does not constitute investment or consultation advice or investment strategy. The information is not tailored to the investment needs of any specific person and therefore does not involve a consideration of any of the investment objectives, financial situation or needs of any viewer that may receive it. Kindly also note that past performance is not a reliable indicator of future results. Actual results may differ materially from those anticipated in forward-looking or past performance statements. We assume no liability as to the accuracy or completeness of any of the information and/or content provided herein and the Company cannot be held responsible for any omission, mistake nor for any loss or damage including without limitation to any loss of profit which may arise from reliance on any information supplied by Everest Fortune Group.

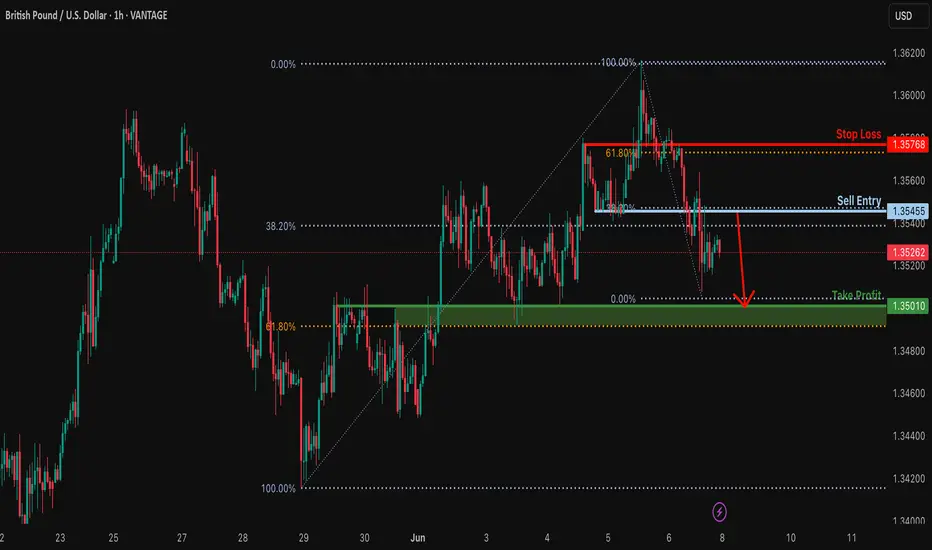
Potential bearish drop?GBP/USD is rising towards the resistance level which is an overlap resistance that lines up with the 38.2% Fibonacci retracement and could drop from this level to our take profit.
Entry: 1.3545
Why we like it:
There is an overlap resistance that aligns with the 48.2% Fibonacci retracement.
Stop loss: 1.3576
Why we like it:
There is a pullback resistance level that lines up with the 61.8% Fibonacci retracement.
Take profit: 1.3501
Why we like it:
There is an overlap support level that is slightly above the 61.8% Fibonacci retracement.
Enjoying your TradingView experience? Review us!
Please be advised that the information presented on TradingView is provided to Vantage (‘Vantage Global Limited’, ‘we’) by a third-party provider (‘Everest Fortune Group’). Please be reminded that you are solely responsible for the trading decisions on your account. There is a very high degree of risk involved in trading. Any information and/or content is intended entirely for research, educational and informational purposes only and does not constitute investment or consultation advice or investment strategy. The information is not tailored to the investment needs of any specific person and therefore does not involve a consideration of any of the investment objectives, financial situation or needs of any viewer that may receive it. Kindly also note that past performance is not a reliable indicator of future results. Actual results may differ materially from those anticipated in forward-looking or past performance statements. We assume no liability as to the accuracy or completeness of any of the information and/or content provided herein and the Company cannot be held responsible for any omission, mistake nor for any loss or damage including without limitation to any loss of profit which may arise from reliance on any information supplied by Everest Fortune Group.
Bearish drop?EUR/USD is rising towards the resistance level which is a pullback resistance that lines up with the 23.6% Fibonacci retracement and could drop from this level to our take profit.
Entry: 1.1406
Why we like it:
There is a pullback resistance level that lines up with the 23.6% Fibonacci retracement.
Stop loss: 1.1433
Why we like it:
There is a pullback resistance level that lines up with the 50% Fibonacci retracement.
Take profit: 1.1358
Why we like it:
There is a pullback support level that aligns with the 50% Fibonacci retracement.
Enjoying your TradingView experience? Review us!
Please be advised that the information presented on TradingView is provided to Vantage (‘Vantage Global Limited’, ‘we’) by a third-party provider (‘Everest Fortune Group’). Please be reminded that you are solely responsible for the trading decisions on your account. There is a very high degree of risk involved in trading. Any information and/or content is intended entirely for research, educational and informational purposes only and does not constitute investment or consultation advice or investment strategy. The information is not tailored to the investment needs of any specific person and therefore does not involve a consideration of any of the investment objectives, financial situation or needs of any viewer that may receive it. Kindly also note that past performance is not a reliable indicator of future results. Actual results may differ materially from those anticipated in forward-looking or past performance statements. We assume no liability as to the accuracy or completeness of any of the information and/or content provided herein and the Company cannot be held responsible for any omission, mistake nor for any loss or damage including without limitation to any loss of profit which may arise from reliance on any information supplied by Everest Fortune Group.

EURUSD LIVE TRADEHello friends
Since the price has reached the specified important resistance, a correction in the price is expected. Therefore, you can enter the position with capital and risk management and move with it to the specified goals.
*Trade safely with us*

CAD/JPY "Loonie-Yen" Forex Bank Bullish Heist Plan🌟Hi! Hola! Ola! Bonjour! Hallo! Marhaba!🌟
Dear Money Makers & Robbers, 🤑 💰💸✈️
Based on 🔥Thief Trading style technical and fundamental analysis🔥, here is our master plan to heist the CAD/JPY "Loonie-Yen" Forex Bank. Please adhere to the strategy I've outlined in the chart, which emphasizes long entry. Our aim is the high-risk Red Zone. Risky level, overbought market, consolidation, trend reversal, trap at the level where traders and bearish robbers are stronger. 🏆💸Book Profits Be wealthy and safe trade.💪🏆🎉
Entry 📈 : "The vault is wide open! Swipe the Bullish loot at any price - the heist is on!
however I advise to Place buy limit orders within a 15 or 30 minute timeframe most recent or swing, low or high level for pullback entries
Stop Loss 🛑:
Thief SL placed at the recent / nearest low level Using the 30Min timeframe (104.800) swing trade basis.
SL is based on your risk of the trade, lot size and how many multiple orders you have to take.
🏴☠️Target 🎯: 106.000 (or) Escape Before the Target
🧲Scalpers, take note 👀 : only scalp on the Long side. If you have a lot of money, you can go straight away; if not, you can join swing traders and carry out the robbery plan. Use trailing SL to safeguard your money 💰.
CAD/JPY "Loonie-Yen" Forex Market Heist Plan (Scalping / Day Trade) is currently experiencing a bullishness,., driven by several key factors.☝🏻👆🏻☝🏻👆🏻
📰🗞️Get & Read the Fundamental, Macro, COT Report, Quantitative Analysis, Sentimental Outlook, Intermarket Analysis, Future trend targets..., go ahead to check 👉👉👉🔗
📌Keep in mind that these factors can change rapidly, and it's essential to stay up-to-date with market developments and adjust your analysis accordingly.
⚠️Trading Alert : News Releases and Position Management 📰 🗞️ 🚫🚏
As a reminder, news releases can have a significant impact on market prices and volatility. To minimize potential losses and protect your running positions,
we recommend the following:
Avoid taking new trades during news releases
Use trailing stop-loss orders to protect your running positions and lock in profits
💖Supporting our robbery plan 💥Hit the Boost Button💥 will enable us to effortlessly make and steal money 💰💵. Boost the strength of our robbery team. Every day in this market make money with ease by using the Thief Trading Style.🏆💪🤝❤️🎉🚀
I'll see you soon with another heist plan, so stay tuned 🤑🐱👤🤗🤩

EURUSD: Bullish Continuation is Expected! Here is Why:
Our strategy, polished by years of trial and error has helped us identify what seems to be a great trading opportunity and we are here to share it with you as the time is ripe for us to buy EURUSD.
Disclosure: I am part of Trade Nation's Influencer program and receive a monthly fee for using their TradingView charts in my analysis.
❤️ Please, support our work with like & comment! ❤️

USDJPY: Bullish Outlook For Next Week Explained 🇺🇸🇯🇵
USDJPY completed a consolidation, violating
a resistance line of a horizontal range on a 4H time frame.
I believe that it provides a strong bullish confirmation signal.
The price will most likely go up and reach 146.0 level next week.
❤️Please, support my work with like, thank you!❤️
I am part of Trade Nation's Influencer program and receive a monthly fee for using their TradingView charts in my analysis.

ETHUSD KEY LEVEL.This is the 4 hour chart of ETHUSD.
ETHUSD is currently consolidating in a well defined range.
If the lower boundary of the zone is sustainable ,then we see again higher prices in ETHUSD.
Thank you !!

Gold Rejected Below $3370 — Eyes on Lower Demand Zones! (READ)By examining the gold chart on the 4-hour timeframe, we can see that after our previous analysis, the price climbed to $3388, giving us nearly 150 pips of return. However, gold was rejected from that level and failed to hold above $3370, eventually dropping below $3360.
Currently, gold is trading around $3348, and we may likely see further decline toward lower levels. The potential downside targets are $3338, $3332, $3326, and $3317.
Key demand zones to watch are:
→ $3327
→ $3311
→ $3298–$3300
→ $3278
Please support me with your likes and comments to motivate me to share more analysis with you and share your opinion about the possible trend of this chart with me !
Best Regards , Arman Shaban

EURJPY Be ready to sell soon.Last time we looked at the EURJPY pair (February 26, see chart below), we gave a clear buy signal that wasted no time hitting straight our 162.250 Target:
With the Lower Highs trend-line now broken, a new pattern has emerged and that's a (blue) Channel Up. The current Bullish Leg is headed straight to the 8-month Resistance Zone, so we will be turning bearish there, targeting the 1D MA200 (orange trend-line) at 162.250.
-------------------------------------------------------------------------------
** Please LIKE 👍, FOLLOW ✅, SHARE 🙌 and COMMENT ✍ if you enjoy this idea! Also share your ideas and charts in the comments section below! This is best way to keep it relevant, support us, keep the content here free and allow the idea to reach as many people as possible. **
-------------------------------------------------------------------------------
💸💸💸💸💸💸
👇 👇 👇 👇 👇 👇

EURUSD Analysis – Short Bias Builds on Key Resistance RejectionEURUSD pair is currently testing a critical resistance zone around 1.1495–1.1500, with bearish rejection beginning to form on the 4H timeframe. The technical setup suggests a potential lower high forming within the context of a broader downtrend, supported by a confluence of horizontal resistance and bearish risk catalysts.
🔍 Technical Overview:
Resistance Zone: 1.1495–1.1575 (multi-timeframe key levels)
Support Levels to Watch: 1.1234 (range base) and 1.1086 (swing low)
Price Action: After a sustained rally, price is showing exhaustion near previous highs, and a rejection pattern is emerging, suggesting selling interest.
Risk Management: Stop placed above 1.1575 high, with downside targets near 1.1234 and extended toward 1.1086.
🧠 Fundamental Backdrop:
ECB Policy Outlook: Lagarde recently warned that a stronger euro and higher tariffs may hurt EU exports. This dovish tone could weigh on EUR sentiment in the medium term.
US Dollar Strengthening: The latest US labor market data (ADP, JOLTS) beat expectations, showing continued resilience in employment and wage growth. This supports the Fed's data-dependent approach, favoring a stronger USD.
Macro Tensions: Global trade concerns (Trump’s tariffs, weak China demand, Germany’s slowing job market) are adding pressure to EUR while supporting safe-haven USD flows.
ECB Consumer Expectations Survey (April): Highlights persistent inflation fears and deteriorating economic confidence.
⏳ Scenario Outlook:
✅ Bearish Bias Preferred below 1.1500 with confirmation of rejection.
🎯 Target Zone 1: 1.1234 – Strong structure & demand zone.
🎯 Target Zone 2 (Extended): 1.1086 – Major low from mid-May.
❌ Invalidation: A breakout and close above 1.1575 would neutralize the bearish outlook and open up higher targets toward 1.17.
Conclusion: The EURUSD pair presents a compelling short opportunity, with both technical resistance and macro pressure aligning for a retracement or reversal. Short setups are favored unless bulls reclaim and hold above the 1.1575 handle.

GBPUSD Approaches Key Resistance: Watch for Bearish ReversalGBPUSD pair is trading within a clearly defined ascending channel on the 1-hour chart, showing a short-term bullish structure. However, this bullish move appears corrective within a broader consolidation range capped near the 1.3590 resistance zone.
🔍 Technical Breakdown:
Current Price: 1.35535
Immediate Resistance: 1.35885–1.35929 (previous highs and psychological level)
Support Levels:
Trendline support near 1.3530
Horizontal support: 1.34282, 1.34176
Structure:
Price has formed a bullish flag breakout and is now approaching key resistance.
A new higher high is anticipated toward 1.3590, but this level has repeatedly rejected price in the past.
The projected path indicates a potential liquidity grab above 1.3590 followed by a sell-off toward 1.3420–1.3410 area, aligning with a trendline break scenario.
Bearish Scenario:
A strong rejection from the 1.3590 zone, especially if accompanied by bearish divergence or a strong candle close, could trigger a shift back down to the 1.3417–1.3428 support zone.
This would confirm a short-term top and potential retracement toward lower liquidity zones.
📊 Fundamental Backdrop:
USD-side:
Recent U.S. labor market strength (e.g. ADP report and low jobless claims) supports a hawkish bias, favoring USD upside.
However, Fed policymakers remain cautious due to trade tensions and tariff uncertainty. This has injected short-term volatility into USD pairs.
GBP-side:
UK economic data has been mixed, with GDP growth forecasts under scrutiny.
BoE policymakers are dovish, emphasizing weak productivity and wage pressures, making the pound vulnerable to downside catalysts.
📌 Conclusion:
Watch for a potential bull trap near 1.3590, followed by a bearish reversal toward 1.3420–1.3410 if momentum weakens and sellers step in. This would complete the expected technical leg down and align with broader risk sentiment if dollar strength returns.

NZDJPY: Another Bearish YEN Pair 🇳🇿🇯🇵
One more YEN pair that looks bearish to me is NZDJPY.
I see 2 bearish price action confirmations after a test
of the underlined horizontal resistances:
the price broke a support line of a rising wedge pattern
and a neckline of a double top.
The price may drop now to 86.66 level.
❤️Please, support my work with like, thank you!❤️
I am part of Trade Nation's Influencer program and receive a monthly fee for using their TradingView charts in my analysis.

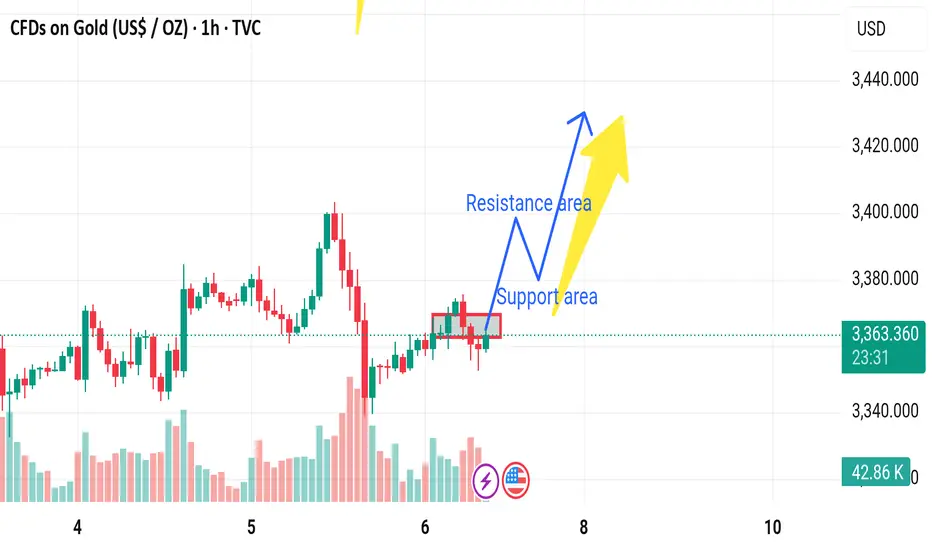
Market next move Bearish Disruption Analysis:
1. False Breakout Risk:
The current price is consolidating in a tight range.
The support area may fail to hold due to low volume and indecision (notice the decreasing volume in recent candles).
2. Lower High Formation:
A potential lower high is forming compared to the peak from earlier on June 5.
This could signal a trend reversal or weakening bullish momentum.
3. Volume Divergence:
The bullish candles have lower volume than previous strong moves, indicating a lack of strong buying interest.
4. Support Breakdown Scenario:
If price breaks below the marked support area (~3360), we could see:
Drop toward the 3340 area (next visible support).
Acceleration if stop-losses are triggered below the support zone.
Hellena | SPX500 (4H): LONG resistance area of 6176.6.Colleagues, it appears that price has not yet completed the upward movement in a five-wave move.
At the moment I expect the continuation of wave “3” and reaching the target in the resistance area of 6176.6.
Manage your capital correctly and competently! Only enter trades based on reliable patterns!

EURO-USD BUY STRONG 1. "EUR/USD Strong Buy Alert 🚀 | Key support zone holding firm – bulls eyeing the next leg up!"
2. "Strong Buy Zone ✅ | EUR/USD showing bullish momentum from this support level – eyes on 1.09+"
3. "EUR/USD Reversal Zone 💥 | Buyers stepping in strong – potential rally ahead!"
4. "Watch this zone! EUR/USD strong buy setup forming – bullish confirmation underway 📈"
5. "EUR/USD bouncing from key demand zone 🔥 | Technicals align for a strong buy signal!"

AUDJPY: Pullback Confirmed?! 🇦🇺🇯🇵
There is a high chance that AUDJPY will pull back
from the underlined resistance cluster.
Its false violation, a formation of a bearish imbalance candle
and a breakout of a rising trend line provide strong bearish confirmation.
Goal - 93.185
❤️Please, support my work with like, thank you!❤️
I am part of Trade Nation's Influencer program and receive a monthly fee for using their TradingView charts in my analysis.

Potential bearish drop for the Loonie?The price is rising towards the pivot, which is an overlap resistance, and could drop to the 1st support.
Pivot: 1.3683
1st Support: 1.3590
1st Resistance: 1.3707
Risk Warning:
Trading Forex and CFDs carries a high level of risk to your capital and you should only trade with money you can afford to lose. Trading Forex and CFDs may not be suitable for all investors, so please ensure that you fully understand the risks involved and seek independent advice if necessary.
Disclaimer:
The above opinions given constitute general market commentary, and do not constitute the opinion or advice of IC Markets or any form of personal or investment advice.
Any opinions, news, research, analyses, prices, other information, or links to third-party sites contained on this website are provided on an "as-is" basis, are intended only to be informative, is not an advice nor a recommendation, nor research, or a record of our trading prices, or an offer of, or solicitation for a transaction in any financial instrument and thus should not be treated as such. The information provided does not involve any specific investment objectives, financial situation and needs of any specific person who may receive it. Please be aware, that past performance is not a reliable indicator of future performance and/or results. Past Performance or Forward-looking scenarios based upon the reasonable beliefs of the third-party provider are not a guarantee of future performance. Actual results may differ materially from those anticipated in forward-looking or past performance statements. IC Markets makes no representation or warranty and assumes no liability as to the accuracy or completeness of the information provided, nor any loss arising from any investment based on a recommendation, forecast or any information supplied by any third-party.

Bullish rise off pullback support?USD/JPY has bounced off the pivot and could rise to the 1st resistance that aligns with the 61.8% Fibonacci projection.
Pivot: 143.45
1st Support: 143.08
1st Resistance: 144.42
Risk Warning:
Trading Forex and CFDs carries a high level of risk to your capital and you should only trade with money you can afford to lose. Trading Forex and CFDs may not be suitable for all investors, so please ensure that you fully understand the risks involved and seek independent advice if necessary.
Disclaimer:
The above opinions given constitute general market commentary, and do not constitute the opinion or advice of IC Markets or any form of personal or investment advice.
Any opinions, news, research, analyses, prices, other information, or links to third-party sites contained on this website are provided on an "as-is" basis, are intended only to be informative, is not an advice nor a recommendation, nor research, or a record of our trading prices, or an offer of, or solicitation for a transaction in any financial instrument and thus should not be treated as such. The information provided does not involve any specific investment objectives, financial situation and needs of any specific person who may receive it. Please be aware, that past performance is not a reliable indicator of future performance and/or results. Past Performance or Forward-looking scenarios based upon the reasonable beliefs of the third-party provider are not a guarantee of future performance. Actual results may differ materially from those anticipated in forward-looking or past performance statements. IC Markets makes no representation or warranty and assumes no liability as to the accuracy or completeness of the information provided, nor any loss arising from any investment based on a recommendation, forecast or any information supplied by any third-party.

Falling towards pullback support?The Aussie (AUD/USD) is falling towards the pivot, which acts as a pullback support and could bounce to the 1st resistance, which has been identified as a pullback resistance.
Pivot: 0.6487
1st Support: 0.6472
1st Resistance: 0.6528
Risk Warning:
Trading Forex and CFDs carries a high level of risk to your capital and you should only trade with money you can afford to lose. Trading Forex and CFDs may not be suitable for all investors, so please ensure that you fully understand the risks involved and seek independent advice if necessary.
Disclaimer:
The above opinions given constitute general market commentary, and do not constitute the opinion or advice of IC Markets or any form of personal or investment advice.
Any opinions, news, research, analyses, prices, other information, or links to third-party sites contained on this website are provided on an "as-is" basis, are intended only to be informative, is not an advice nor a recommendation, nor research, or a record of our trading prices, or an offer of, or solicitation for a transaction in any financial instrument and thus should not be treated as such. The information provided does not involve any specific investment objectives, financial situation and needs of any specific person who may receive it. Please be aware, that past performance is not a reliable indicator of future performance and/or results. Past Performance or Forward-looking scenarios based upon the reasonable beliefs of the third-party provider are not a guarantee of future performance. Actual results may differ materially from those anticipated in forward-looking or past performance statements. IC Markets makes no representation or warranty and assumes no liability as to the accuracy or completeness of the information provided, nor any loss arising from any investment based on a recommendation, forecast or any information supplied by any third-party.

Bullish continuation?The Cable (GBP/USD) is falling towards the pivot, which is an overlap support and could rise to the 1st resistance.
Pivot: 1.3507
1st Support: 1.3420
1st Resistance: 1.3644
Risk Warning:
Trading Forex and CFDs carries a high level of risk to your capital and you should only trade with money you can afford to lose. Trading Forex and CFDs may not be suitable for all investors, so please ensure that you fully understand the risks involved and seek independent advice if necessary.
Disclaimer:
The above opinions given constitute general market commentary, and do not constitute the opinion or advice of IC Markets or any form of personal or investment advice.
Any opinions, news, research, analyses, prices, other information, or links to third-party sites contained on this website are provided on an "as-is" basis, are intended only to be informative, is not an advice nor a recommendation, nor research, or a record of our trading prices, or an offer of, or solicitation for a transaction in any financial instrument and thus should not be treated as such. The information provided does not involve any specific investment objectives, financial situation and needs of any specific person who may receive it. Please be aware, that past performance is not a reliable indicator of future performance and/or results. Past Performance or Forward-looking scenarios based upon the reasonable beliefs of the third-party provider are not a guarantee of future performance. Actual results may differ materially from those anticipated in forward-looking or past performance statements. IC Markets makes no representation or warranty and assumes no liability as to the accuracy or completeness of the information provided, nor any loss arising from any investment based on a recommendation, forecast or any information supplied by any third-party.

Bullish bounce?US Dollar Index (DXY) has bounced off the pivot and could rise to the 1st resistance.
Pivot: 98.36
1st Support: 97.98
1st Resistance: 99.23
Risk Warning:
Trading Forex and CFDs carries a high level of risk to your capital and you should only trade with money you can afford to lose. Trading Forex and CFDs may not be suitable for all investors, so please ensure that you fully understand the risks involved and seek independent advice if necessary.
Disclaimer:
The above opinions given constitute general market commentary, and do not constitute the opinion or advice of IC Markets or any form of personal or investment advice.
Any opinions, news, research, analyses, prices, other information, or links to third-party sites contained on this website are provided on an "as-is" basis, are intended only to be informative, is not an advice nor a recommendation, nor research, or a record of our trading prices, or an offer of, or solicitation for a transaction in any financial instrument and thus should not be treated as such. The information provided does not involve any specific investment objectives, financial situation and needs of any specific person who may receive it. Please be aware, that past performance is not a reliable indicator of future performance and/or results. Past Performance or Forward-looking scenarios based upon the reasonable beliefs of the third-party provider are not a guarantee of future performance. Actual results may differ materially from those anticipated in forward-looking or past performance statements. IC Markets makes no representation or warranty and assumes no liability as to the accuracy or completeness of the information provided, nor any loss arising from any investment based on a recommendation, forecast or any information supplied by any third-party.
