Running this set up again as we got stop hunted on original trdelooking to Take NZD/USD Sell set up again here, risking very small % for a possible 1/3 risk reward
disclaimer- information shared is for educational purposes only and should not be taken as Investment advice!
Forexsignalservice

CADJPY SELL BIASHello Traders,
CADJPY is in retracement mode on the Daily timeframe. On Daily timeframe price has been rejected multiple times in the previous weeks, giving us a sell bias on the lower time frames with a good risk to reward of high probability.
We are waiting for a buyer retracement, which if satisfactory as per our rules will provide us with a good entry.
BIAS: SELL
Timeframes for high precision entry: 60/15
Follow for Free Entry Signals on this trade and others from Professional Traders.

AUD/NZD Technical Setup - DownsideAUD/NZD has approached a historical resistance level, and has now broken the support trendline. Price has performed a break and retest pattern of the support trendline and we're now looking for downside into the previous support zone.

Eurchf bullish trade opportunitiesEurchf bullish trade opportunities
On this pair Buyer is very strong position market reverse from very important Fibonacci level on weekly time frame. Currently Its break short term resistance level expecting to retest at least next resistance that I have mark on chart. Its good point to take bullish trade
'"Always trade with Stop Loss"

EUR/GBP LIKELY TO RISEData coming out of Europe and also the technical set-up seems to support the next rise in EUR/GBP. We are entering at 8367 and Stop Loss at 8327.
Good luck
FB@ForexGoldOil

GBP/USD Signal - GBP Retail Sales - 17 Dec 2021GBPUSD is trending to the upside prior to the GBP Retail sales data, which measures the total receipts of retail stores in the UK. Technically the pair has performed a break and retest pattern of the resistance turned support structure. The RSI is holding at bullish levels, and we anticipate continued upside.

US30 Entries + Exits for FREE!The ENTRY/TP zones are your entries as well as your exits.
Everything above the current candlestick is resistance, you would treat every zone above as a sell/potential buy break.
Everything below the current candlestick is support, which you would then treat every zone below as a buy/potential sell break if it hits the pip rule.
More info on the strategy and how to play it:
How To Play The Chart Entries/Exits:
Buy at green support entry, if it breaks by -35 pips (count it out) then enter a sell and ride to TP1, 2 and 3. Trail stop at each TP which means place your stop loss in profit but with enough room to be able to continue the sell if it continues. Same thing at resistance, sell but if broken by 35 pips then enter the buy and ride to TP1. Each TP is a support or resistance zone , so you could then even take a sell after TP1 for the buys have been hit and if it breaks out then just repeat.
All likes/comments and feedback are very much appreciated! Thank you to all of those who support me on a weekly basis, it really does mean a ton to me!

SELL AUDCHF (166PIPS)Price formed a double top at resistance area, now waiting for price to break through support and Higher-Low to signify the start of the downtrend.

USD/JPY Signal - JPY Retail Sales - 29 Nov 2021USD/JPY is trading to the downside following surprise positive data on the JPY Retail Sales, which shows the total receipts for retail stores domestically. We anticipate continued downside, as the RSI is holding bearish!

BUY EURGBP (154PIPS)Price broke out of consolidation to the upside, expecting a retest of support area @0.84300 before we continue to the upside.

GBP/NZD Signal - GBP Retail Sales - 19 Nov 2021GBPNZD has formed a head and shoulders pattern prior to the GBP Retail Sales data today, and we are looking for continued downside on the pair. The 1H RSI remains at bearish levels, and price has recently rejected the left shoulder resistance. We are looking for downside towards the recent lows at the 1.8900 figure.

GBP/NZD - A perfect storm!Price pulled back into our area of interest, and bounced out of the resistance zone. Price is now at a support level, however we are looking for downside to continue.
On The 1H chart we can see price has formed a head and shoulder pattern, and we are looking for the neckline to break.

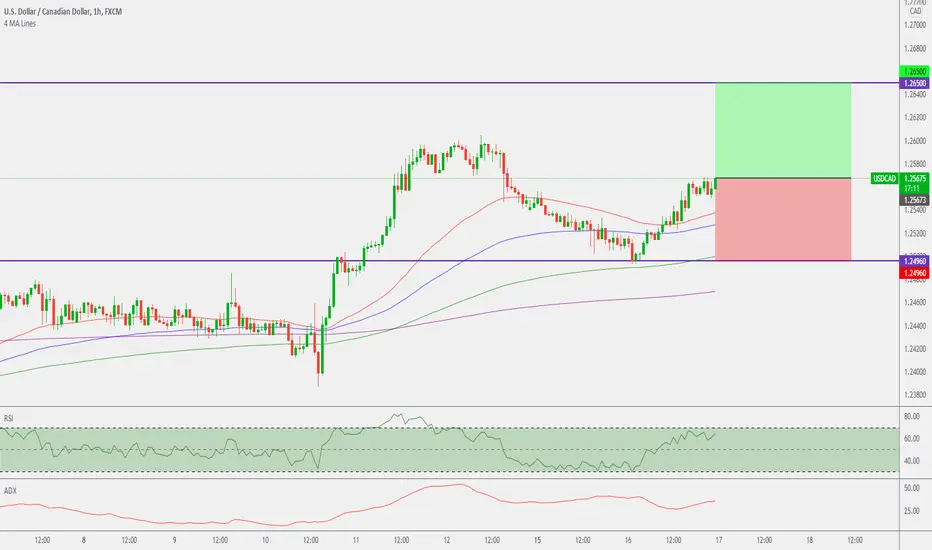
USD/CAD Signal - CAD Consumer Price Index - 17 Nov 2021USDCAD is trading to the upside currently prior to the CAD Consumer Price Index data, which tracks the change in prices across a range of goods and services and is used to measure inflation. Technically the pair is holding above the moving average ribbon, and has bounced from a key support zone. We are capitalising on the strong USD bull market with this trade, targeting upside into 1.26500.
GBP/JPY Signal - GBP Claimant Count Rate - 16 Nov 2021GBPJPY is holding bearish structure prior to the GBP Claimant Count Rate, which measures the rate of people applying for unemployment benefits in the UK.
Technically the pair is holding bearish structure on the 1H price chart, and is also trading below the resistance trendline. We anticipate continued downside into the 151.740 level.

NZD/JPY Signal - JPY Tertiary Industry Index - 16 Nov 2021NZD/JPY is trending to the upside today prior to the JPY Tertiary Industry Index data, which indicates the domestic service sector in Japan such as information and communication, electricity, gas heat and water, services, transport, wholesale and retail trade, finance and insurance ,and welfare.
Technically the pair has formed an ABCDE descending wedge pattern on the 1h chart, and has held the daily support at previous structure / the 38.2% fibonacci retracement level. We anticipate continued upside into 82.00.

NZD/USD Signal - USD Retail Sales - 16 Nov 2021NZD/USD has bounced from resistance prior to the USD Retail Sales data, which measures the receipts for retail stores domestically. Technically the pair has bounced from resistance at the previous structure and the 38.2% fibonacci retracement level. The RSI has now turned bearish, and we anticipate continued downside into the 0.6900 level.

EUR/USD - Demand DissapearedIt's like a well performed magic trick the way that Demand for the Euro against the dollar has disappeared. USD strength has returned to the market, and the EUR is the ugly duckling at the moment.
Price continued to fall, with the last three trading days each forming a fresh yearly low. We're eyeing downside to continue into the 61.8% fibonacci extension level at the significant price of 1.13000.

XAU Buy/Sell + Exit TradesThe ENTRY/TP zones are your entries as well as your exits.
Everything above the current candlestick is resistance, you would treat every zone above as a sell/potential buy break.
Everything below the current candlestick is support, which you would then treat every zone below as a buy/potential sell break if it hits the pip rule.
More info on the strategy and how to play it:
How To Play The Chart Entries/Exits:
Buy at green support entry, if it breaks by -35 pips (count it out) then enter a sell and ride to TP1, 2 and 3. Trail stop at each TP which means place your stop loss in profit but with enough room to be able to continue the sell if it continues. Same thing at resistance, sell but if broken by 35 pips then enter the buy and ride to TP1. Each TP is a support or resistance zone , so you could then even take a sell after TP1 for the buys have been hit and if it breaks out then just repeat.
All likes/comments and feedback are very much appreciated! Thank you to all of those who support me on a weekly basis, it really does mean a ton to me!

XAG Buy/Sell + Exit TradesThe ENTRY/TP zones are your entries as well as your exits.
Everything above the current candlestick is resistance, you would treat every zone above as a sell/potential buy break.
Everything below the current candlestick is support, which you would then treat every zone below as a buy/potential sell break if it hits the pip rule.
More info on the strategy and how to play it:
How To Play The Chart Entries/Exits:
Buy at green support entry, if it breaks by -35 pips (count it out) then enter a sell and ride to TP1, 2 and 3. Trail stop at each TP which means place your stop loss in profit but with enough room to be able to continue the sell if it continues. Same thing at resistance, sell but if broken by 35 pips then enter the buy and ride to TP1. Each TP is a support or resistance zone , so you could then even take a sell after TP1 for the buys have been hit and if it breaks out then just repeat.
All likes/comments and feedback are very much appreciated! Thank you to all of those who support me on a weekly basis, it really does mean a ton to me!

USDCAD Buy/Sell + Exit TradesThe ENTRY/TP zones are your entries as well as your exits.
Everything above the current candlestick is resistance, you would treat every zone above as a sell/potential buy break.
Everything below the current candlestick is support, which you would then treat every zone below as a buy/potential sell break if it hits the pip rule.
More info on the strategy and how to play it:
How To Play The Chart Entries/Exits:
Buy at green support entry, if it breaks by -35 pips (count it out) then enter a sell and ride to TP1, 2 and 3. Trail stop at each TP which means place your stop loss in profit but with enough room to be able to continue the sell if it continues. Same thing at resistance, sell but if broken by 35 pips then enter the buy and ride to TP1. Each TP is a support or resistance zone , so you could then even take a sell after TP1 for the buys have been hit and if it breaks out then just repeat.
All likes/comments and feedback are very much appreciated! Thank you to all of those who support me on a weekly basis, it really does mean a ton to me!

JPYUSD short signalTime Frame: 4H
Symbol: JPYUSD
Bias: short
Considering the over all market structure JPY pair has a potential to go down as it will be difficult for the pair to outweigh the strength of US dollar. Therefore, a short trade is more probable than a long one.

USD/JPY Signal - 11 Nov 2021USDJPY has bounced from the resistance trendline today. The pair has triggered a sell signal on the RSI, and ADX has reversed, signalling that the bullish movement has ran out of steam. We anticipate downside today into the 113.200 level.

EUR/JPY Signal - EUR Trade Balance - 9 Nov 2021EURJPY has traded into support prior to the French Trade Balance data, which shows the difference between imports and exports. Technically price is at channel support, trading in a bull flag pattern. Structure also supports price above 130.470. We anticipate a bounce into previous support turned resistance.
