Market next move Current Analysis Breakdown:
Pair: EUR/USD on a 1-hour timeframe.
Recent Action: Sharp decline with a small bullish reversal candle.
Assumption: A potential bounce or reversal targeting the area marked as "Target."
Volume: Increased during the decline and slightly bullish at the last candle.
Technical Area: The “Target” is set above the current price, implying a bullish move is expected.
---
Disrupting the Analysis:
Let’s introduce potential bearish or contrarian scenarios to question the bullish target assumption:
1. False Reversal / Dead Cat Bounce
The small green candle after a strong red volume drop could simply be a temporary retracement or a dead cat bounce—a short-lived recovery before the price resumes falling.
2. Volume Analysis Contradiction
While volume has increased, the spike occurred mostly during red candles (bearish). This indicates strong selling pressure, not accumulation. The green candle’s volume is relatively small, suggesting weak buyer interest.
Forexspecs

Market next move 🚨 Disruptive Take on the Current Silver-CFD Setup (1 h)
⚠️ Key Issue Why It Undermines the Long-Target Thesis
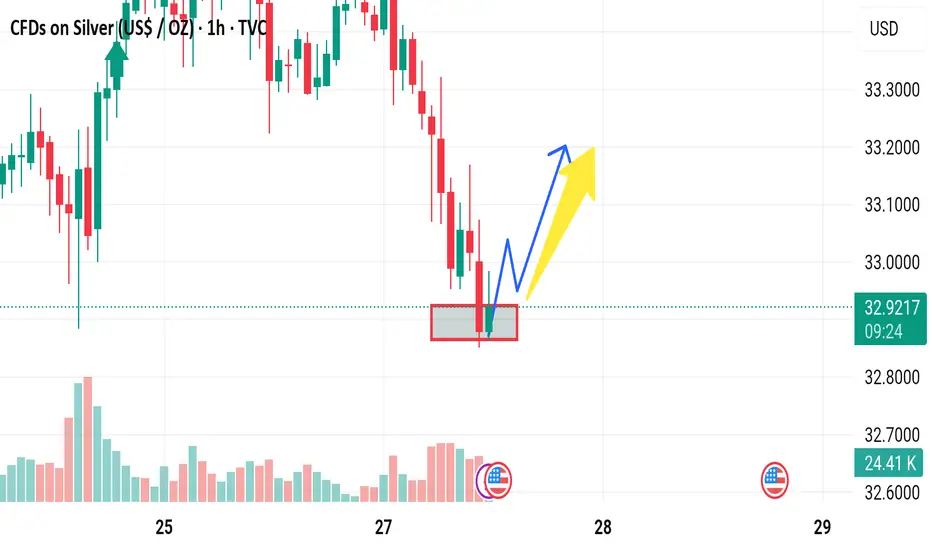
1. Target looks “wishful” The arrow projects a move into the 33.55–33.60 zone without price ever clearing the nearest resistance band around 33.30–33.35. A premature target can bait traders into chasing the tail end of a relief rally.
2. Volume doesn’t back the bounce Notice how the big green climb out of the pit on the 27 th started on strong volume, but the last 10–12 candles show shrinking green bars. Demand is decaying as price inches higher—a classic recipe for a bull trap.
3. Momentum is stalling The most recent candle printed red right at the dotted mid-line, hinting at exhaustion. Without a fresh momentum kick (e.g., higher high ➜ bullish engulfing), upside continuation is statistically fragile.
4. Structure still favors lower highs The broader pattern since the 25–26 th is a series of lower swing-highs. Until that diagonal is broken decisively, every uptick remains a counter-trend bounce, not a new up-trend.
5. Macro landmine ahead The U.S. flag icon marks an impending data release. Silver’s intraday volatility tends to spike on USD events; any dollar strength could instantly unwind the thin-volume rise. Trading into news with no contingency ≠ smart risk.
6. Stop-loss placement is unclear Without a clearly defined invalidation level (e.g., below 33.00 or under the 27 th swing-low), the R-R profile is lopsided: limited upside room vs. plenty of air underneath.

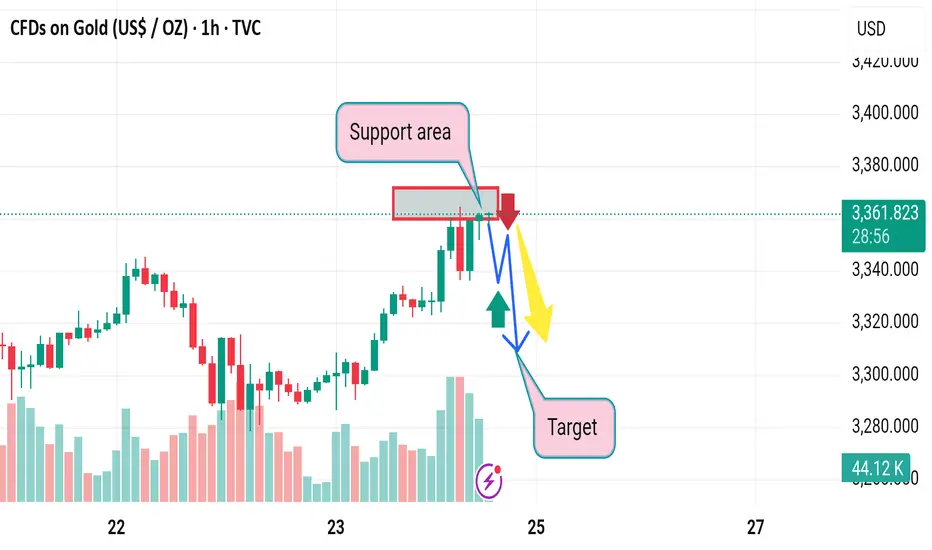
Market next move 🚨 Disruption Analysis of the Gold CFD Chart
1. Over-Optimistic Target Placement
The target is placed significantly above the current market trend without substantial confirmation of a reversal.
The recent bullish candles are weak and not supported by volume spikes.
There's a bearish engulfing pattern forming, suggesting a possible continuation of the downtrend.
2. Weak Volume Confirmation
The rise in price does not coincide with a strong increase in buying volume.
Volume bars are mixed and not clearly favoring buyers, indicating market indecision rather than strength.
3. False Bottom Assumption
The assumption that the market has bottomed on the 27th is speculative.
Without a double-bottom pattern or significant bullish divergence on an RSI/MACD (not shown here), the upward bias is unjustified.
4. Price Action Breakdown
Lower highs and lower lows are still visible.
The short bounce could be a retracement rather than a trend reversal.
5. Macro or Fundamental Events Ignored
Given the presence of the US flag icon (economic event), any upcoming data release (like GDP, interest rates, etc.) could drastically alter market direction.
Trading before news without adjusting targets and stops is risky.

Market next move
1. Misleading Bullish Label
Issue: The chart marks the latest price action as "Bullish" based on a short-term recovery.
Disruption: This could be a dead-cat bounce — a temporary recovery in a downtrend. The overall trend from the prior candles is bearish, and a few green candles don’t confirm a reversal without volume or structural confirmation.
---
2. Volume Analysis Ignored
Issue: The volume spike accompanying the recent green candles is not fully analyzed.
Disruption: Although there's higher volume, it could be short covering or a reaction to news, not organic buying interest. No volume divergence or institutional footprint confirmation is given.
---
3. No Confirmation Pattern
Issue: No mention of chart patterns (e.g., double bottom, inverse head and shoulders, etc.).
Disruption: Calling it “bullish” without a clear technical pattern or confirmation (like a break of resistance or retest) is speculative.
---
4. Vague Target
Issue: The “Target” is labeled without specifics.
Disruption: There's no price level, Fibonacci retracement, or resistance level justification. A target without rationale lacks credibility.
---
5. No Risk Management
Issue: No stop-loss or risk level is discussed.
Disruption: Without defined risk-reward ratio, the analysis is incomplete and not tradable. Every strategy needs downside planning.

Market next target Disruption of the Analysis
1. Weak Confirmation of Reversal: The chart shows a possible target zone after a recent small bullish move, but the candlestick reversal pattern is weak and lacks a strong confirmation candle. Without a bullish engulfing or a high-volume breakout, this “Target” may be premature.
2. Downtrend Momentum Intact: Despite the slight bounce, the broader trend remains bearish (visible by the previous lower lows and lower highs). No trendline break or structural shift supports a move toward the target.
3. Volume Does Not Support Breakout: Although there is a small spike in green volume, it does not exceed previous bearish volume, which suggests that buyers are not yet in control.
4. Over-reliance on Visual Targeting: The “Target” label appears to be placed based on a subjective expectation, not on a clear technical structure like a resistance level, Fibonacci retracement, or moving average. This makes it speculative.
5. Lack of Indicator Confluence: There are no visible indicators (like RSI, MACD, or EMA crossovers) shown to justify a reversal. Trading solely on price action without confirmation from indicators reduces reliability.

Market next move
Bullish Disruption Scenario
1. False Resistance Breakdown:
The red zone marked as resistance may fail to hold. The recent strong bullish candle and volume spike hint at possible accumulation rather than rejection.
2. Breakout and Retest Play:
Price could break above the resistance zone, retest it as new support, and then continue higher—invalidating the expected red and blue downward paths.
3. Volume Behavior:
The most recent green volume spike could signal strong institutional buying, which often precedes a breakout.
4. Higher Lows Formation:
Price structure is creating higher lows, which is a bullish signal in consolidation before breakout.
5. Market Sentiment:
If upcoming U.S. macroeconomic data (see flag icons) is dovish or supportive of crypto risk-on assets, BTC could rally sharply.

Market next move Bearish Disruption Scenario
1. Resistance Zone Holding (Red Box):
The current price is testing a strong resistance zone (highlighted in red).
There’s a chance that this level won't be broken easily due to historical supply or institutional sell orders.
2. Volume Spike Warning:
The recent green volume bars show increased buying, but this could signal buyer exhaustion if no significant breakout follows.
3. Fake Breakout Potential:
Price may perform a false breakout above the resistance, trapping late buyers before reversing down sharply.
4. Bearish Candlestick Confirmation:
If the next few candles form a reversal pattern (like a bearish engulfing or shooting star), it would support a short-term correction or drop.
5. Macro & News Risk:
Note the upcoming economic events (flag icons). U.S. or Japan economic data could disrupt the technical setup.

Market next move
1. False Breakout / Bull Trap Risk
Observation: Price just touched the support and bounced slightly.
Disruption: If buyers fail to push above the next resistance (around 32.95–33.00), it could be a bull trap.
Implication: The bounce might just be a short-covering rally before another leg down.
---
2. Weak Buying Volume
Observation: The bounce lacks strong green volume bars so far.
Disruption: Weak volume on the bounce suggests limited buyer conviction.
Implication: Without a volume surge, the upward move could fizzle out quickly.
---
3. Lower High Structure
Observation: The trend before the support touch is clearly down.
Disruption: This bounce may only form a lower high before continuation lower.
Implication: The larger trend remains bearish unless 33.20+ is reclaimed with strength.
---
4. Fundamental Headwinds
Disruption: Any upcoming data like strong USD, rising interest rates, or weak industrial demand could push silver down despite technical setups.
Implication: Bullish setups could fail fast due to macroeconomic pressure.
Market next move
1. Potential Bear Trap Scenario
Observation: The highlighted consolidation area could be a support zone.
Disruption: If the price quickly reclaims and holds above this zone (around 3,292), it could be a bear trap. This might attract buyers looking for a false breakdown reversal.
Implication: This could lead to a short-term rally instead of continuation lower.
---
2. Volume Divergence
Observation: Despite the breakdown, the selling volume seems to taper off compared to the previous heavy down move.
Disruption: Lower volume on a breakdown can signal weakening bearish momentum. Price might consolidate or even reverse.
Implication: Watch for bullish volume spikes as a sign of reversal interest.
---
3. Oversold RSI or Momentum Indicators
Disruption: If momentum indicators like RSI (not visible on this chart) show oversold conditions, this may suggest a relief bounce is more likely than further immediate downside.
Implication: Short-term traders could get trapped if they short too late.
---
4. Fundamental Triggers
Disruption: Any sudden positive news for gold (e.g. economic uncertainty, lower bond yields, central bank demand) can reverse this technical setup quickly.
Implication: Be cautious trading solely on technicals in sensitive markets like gold.

Market next target ---
Bearish Disruption Analysis
1. False Breakout Zone (Red Box Area):
The price is revisiting the red box area (potential supply/resistance zone). If it fails to break and close above this zone convincingly, it may signal a bull trap.
Previous attempts to push higher were rejected around this level, showing seller strength.
2. Lower High Formation Risk:
The recent upward move might form a lower high compared to the high from the 25th.
If price reverses below $33.30–$33.20, it could trigger more downside momentum, potentially targeting the $33.00 or even $32.80 level.
3. Volume Divergence:
Notice the decline in volume as price attempts to rise. Lower buying volume may indicate weak bullish conviction, which increases the risk of a downturn.
4. Bearish Candlestick Reversal Pattern:
If any bearish engulfing or shooting star candlestick forms near resistance, it would support a bearish reversal case.

Market next move
Disruption of the Bullish Bias:
1. False Breakout Risk
The area marked with a red rectangle might be showing signs of consolidation, but there's a possibility that the bullish breakout is a bull trap.
Volume does not strongly confirm a breakout; note that the volume on the recent upward candles is not significantly higher than the surrounding bars — often a sign of weak buyer conviction.
2. Resistance Overhead
BTC is approaching the psychological level of 110,000, which may act as resistance.
Price action shows several small-bodied candles with wicks, indicating indecision or rejection from higher levels.
3. Bearish Divergence Potential
If paired with RSI or MACD indicators (not visible in this image), there might be signs of bearish divergence — price making higher highs while the indicator makes lower highs.
4. Liquidity Sweep Scenario
The recent wick into the highlighted zone could be a liquidity sweep — grabbing stop-losses before reversing downward.
This would support a bearish move contrary to the bullish forecast.
5. Market Sentiment & Fundamentals
Ignoring macro events such as Fed decisions, ETF movements, or regulatory news can be dangerous. If bearish news breaks out, technical setups can fail fast

Market next target Original Analysis Summary:
Support Area Identified: Around 3335.
Expected Scenario: Bounce from support leading to a bullish move toward the "Target" zone.
Two Paths Shown: A direct bounce (yellow) or a fakeout/drop below support followed by a bullish reversal (blue arrow).
---
Disruption Analysis: Bearish Scenario
1. Support Breakdown:
Instead of bouncing at the support area (~3335), the price fails to hold and breaks down below.
Increased volume or bearish momentum could lead to this breakdown.
2. New Target Zone:
If support is broken, the next key demand zone may lie around 3300 or below, making that the new target.
Traders expecting a bounce may get trapped (bull trap), adding to sell pressure.
3. Invalidation of Bullish Setup:
The presence of consecutive lower highs leading into the support area could indicate weakening bullish momentum.
A retest of the broken support as new resistance would confirm the shift in structure (support becomes resistance).

Market next target Original Analysis Summary:
Support area at ~1.1400 holding price.
Expectation: Bounce off support and continuation to higher target.
Arrows indicate a bullish bias after minor retracement.
---
Disruptive Bearish Interpretation:
1. Exhaustion at Top:
Strong upward rally could be showing signs of buying exhaustion, especially after the sharp vertical move.
The current top wick suggests rejection from higher levels.
2. Bearish Reversal Candles:
If a shooting star or bearish engulfing pattern forms near the target area, it could signal a reversal.
The current candle shows a long wick, which often precedes pullbacks.
3. False Breakout Risk:
The price could have broken above a resistance level only to trap breakout buyers before reversing downward.
This would trigger a move below the red box (support area).

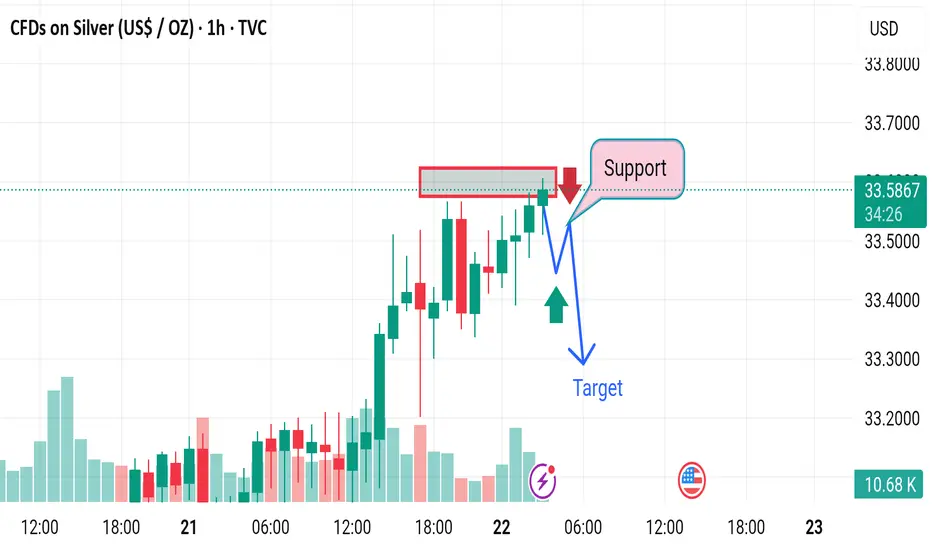
Market next target Original Analysis Summary:
Support Area marked: Price bounced from this level.
Bullish Target: Expectation is for the price to rise after retesting support.
Arrows: Indicate potential bullish continuation (yellow) or slight drop before rising (blue).
---
Disruption / Counter Analysis:
1. Weak Volume Support:
Volume in the support area is not significantly higher, which can indicate weak buying interest. This weakens the case for a strong bounce upward.
2. Double Top Risk:
The chart could be forming a double top pattern near the 33.60–33.80 region. If price fails to break above, a bearish reversal might occur.
3. Bearish Divergence:
If RSI or MACD (not shown but assumed) indicates bearish divergence, upward momentum may not sustain.
4. Support Could Break:
If the support area is tested too many times (as appears here), it may eventually fail, causing a sharp drop to the next demand zone, possibly near 33.00 or lower.
5. Macro Uncertainty:
News events (e.g., U.S. economic data or interest rate news) can abruptly reverse expected trends regardless of technical setups.

Market next target 1. Mislabeling of Support Area
The red box is labeled as a support area, but price is approaching from below, not above—so technically, this should be called a resistance area.
Until price closes above it with volume, it cannot be assumed to act as support.
---
2. Volume Misinterpretation
The volume does not strongly support a breakout. The latest green bars are not significantly larger than prior volume, implying limited bullish conviction.
Lack of volume surge through resistance is often a false breakout indicator.
---
3. Single Scenario Bias
The analysis shows only an upside (bullish) projection, ignoring bearish possibilities.
If price gets rejected from resistance, there’s a strong chance of a pullback to $33.00 or lower, especially with weak momentum.
---
4. No Confirmation Indicators
The chart lacks confirming technical indicators like RSI, MACD, or trendlines to validate the bullish scenario.
Price could be forming a lower high, indicating a possible continuation of the downtrend.

Market next target
1. Misinterpretation of Support Area
Claimed support area has already been broken previously (left of the red box), so it's no longer strong support—it might be better viewed as resistance now.
The bounce from this zone could be a liquidity trap or a fakeout, rather than genuine buying interest.
---
2. Overreliance on a Single Target Zone
The chart implies a clear target zone below, but no Fibonacci, moving average, or volume profile is shown to validate this zone.
A better analysis might include additional tools (like RSI, Bollinger Bands, or Fibonacci levels) to confirm this as a realistic target.
---
3. Volume Analysis Oversight
There is a volume spike on the most recent bullish candles, which could indicate strong buying interest, contradicting the downtrend expectation.
This might suggest a potential breakout above resistance instead of a fall.
---
4. No Risk Management Consideration
The chart lacks stop-loss levels or invalidation points, which is crucial for trading strategies.
Without a clear invalidation, the trade idea becomes more speculative.
---
5. Alternative Scenario Missing
A bullish breakout scenario (above resistance zone) isn’t given enough weight.
Given the recent strength, there is a strong case for continuation upward if the price closes above the red box with volume.
Market next move Current Analysis Summary:
Bullish Outlook: The chart suggests a bullish trend after price moves above a marked support area.
Price Scenarios:
Red arrow: Pullback to support.
Blue arrow: Bounce back upward.
Yellow arrow: Continuation of the bullish trend.
---
Disruption of the Analysis:
1. False Breakout Risk:
The move above the support zone might be a false breakout. Volume does not appear significantly increased during the breakout, which is typically needed to confirm real breakout momentum.
2. Volume Confirmation Lacking:
Although some volume is present, the breakout does not show a clear volume spike to validate strong buying interest, which challenges the bullish bias.
3. Resistance Overhead Ignored:
No mention of overhead resistance. The price may face selling pressure near 1.35000, a likely psychological and technical resistance area.
4. Over-reliance on Simple Support Zone:
The support zone is too narrowly defined. If the price dips below it slightly, it could still be a healthy retest, not a reversal, which the red arrow path implies prematurely.

Market rising up Original Analysis Overview:
Support Zone: Clearly marked.
"Flying" Point: Suggests a bullish breakout.
Target: Indicates price will rise significantly.
Arrows: Imply breakout is likely to follow bullish momentum.
---
Disruption / Contrarian Viewpoint:
1. False Breakout Risk
The tight consolidation just above the support line might indicate a bull trap—a false breakout intended to lure in long positions before a sharp reversal. The “flying” point might instead be a liquidity hunt.
Disruption Call: Expect price to briefly break above resistance and then drop below support, invalidating the bullish thesis.
2. Volume Divergence
Volume is not significantly increasing at the breakout point. True breakouts typically come with a volume surge.
Disruption Call: Weak volume suggests lack of conviction. Price may revert back into the range or breakdown.
3. Macro Sentiment Shift
If macroeconomic news (e.g., Fed policy, USD strength) flips bearish for gold, technical setups may get invalidated.

Market next target Disruption: Bullish Counter-Analysis
1. Trend Structure:
Despite the local rejection, the overall price trend has been bullish (higher highs and higher lows).
The pullback may just be a healthy retracement, not a reversal.
2. Volume Perspective:
Volume has increased on bullish candles before the resistance test — showing buyer interest.
No significant bearish volume spike to confirm a strong reversal.
3. False Breakdown Trap:
The setup might be a bear trap — a false break below minor support to trap shorts before a bounce higher.
4. Support Holds Strong:
The identified "Support" zone could act as a launch point for a bullish continuation.
If price forms a bullish engulfing or a pin bar in that area, it could invalidate the bearish thesis.
5. Macro Impact (FOMC/U.S. data nearby):
U.S. event (flag at bottom) might bring volatility.
If news is USD-negative, Silver may spike upwards regardless of technical patterns.
Market next move Disruption (Bearish/Contrarian Outlook):
1. Bearish Divergence:
If RSI or MACD (not shown) is diverging (price making higher highs, indicator making lower highs), this could signal weakness in the uptrend.
2. Rising Wedge Pattern:
The channel might be interpreted as a rising wedge, which is often a bearish reversal pattern, especially if volume declines as price rises.
3. Strong Resistance Zone:
The red rectangular zone could act as major resistance, potentially causing a false breakout or rejection rather than continuation.
4. Volume Discrepancy:
Despite the bullish move, if volume is not increasing proportionally, it might indicate a lack of conviction.
5. Potential Breakdown Path:
Price breaks below the support zone (blue trendline).
Falls to test the previous consolidation zone around $3,300 or lower.
Bearish Scenario Path (Disrupted View):
Red arrow moves sharply down through support.
New target: $3,300 or lower (next visible support).

Market next move
Bearish Disruption to GBP/USD Analysis:
1. Support Weakness:
The price action within the red box shows multiple bearish candles, suggesting the zone is under pressure.
A break and close below this box could invalidate the bullish thesis.
2. Exhaustion Signals:
After a sharp rally, the market often consolidates or corrects. The current stall near 1.3400–1.3420 could indicate buying exhaustion.
The latest candle shows a strong bearish push into the support, hinting at potential for deeper decline.
3. Decreasing Volume:
Recent green candles had falling volume, which shows lack of conviction by buyers.
Meanwhile, red (bearish) candles show rising volume, signaling increased selling pressure.
4. Failed Breakout Setup:
If this bounce fails and price closes below 1.3380, this will form a false breakout or bull trap, triggering stop hunts and aggressive shorting.
5. Macroeconomic Headwinds:
GBP is sensitive to UK data and BoE policy. Any hawkish Fed or weak UK numbers may lead to a USD rebound, pushing GBP/USD lower.

Market next move 1. Resistance Zone Already Tested
The price is currently testing a resistance zone (highlighted in red). Historically, prices have reversed from such levels unless there's a strong breakout catalyst. Without a clear breakout and volume confirmation above this zone, a reversal is plausible.
Bearish View:
If price fails to close decisively above 3,320–3,325, it may indicate a double top or false breakout setup, leading to a correction back toward 3,275 or lower.
---
2. Volume Divergence
Look at the declining volume bars while price pushes upward. This is a bearish divergence, suggesting weakening momentum behind the rally.
Bearish Implication:
Without increasing volume, the current move may lack the strength to sustain higher levels, opening the door for a pullback.
---
3. Overbought Short-Term RSI (not shown)
Assuming an RSI or momentum oscillator is present (often used with this type of analysis), there’s a high likelihood it is nearing overbought levels based on recent price action.
Bearish Risk:
Overbought conditions often precede short-term pullbacks or consolidations.
---
4. Potential Fake Breakout (Bull Trap)
The blue and yellow arrows suggest a breakout and continuation. However, a fakeout above resistance (bull trap) could lure buyers in before a reversal.
Disruption Scenario:
Price spikes above the resistance zone briefly, then sharply reverses and closes below the red box, leading to a fast drop as trapped longs exit.

Market next move 1. False Breakout from Resistance Zone
Disruption: The price is testing a resistance zone (marked red box). If it fails to hold above this zone and falls back below 32.70, it could signal a bull trap.
Impact: This could invalidate the projected upward move and initiate a drop toward 32.20 or lower.
---
2. Divergence Warning
Disruption: If momentum indicators (RSI, MACD—not visible here) show bearish divergence while price climbs, it’s a warning sign of weakening buying pressure.
Impact: This often precedes a pullback or reversal despite bullish chart patterns.
---
3. Lack of Volume Confirmation
Disruption: The breakout is not supported by a significant increase in volume (volume bar is relatively modest).
Impact: Weak volume may mean the breakout lacks conviction and can reverse quickly.
---
4. Overhead Liquidity Zone Near 34.04
Disruption: The projected target of 34.0448 could act as a liquidity magnet, but also a selling zone where large orders may get filled.
Impact: Price might spike into that area and reverse sharply.
---
5. Macroeconomic Uncertainty
Disruption: Unexpected Fed comments, inflation data, or geopolitical shifts can cause Silver to defy technical expectations.
Impact: Could result in abrupt volatility that wipes out structured setups.
