Gbpusd buying level read the caption Fed chair Powell will be appearing twice this week, on both Wednesday and Thursday as the head of the US central bank testifies about the Fed’s Semi-Annual Monetary Policy Report to the US government’s House Financial Services Committee. Headlines are expected throughout both days as the Fed chairman answers policymaker
Forextrader

Nzdusd lower more than expected read the caption which is generally a sign of weakening momentum often followed by pullbacks or reversals. In this case, if the price were to break to the upside the reversal would be confirmed, and the buyers would pile in more aggressively to extend the rally into the highs. The sellers, on the other hand, will likely lean on the resistance to position for a break below

Gold will hit new all time high read the caption London’s gold price benchmark hit an all-time high of $2150.03 per troy ounce at an afternoon auction on Monday
“This rally in gold was triggered by the softer-than-expected U.S. data and the pullback in real rates... but there has been a general bias to buy dips and a positive underlying investor sentiment towards gold that has also made the market vulnerable to the upside,” UBS strategist Joni Teves said.

AUD/NZD Short, NZD/USD Short and NZD/CAD ShortAUD/NZD Short
Minimum entry requirements:
• Tap into area of value.
• 1H impulse down below area of interest.
• If 2 touch 5 min continuation, reduced risk entry on the break of it.
• If 2 touch 15 min continuation, 5 min risk entry within it, or reduced risk entry on the break of it.
NZD/USD Short
Minimum entry requirements:
• Tap into area of value.
• 1H impulse down below area of value.
• If 2 touch 5 min continuation, reduced risk entry on the break of it.
• If 2 touch 15 min continuation, 5 min risk entry within it, or reduced risk entry on the break of it.
NZD/CAD Short
Minimum entry requirements:
• Tap into area of value.
• 1H impulse down below area of inflection.
• If 2 touch 15 min continuation, 5 min risk entry within it, or reduced risk entry on the break of it.

GBPUSD SELLING in the zone. Bears are strong Read Caption GBP/USD gathered bullish momentum and touched its strongest level since early February above 1.2700. The US Dollar struggles to find demand in the American session after the ISM Services PMI showed a loss of momentum in the service sector's expansion.Key support for GBP/USD aligns at 1.2650 (200-period Simple Moving Average (SMA), 100-SMA, Fibonacci 23.6% retracement of the long-term uptrend). If GBP/USD drops below that level and starts using it as resistance, technical sellers could take action. In this scenario, 1.2600 (psychological level, static level) could be seen as next support before 1.2540 (Fibonacci 38.2% retracement).GBP/USDGBP/USD is the forex ticker that shows the value of the British Pound against the US Dollar. It tells traders how many US Dollars are needed to buy a British Pound. The Pound-Dollar is one of the oldest and most widely traded currency pairs in the world. Follow the live GBP/USD rate with the chart and keep up to date with Pound-Dollar news and analysis. Plan your trades with the GBP/USD forecast and key pivot points data and support and resistance levels. confirm signal

WTICO/USD ShortWTICO/USD Short
Minimum entry requirements:
• If 3 touch 1H continuation or 2 touch 1H continuation with 3 touch structural approach, 15 min risk entry within it.

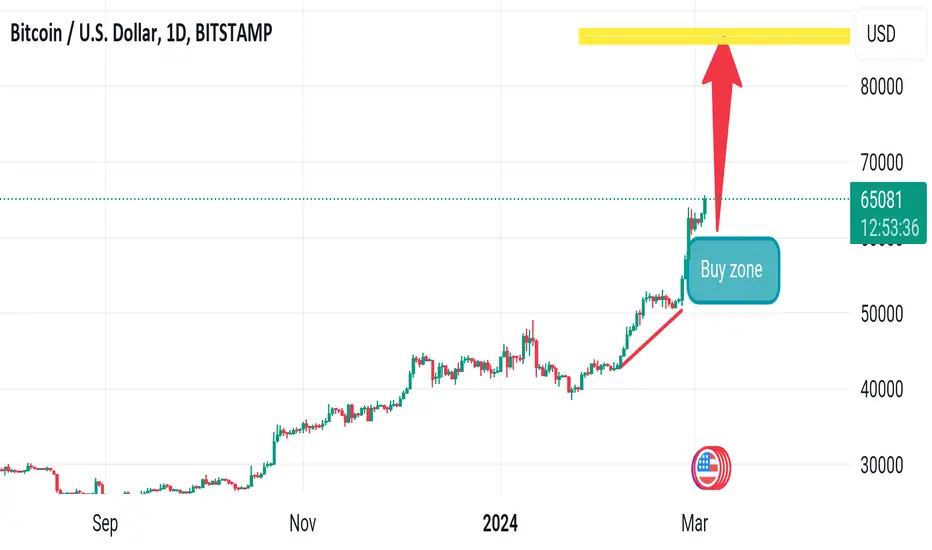
Bitcoin still buy zone target 80k read the caption It's up $2834 to $65,445 with a nearly 30% in the past week alone. It's been an incredible run that started in late October at the same time as US equities turned and accelerated as bitcoin spot ETF approval loomed. Not coincidentally, the Nasdaq also hit ran to its November 2021 highs last week and then broke them.
Another day or two like today will have bitcoin at fresh all-time highs as well. The peak level set in 2021 was $68,998 before it crashed down to $15,478 in late 2022 as interest rates rose.
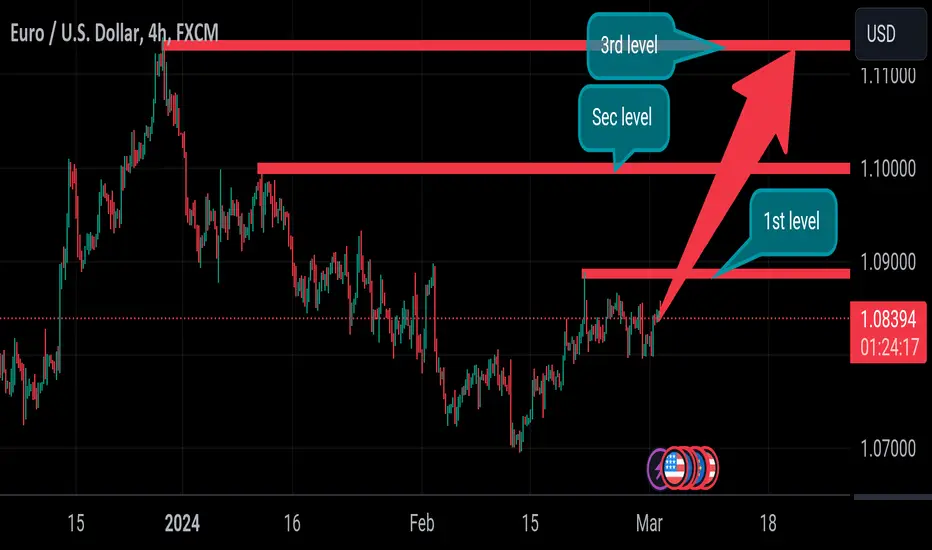
Eurusd possible analysis for confirmation read the caption In the bigger picture, price actions from 1.1274 are viewed as a corrective pattern to rise from 0.9534 (2022 low). Rise from 1.0446 is seen as the second leg. While further rally could cannot be ruled out, upside should be limited by 1.1272 to bring the third leg of the pattern. Meanwhile, sustained break of 1.0693 support will argue that the third leg has already started for 1.0446 and possibly below
WTICO/USD Short, AUD/NZD Short, NZD/USD Short and USD/CAD LongWTICO/USD Short
Minimum entry requirements:
• 1H impulse down below area of interest.
• If 2 touch 5 min continuation, reduced risk entry on the break of it.
• If 2 touch 15 min continuation, 5 min risk entry within it, or reduced risk entry on the break of it.
AUD/NZD Short
Minimum entry requirements:
• Break above area of value.
• 1H impulse down below area of value.
• If 2 touch 5 min continuation, reduced risk entry on the break of it.
• If 2 touch 15 min continuation, 5 min risk entry within it, or reduced risk entry on the break of it.
NZD/USD Short
Minimum entry requirements:
• Tap into area of value.
• 1H impulse down below area of value.
• If 2 touch 5 min continuation, reduced risk entry on the break of it.
• If 2 touch 15 min continuation, 5 min risk entry within it, or reduced risk entry on the break of it.
USD/CAD Long
Minimum entry requirements:
• Tap into area of value.
• 1H impulse up above area of value.
• If 2 touch 15 min continuation, 5 min risk entry within it, or reduced risk entry on the break of it.

Dollar bearish trend on NFP can rise read the caption The Fed must be holding back the temptation to say, ‘we told you so’ now that market expectations match those released in the Fed’s December summary of economic projections. Three rate cuts in 2024 is the new expectation, down from six and potentially seven at one stage. As such, the dollar has found its footing in the early weeks

Gold will breakout 2150 then next target 2200 read the caption Xauusd aims for a strong weekly gain as investors choose the early rate-cut narrative in the US, shrugging off recent doubts over its timing. In the monetary policy statement, the Federal Reserve (Fed) didn’t explicitly refer to upcoming rate cuts amid the absence of enough evidence that underlying inflation will sustainably return to the 2% target. However, policymakers already

Usdjpy dropping level sell it read the caption The USDJPY is moving to new at session highs, and in the process as extended above the swing area between 149.81 and 150.158. Yields in the US have turned around and are now higher on the day. The two year yield is at 4.642% up 3.0 basis points. The 10 year yield is up 2.4 basis points at 4.30%.
At 1 PM today, the U.S. Treasury will auction off 20-year notes. At 2 PM

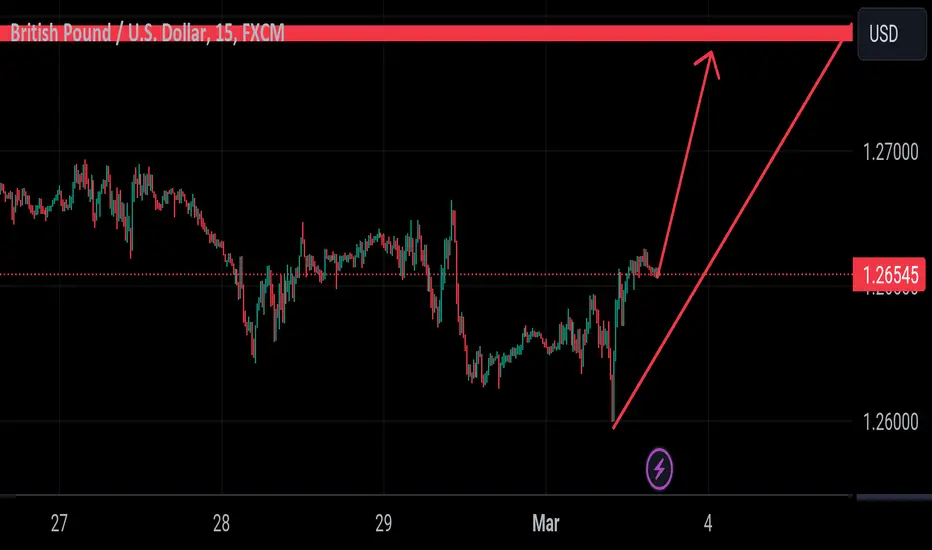
Gbpusd jumping level read the caption Today, the GBPUSD experienced an upward movement, driven by a wave of dollar selling in response to lower interest rates. However, the pair's momentum encountered resistance at a key technical level—the 200-bar Moving Average (MA) on the 4-hour chart. This same MA had previously halted the pair's advance a week ago, leading to a decline in price. The fact that this level has now twice acted as a barrier underscores its significance for future trading. A sustained position below this level would indicate that sellers are maintaining control. Currently, the 200-bar MA is positioned at 1.2662
Oil going to cheap according to news read the caption have topped $76barrel in the past two sessions for US benchmark West Texas Intermediate crude, with broad oil prices lifted further by signs of some demand resilience in China. Refineries there are reportedly still buying plenty of crude which has gone some way to lift the gloom over likely Chinese energy demand, a major headwind for oil prices in the past year

Gold still gain momentum read the caption Gold is down 0.2% to $2,041 after a push earlier to $2,047 levels to start European morning trade. It coincides with a move higher in yields, with 10-year Treasury yields now up 2.7bps to 4.27% on the day. But perhaps gold's slight retreat is also a more technical-related one. Here is a look at the daily chart

Eurusd can't stop uptrend read the caption The EUR/USD daily chart sees the pair remaining confined to the 1.0801 -1.0861 area during the last three days, bracing around the 200-day moving average (DMA) at 1.0822 Relative Strength Index (RSI) studies turned bullish, but buyers need to achieve a daily close above last Friday’s high, to remain hopeful of testing the 50-DMA at 1.0881 ahead of the 1.0900 figure. Otherwise, the pair could dive towards the 200-DMA and below, exposing the 1.0801

Gold record making move read the caption Gold according to the 1-hour chart, XAU/USD lost momentum but holds on to gains, limiting the risk of a steeper slide. The 20 SMA heads firmly north, far below the current level, momentum, while the longer moving averages remain directionless. XAU/USD hovers around a flat 100 SMA Technical indicators, in the meantime, eased from near overbought readings, reflecting the ongoing retracement rather than suggesting

EURUSD Great time For SHORT PO price fail to make higher high and even fail to break the trend line and even to test the old high price range , we expect price will continue dropping

Eurusd will break out read the caption Eurusd On the 1 hour chart, we can see more closely the recent price action with the consolidation between the 1.07 support and the black trendline. We should find the sellers around the trendline if the price were to get there, but overall it will be a waiting game until we get a breakout on either side

EUR/USD Trade Recap, NZD/USD Short and NZD/CAD ShortNZD/USD Short
Minimum entry requirements:
• Tap into area of value.
• 1H impulse down below area of value.
• If 2 touch 5 min continuation, reduced risk entry on the break of it.
• If 2 touch 15 min continuation, 5 min risk entry within it, or reduced risk entry on the break of it.
NZD/CAD Short
Minimum entry requirements:
• If 3 touch 1H continuation or 2 touch 1H continuation with 3 touch structural approach, 15 min risk entry within it.

Btc hit 64k next will hit 70k read the caption Reuters cites a letter from Grayscale CEO Michael Sonnenshein, who described the SEC rejecting options on its Grayscale Bitcoin Trust (GBTC.P), as an unfair discrimination against its shareholders, adding that the regulator has previously approved options on ETFs tied to BTC futures.
"It is vital to the interests of GBTC and all spot Bitcoin investors to access exchange-listed options on GBTC and other spot Bitcoin ETPs

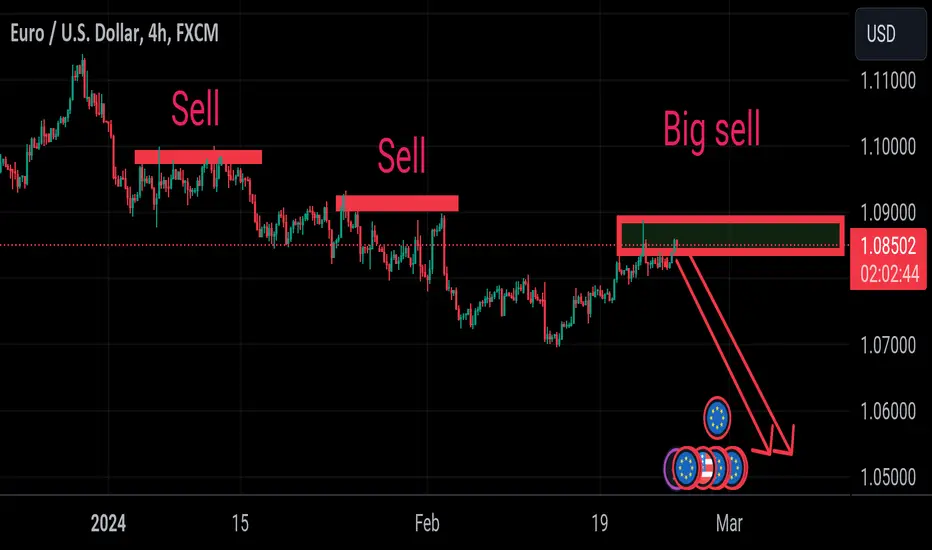
Eurusd return to sell read the caption The EUR/USD daily chart sees the pair remaining confined to the 1.0801 -1.0862 area during the last three days, bracing around the 200-day moving average (DMA) at 1.0821 Relative Strength Index (RSI) studies turned bullish, but buyers need to achieve a daily close above last Friday’s high, to remain hopeful of testing the 50-DMA at 1.0882 ahead of the 1.0901 figure. Otherwise, the pair could dive towards the 200-DMA and below, exposing the 1.0801
CAD/JPY Short, EUR/USD Long and NZD/CAD ShortCAD/JPY Short
Minimum entry requirements:
• If 3 touch 1H continuation or 2 touch 1H continuation with 3 touch structural approach, 15 min risk entry within it.
EUR/USD Long
Minimum entry requirements:
• If 2 touch 1H continuation, 15 min risk entry within it, or reduced risk entry on the break of it.
NZD/CAD Short
Minimum entry requirements:
• If 3 touch 1H continuation or 2 touch 1H continuation with 3 touch structural approach, 15 min risk entry within it.
