Gbpusd surely Fall big dips read the caption The GBP/USD pair retreated slightly after the latest US inflation data. According to the Bureau of Labor Statistics (BLS), the headline Consumer Price Index (CPI) rose by 3.2% in January, higher than the expected 2.7%. Core inflation rose by 3.8%, higher than the expected drop to 3.6%.
These numbers mean that inflation is still high in the country and that it will likely struggle to get to Fed’s target of 2.1%. It has remained between 3.2% and 3.3% in the past few months as the Fed has maintained rates at a 22-year high
Forextrader

Gbpusd below line now big dipsThe GBP/USD pair retreated slightly after the latest US inflation data. According to the Bureau of Labor Statistics (BLS), the headline Consumer Price Index (CPI) rose by 3.2% in January, higher than the expected 2.7%. Core inflation rose by 3.8%, higher than the expected drop to 3.6%.
These numbers mean that inflation is still high in the country and that it will likely struggle to get to Fed’s target of 2.1%. It has remained between 3.2% and 3.3% in the past few months as the Fed has maintained rates at a 22-year high

GBPAUD: Time For Pullback?! 🇬🇧🇦🇺
GBPAUD may retrace from a key horizontal resistance.
After an impulsive yesterday's movement, the pair became overbought
and formed a double top pattern on an hourly time frame.
I expect a bearish move to 1.946
❤️Please, support my work with like, thank you!❤️

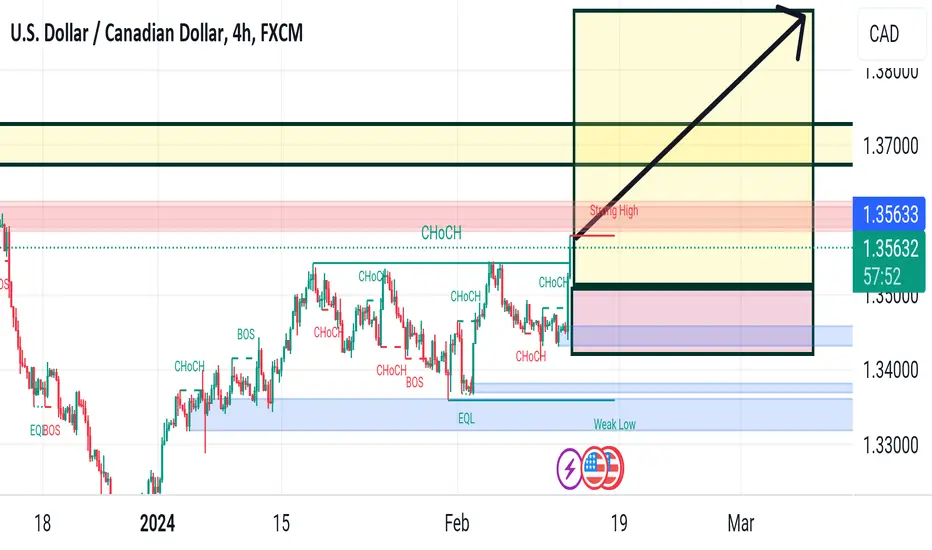
Usdcad ready to fly read the caption If they stay higher for longer, it could chase out some springtime home buyers and put a fresh chill on the market. Moreover, Canada's broader economy isn't weathering high rates as well as the US Prolonging high rates could lead to a rougher recession or . if Canada cuts and the US keeps rates high -- open up wider rate differentials. That's something that could re calibrate USD/CAD higher and lead to a challenge of the 2023 highs near 1.3874
Gbpusd PIPS rain coming Sell zone read the caption On the 1 hour chart, we can see more closely the recent price action with the pair ranging between the 1.2612 support and the 1.2643 resistance. We can notice that the price has already broken the triangle to the downside, but we will need also a break below the support zone to confirm the breakout. Watch out for the data today as it will add extra confirmation for a breakout on either side.

Eurusd bottom is coming downfall read the caption EUR/USD’s consolidation from 1.0722 is still extending and intraday bias remains neutral. While stronger recovery cannot be ruled out, outlook will stay bearish as long as 1.0895 resistance holds. On the downside, sustained break of 1.0732 will argue that whole rise from 1.0446 has completed. Deeper fall would then be seen to target this low

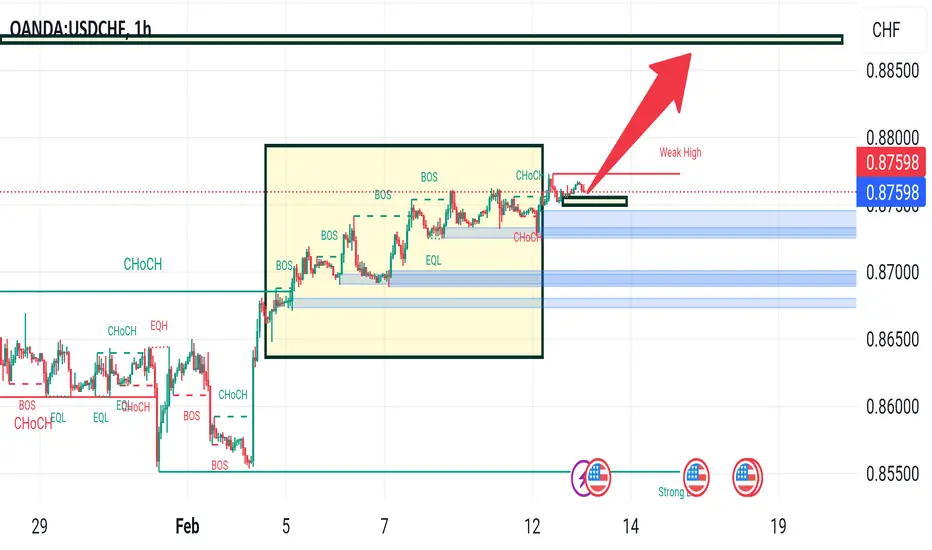
Usdchf ready to break all time high read the caption Intraday bias in USD/CHF remains on the upside despite loss of momentum as seen in 4H MACD. Current rise from 0.8333 should target 61.8% retracement of 0.9244 to 0.8333 at 0.896. On the downside, below 0.8724 minor support will turn intraday bias neutral first. But near term outlook will stay cautiously bullish as long as 0.8551 support holds.
Another buy target of BTC 52000 read the caption BTC hit 50000 but another target 52000
We encourage you to use comments to engage with other users, share your perspective and ask questions of authors and each other. However, in order to maintain the high level of discourse we’ve all come to value and expect, please keep the following criteria in mind

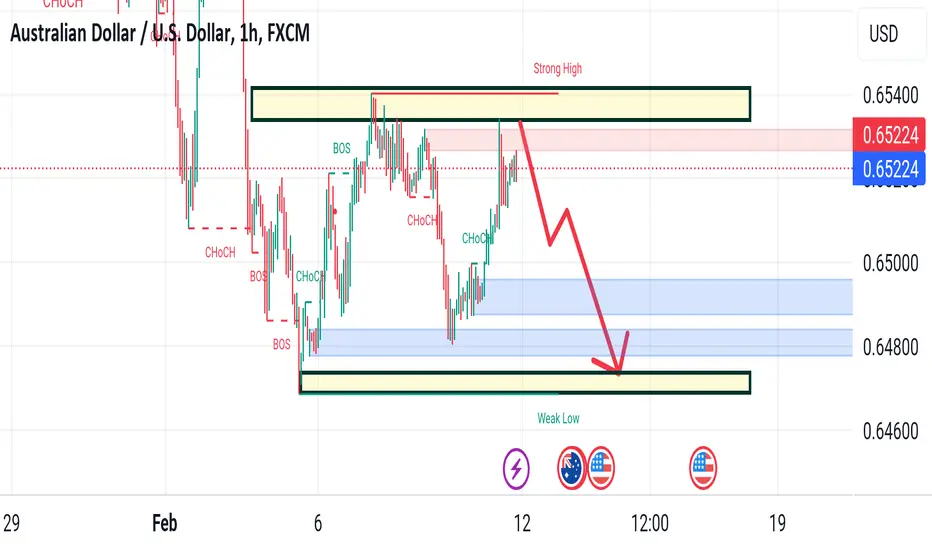
Never sell audusd confirm buy read the caption The AUDUSD is trading higher and lower in trading today in a narrow range. The high prices, however, have been able to stay below its 100-day moving average at 0.65316 The high price for the day came in at 0.65305. Also in play is a swing area at 0.65239. That level goes back to November through February where there have been several swing lows/highs at the level.

Xauusd up down move on CPI read the caption Gold up down move
In extreme situations, the Federal Reserve may resort to a policy named Quantitative Easing (QE). QE is the process by which the Fed substantially increases the flow of credit in a stuck financial system.
It is a non-standard policy measure used during crises or when inflation is extremely low. It was the Fed’s weapon of choice during the Great Financial Crisis in 2008.

Nzdusd going up more than expected read the caption Nzdusd lower more than expected
The RBNZ’s steep rate-tightening cycle, which has raised the benchmark rate to 5.4%, has significantly lowered inflation but there is more work to be done. Orr & Co. wouldn’t mind maintaining rates in restrictive territory in order to continue pushing inflation lower.
We’ll get a look at New Zealand inflation expectations for the first quarter on Tuesday, which could move the New Zealand dollar. In the fourth quarter, inflation expectations eased to 2.75%, down from 2.82%, which was its lowest level in two years.

EURAUD | Daily | OutlookLooking at EURAUD from a purely technical observation we can take note of the fact that the EURAUD has broken out of our long standing bullish monthly trend line which has started to point us towards a new bearish sentiment/bias in the long term, now looking further into it we can also notice that on top of breaking out of our monthly bullish trend we can notice that on our weekly chart we’ve also managed to identify the breakout of an ascending channel which was formed on the weekly chart further adding on to our newly founded bearish sentiment/bias.
Now with all that said we look further down moving to our daily time frame we can see that at the beginning of the year EURAUD found some support at our 1.61213 level after the market broke out of our ascending channel in November last year and started trading upwards where we saw that bullish momentum take a pause when the market reached our 1.66xxx & 1.668xx respective area creating what looks like a consolidation between the 1.668xx and 1.635xx levels which is now our current trading range.
With the above observation in mind we can see EURAUD bounce off near the top of our range at 1.66xxx where we can expect EURAUD to push downward a bit to bounce off the bottom of our current minor range before pushing up to our 1.712xx to 1.72xxx respective area where we’ll look towards the market creating a new resistance which will further confirm our overall bearish sentiment which we’ll be looking to take advantage of over the long term.
Please note that the current analysis and observation is comprised solely of my own personal opinion, sentiment and bias of the market; so please be sure to confirm with your own analysis before taking any trading decisions based on the above information as I am not liable for any profit or loss you may incur while using the provided information.

Usdcad PIPS gain target area read the caption On the flip side, momentum beyond the 1.3475 area (200-day SMA) is likely to confront resistance near the 1.3500 psychological mark ahead of the 1.3530- 1.3543 region, or the multiple-tops. A sustained strength beyond the latter will negate any near-term negative outlook and pave the way for some meaningful appreciating move. The USD/CAD pair might then accelerate the positive move towards the 1.3600 round figure and the 1.3611- 1.3625 supply zone

eurusd strong sell zone read the caption Eurusd
The low last week tested the December low of 1.0724 and buyers held their ground. Since then, price action has been a bit more muted though. The 100-day moving average (red line) has kept a lid on any upside move while the floor remains at the December low. It shows that traders are respecting the key technical channels in play - at least for now.
Considering that we have the US CPI data tomorrow, the movement today is likely to be fairly muted as well. Barring any surprise headlines, traders will be waiting on the inflation numbers tomorrow before chasing any major move

CAD/JPY Short and EUR/USD ShortCAD/JPY Short
• If price impulses down below our area of interest on the one hour chart and a subsequent two touch fifteen minute flag forms, then I'll filter the latter on the five minute chart and be looking to get short with either a risk entry within it if the flag is structured, or a reduced risk entry on the break of it if it's unstructured or I don't manage to secure a risk entry.
• If my entry requirements are not met then I will simply wait until another setup which meets my plan materialises.
• If there's any ambiguity then I will not place a trade on this pair.
EUR/USD Short
• If price pushes up to and ideally just above our area of value, then regardless of how it does so I'll be waiting for a subsequent impulse back down on the one hour chart followed by a tight two touch fifteen minute flag and then I'll filter the latter on the five minute chart and be looking to get short with either a risk entry within it if the flag is structured, or a reduced risk entry on the break of it if it's unstructured or I don't manage to secure a risk entry.
• If my entry requirements are not met then I will simply wait until another setup which meets my plan materialises.
• If there's any ambiguity then I will not place a trade on this pair.

Seller can get loss on Usdjpy go buy read the caption Uchida’s comments are followed closely as he is known for dropping hints around key developments. USD/JPY continues to grind higher as markets distance themselves from notions of imminent rate changes stemming from the BoJ. The 150 marker is near-term resistance, with 146.51 appearing as support. Recent commentary and the notable lack of concern around the weakening yen opens the door for another test of 150

Next week xauusd idea read the caption (XAU/USD) fell modestly this past week, but lacked a strong directional bias, with the metal moving up and down around the 50-day simple moving average, a clear sign of consolidation. The market's lack of conviction is not likely to end until prices either breach resistance around $2,060 or support near $2,006

Xagusd sell zone read the caption Xagusd is downward biased but has bottomed out at around $22.15-$22.50, which has opened the door for an upward correction. If buyers could lift prices toward $23.00 per troy ounce, that could open the door to test the 100-day Moving Average (DMA) at $23.09, followed by the 50-DMA at $23.26.
On the other hand, a ‘death cross’ formed three days ago on the path of least resistance, a bearish signal that could clear the path for further downside. The next support surfaces at the January 22 low of $21.92, followed by the October 23 pivot low at $20.68

Bottom is coming of eurusd read the caption The EUR/USD remains pinned on the south side of the 200-hour Simple Moving Average (SMA) just beneath 1.0800. Although the pair continues to recover into the upside from the early week’s bottom near 1.0725, topside momentum remains capped, with longer-term technical patterns remaining decidedly bearish.
Despite posting three straight days of gains and on pace for a fourth, the EUR/USD remains on the bearish side of the 200-day SMA at 1.0834. The pair is still down over 3% from late December’s peak of b1.1141,

SasanSeifi 💁♂ Two Possible Scenarios for the 4-Hour TimeframeIn the 4-hour timeframe, as you can see, after correcting from the 1.11 range, the price is in a range of 1.095. Based on the behavior of the candles, the possibility of correcting the price to the range of 1.084 / 1.080 can be considered.
A scenario that we can consider in the 4-hour timeframe is that the price will be accompanied by a correction to the price range of 1.090 after ranging and confirmation. Then, if there is a pullback, it will again face more correction to the FAIR VALUE GAP and the order block range.
Also, another scenario that can be considered is as follows: After ranging and partial positive fluctuations from the price ranges of 1.10 / 1.10400, after collecting liquidity and confirmation, we will see the price rejected and corrected. In case of positive fluctuations, to better understand the continuation of the movement trend, we must see how the price reacts to the resistance ranges.
Potential trends and support and resistance ranges are also shown in the image above, respectively.
🔵Remember, always conduct your analysis and consider other factors before making any trading decisions. Good luck!"✌️
❎ (DYOR)...⚠️⚜️
Sure, if you have any more questions or need further clarification, feel free to ask. I'm here to help!
if you found my analysis helpful, I would appreciate it if you could show your support by liking and commenting. Thank you!🙌✌

USDJPYhere what i think about usdjpy i hope i made easy to understand,if not let me know in the comment. if 150.500 break above with bullish possibility that usdjpy can make new higher which is 153.500 to 153.900. so here waht i say look for buy opportunity with great confirmation. always risk 1%. thank you .

Audusd weekly chart read the caption In the long term picture, the down trend from 1.1079 (2011 high) should have completed at 0.5526 (2020 low) already. It’s unsure yet whether price actions from 0.5506 are developing into a corrective pattern, or trend reversal. But in either case, fall from 0.8026 is seen the second leg of the pattern. Hence, in case of deeper decline, strong support should emerge above 0.5516 to bring reversal.
GBPNZD: Important Breakout & Bearish Outlook 🇬🇧🇳🇿
GBPNZD nicely respected a major horizontal resistance on a daily.
After its test, the price formed a descending triangle formation,
then we saw a breakout of 2 major supports.
The pair will most likely keep falling.
Goals: 2.0375 / 2.024
❤️Please, support my work with like, thank you!❤️
